LIFESCI 2A03 Final Content
1/68
There's no tags or description
Looks like no tags are added yet.
Name | Mastery | Learn | Test | Matching | Spaced |
|---|
No study sessions yet.
69 Terms
Exposure
The word used in observational studies for the independent variable (ex. age, education status, smoking)
Intervention
The word used in interventional studies for the independent variable (ex. administration of a drug, use of a therapeutic procedure)
Risk ratio
The probability of an exposure causing an outcome. Reported in cohort studies, cross-sectional studies, and clinical trials
P(event) in exposed/P(event) in non exposed
Odds ratio
Probability of an event occurring versus not occurring. Reported in case-control studies and cohort studies.
Which study provides the strongest evidence of a causal relationship?
Cohort studies because:
Grouped based on the independent variable (exposure)
Longitudinal
When are the odds ratio and risk ratio the same?
When the event is rare
Interpreting RR and OR when P and CI are statistically significant
>1 = increase of R/O in exposed group
<1 = decrease of R/O in exposed group
Main cause of cancer
Uncontrolled and increased cell proliferation
Tumour heterogeneity
Many types of cells make up the tumour
Hierarchical model of tumour growth
Cancer stem cells (CSCs): high self-renewal capacity, drives cancer growth and relapse
TA cells: limited proliferation
Non-proliferative cancer cells
Driving force of carcinogenesis
Accumulation of DNA alterations and mutations in dividing stem cells
Evidence of the SC division theory of cancer
Most cancers arise in tissues with high turnover and are uncommon in tissues with low turnover
Cancer incidence increases with age, especially in issues with high turnover
Organs/tissues with very low regenerative capacity are less likely to develop primary tumours
Prognosis
Outcome of patients with the affliction
Neural stem cell niches
Subventricular zone (SVZ)
Subgranular zone (SGZ)
NSC niches and GBM relapse
NSC niches may be sources of CSCs that drive GBM relapse
Incidental research
Researchers are examining an incidental outcome that was a side effect of something else and therefore don’t decide the protocol
Hazard ratio
Same thing as risk ratio but in the context of survival, used in survivorship studies
Prognostic factors
Predictor of the prognosis of a patient (could be confounders in a study)
K-M analysis + purpose
Statistical analysis used to measure the probability of patient survival time after an intervention
Only analyzes 1 prognostic factor
Can compare two groups via a log-rank test
Studies the efficacy and safety of a treatment
Progression-free survival (PFS) + what is it an alternative for?
Main event of interest is progression, measuring the time between treatment and observed progression. Alternative to overall survival (OS) since PFS appears much sooner (making studies shorter) and is not always proportional to survival
Multivariate Cox regression analysis + purpose
Calculates hazard ratios per risk factor
Can analyze multiple prognostic factors simultaneously
Assess the survival of a treatment while controlling for confounders and covariates
Confounders vs covariates
Confounder: extraneous, not of interest, covariate variable linked to the predictor and the outcome variable
Covariate: 3rd variable that is linked to the outcome variable but not the predictor
Risk vs prognostic factors
Risk factors: increase the probability of developing a condition
Prognostic factors: associated with/influence the outcome in people who have the condition
Historical controls + advantages
Groups and data from past, external studies being used as control groups. Often used in clinical studies and help reduce patient recruitment + costs
4 types of comparison groups
Standard treatment (active)
Placebo
Dose-response (several groups with different dosages of the treatment)
Historical
Parallel CT design
Subjects stay in their assigned groups. Cheaper and faster
Crossover CT design + advantages
Subjects switch to the other group after a washing period. Minimized variation between groups, no additional participant recruitment
Simple randomization + ideal sample size
Subjects are assigned using pure chance. Ideal for large sample sizes
Block randomization + ideal sample size
Randomizes participants within fixed-size blocks. Ideal for sample sizes less than 100
Stratified randomization + ideal sample size
Balances groups across important covariates (ex. sex, age). Ideal for sample sizes less than 100
Why is blinding/masking important?
Increases internal validity and reduces performance, assessment, and attrition bias in experiments
Early phase 1 (0) of CT
Exploratory
See whether and how a treatment affects the body (NOT therapeutic or diagnostic)
Micro doses
Very small number of participants
Phase 1 of CT
First application in humans
Test safety + tolerability with low doses
n=20-100
Healthy volunteers
Phase 2 of CT
Therapeutic trial phase
Finding the optimal dose + safety
n=100-500
First application in patients with disease
Phase 3 of CT
Therapeutic confirmation
Confirming the safety + effectiveness and comparing it to other drugs
n=1000-5000
Phase 4 of CT
Long term observation
Therapy optimization + safety monitoring to see interaction with other drugs
Very large number of patients
Arms in CTs
Another word for groups. Comparative arm = control group
Primary outcome
The most important/of interest outcome for evaluating an intervention. 1 or more can exist in a study
Secondary outcome
Not as important as the primary outcome, but still of interest. May become primaru in future studies. 1 or more can exist in a study
Objective/hard outcomes
Unambiguous and consistently measured, ideal to minimize bias and improve validity
Subjective/soft outcomes
Based on interpretation of the assessor. If used, attempts should be made to reduce bias (ex. calibrated tools, blinding, randomization, standardizing data collection)
Summary statistics + chart types + issues with it
Summarizes data, therefore hiding raw data. Includes line charts, bar charts, and boxplots. Important information, such as distribution, outliers, and variability, is hidden, which may lead to an incorrect conclusion.
What chart is suitable for small data sets?
Scatterplots with bars representing the mean
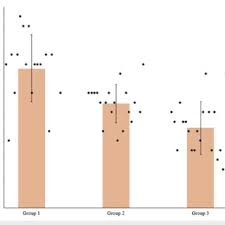
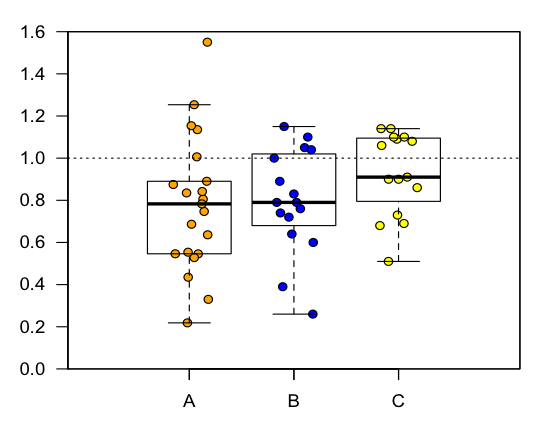
What chart is suitable for medium data sets?
Bee swarm plot with error boxes representing variance
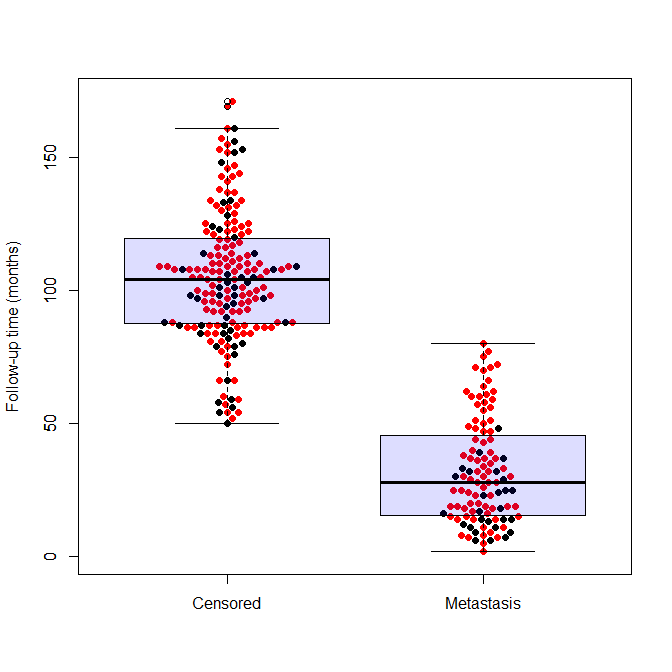
What chart is suitable for large data sets?
Dot plots with boxplots as visual aids
Pie charts + issues
Used to display categorical proportions using size. Represents 1-dimensional data + human perception struggles to compare areas
Boxplots versus beeswarm plots
Boxplots: summary statistics for large data sets
Beeswarm: show individual data points, provides raw data, for medium data sets
What is the recommended colour palette + aspect ratio for graphs?
Monochromatic/colour blind safe palettes, landscape format that is 50% wider than tall
What effect does sample size have on variation?
Reduces variation, which increases statistical power
What graph should be used to represent continuous data + what should it not be used for?
Line graphs. Do not use for discrete data, creates misleading continuity
R²
Correlation coefficient, describes the strength of the correlation between two variables
Placebo effect
Patients believe that they are experiencing a positive, real effect from something that is not medicinally active
Psychological mechanism behind the placebo effect
Classical conditional, which creates an association between two stimuli (some factor of the treatment + the experienced effect)
Physiological mechanism behind the placebo effect
The brain can release chemicals so that a real change is experienced
Nocebo effect
Negative expectations about a treatment cause an adverse reaction
How is the placebo effect controlled for?
Including placebo groups as negative controls, double-blinding, randomization, and minimizing variation between groups
When do you fail to reject Ho?
If the p-value > alpha and the confidence interval includes the null value (0 for means, 1 for RR/OR)
Which methods of controlling for confounders/covariates do you NOT need to know the specific confounders/covariates for?
Randomization of a large sample size and block randomization
Restriction
Controls for known confounders by restricting the study to 1 confounder (ex. a study consisting only of females)
Matching
Controls for known confounders by balancing variables across groups to reduce variation
Is randomization feasible for observational studies?
Usually no
Immunohisto/cytochemistry
Determines the expression of proteins in cells, fluorescently labels them. Allows us to find the expression of a certain gene and idenitify specific cells
RNAi
Knocking down genes to study cause-effect relationships and gene function in specific processes
RT-PCR
Detects gene expression on the transcriptional level by measuring mRNA
Western blot
Detects gene expression on the translational level by measuring protein
Clinical vs pre-clinical experiments
Clinical: provides relevant info for expression and prognosis in humans
Pre-clinical: opportunity to study cause-effect relationships, easier to manipulate (less ethics), but not feasible to conduct CTs
Describe the 3 trends of clinical trial phases
Participant number increases
Number of unhealthy subjects/subjects with the target affliction increases
Length of the phase increases
Emergency use authorization (EUA)
A vaccine hasn’t completed clinical trial but is approved for use. Compromises ongoing clinical trials because it is unethical to withhold an effective treatment from the placebo group
Ethical crossover
Giving the placebo group the intervention after the trial is complete (you can;t withhold it from them ethically)