PSYC 190 - Achievement Gap & Learning Styles
1/31
There's no tags or description
Looks like no tags are added yet.
Name | Mastery | Learn | Test | Matching | Spaced |
|---|
No study sessions yet.
32 Terms
(VIDEO 5.56) TIMSS (National Center for Educational Statistics)
the statistics & research branch of the US department of Education
one large international study of math & science achievement conducted every 4 years since 1995
looks at children from 50 different countries (US included)
called “Trends in international mathematics & Science study”
(VIDEO 5.56) TIMSS Findings
repeatedly found that American 4th & 8th graders rank in the top 10 internationally in both math & science
(VIDEO 5.56) NAEP (National Assessment of educational Progress)
also known as national report card
measures 4th, 8th, 12th grade math, reading & science
doesn’t directly compare US kids to children overseas
tells us that overall math & reading ability have not been getting worse over time but in fact have shown some measurable improvement since 1970s
(VIDEO 5.56) PISA (Program for International Student Assessment)
tests math, science & reading ability in 15 year olds (9th &10th) across 41 different countries
this is the one that finds the poorest performance by American students
(VIDEO 5.56) Overall findings in performance
the TIMSS & PISA find that Singapore, China, Hong-kong, South Korea, & Japan are at the very top in math
American children rank 10th on the TIMSS & 35th on the PISA
below the international average
on the PISA, US is below average in science
PISA, the US is below the international average
(VIDEO 5.56) 2005 Study (American Institute for Research)
point out that previous comparisons of the TIMSS & PISA neglect to account for the fact that these studies include very different countries
the PISA includes more wealthy European countries that perform very well, which aren’t included in the TIMSS sample
when we remove certain countries from the PISA we learn that this means that kids probably aren’t lagging because of too little focus on applied math
the study suggests that we may focus little on certain skills
(VIDEO 5.56) Conclusion on study comparisons
these comparisons tell us that we’re indeed lagging behind the top performing countries in the world but it is partly due to the curriculum
also due to failure to encourage teachers to seek out advanced training in mathematics
(VIDEO 5.56) Teacher & Student correlation
analysis indicate that measures of teacher preparation & certification are by far the strongest correlates of student achievement in reading & mathematics
before & after controlling for other factors (like student poverty, language spoken at home)
(VIDEO 5.57) Differences between students
from the time that data has been collected to present day, affluent white children have outperformed poor white children & children from minority backgrounds (except for Asian Americans & African immigrants who outperform any other group in the US)
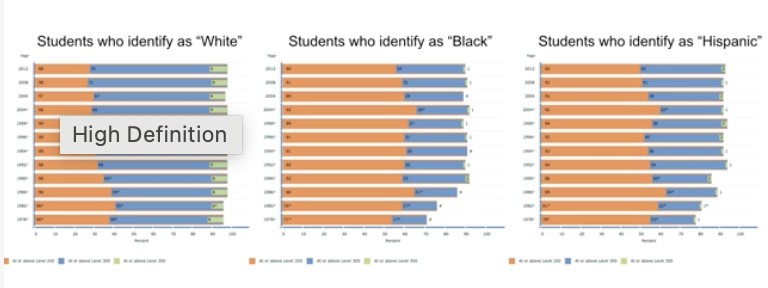
(VIDEO 5.57) Performance based on race
(VIDEO 5.58) What causes academic achievement differences between affluent & student who identify as Black/Hispanic?
one side of the debate has argued that intellectual/academic differences between groups are partly due to genetic differences
others have argued that the evidence for IQ differences are based on tests that are culturally biased to favor white kids
(VIDEO 5.58) Behavior genetics & adoption studies - NAEP data
we find that factors like wealth and parental education are hugely correlated with children’s academic achievement
could be that parents pass on successful genes or they provide a supportive learning environment (by virtue or parenting) or simply because adopted kids tend to move from poorer neighborhoods with weaker schools to more affluent neighborhoods with better schools
(VIDEO 5.58) Adoption & academic achievement
study done in 1973 by Dennis who looked at how children adopted from a Lebanese orphanage performed on IQ tests and how their performance compared to non-adopted children who remained in the orphanage
found that the adopted children had IQs comparable to typically developing children
non-adopted kids who remained in the orphanage scored substantially lower, around 65 (at the time resulted in a classification of mental retardation)
(VIDEO 5.58) IQ study in the US
1976 study found that black children adopted before the age of 12 months by wealthy white families scored above average in IQ tests & outperformed the average white child academically
later studies found that age of adoption really matters & children who receive poor nutrition or impoverished social interactions early in life struggle to recover later on
(VIDEO 5.58) Limitations of studies
studied very small groups of children making it unclear how reliable the results were
compared adopted children to kids who remained institutionalized (hardly a typical childhood)
(VIDEO 5.58) Updated studies on IA
massive database of 62 adoption studies (over 17,000 children)
found that adopted children outperformed siblings or peers who were not adopted (both in IQ & academic achievement)
presumably because kids who are adopted move from less stable, less economically prosperous households to the kind of wealth stable educated homes that tend to adopted children
(VIDEO 5.58) What does adoption age let us know?
differences in academic performance disappeared if the children were adopted before the age of 12 months
suggesting that very early experiences likely contribute to the educational achievement gap in the US
(VIDEO 5.59) Laurence Summers & view on women
addressed why women are so much less likely than men to be tenured professors of Math, Science & engineering at elite schools
first → women are less attracted by high-powered jobs, in part because of their preference to focus on family
second →women are less likely than men to be exceptionally gifted in ways that favor careers in the sciences
third →socialization & discrimination
(VIDEO 5.59) SAT Scores & Gender differences
study of 12th grade SAT scores, which found that boys were more, or likely to have both extremely high & extremely low scores compared to girls
(VIDEO 5.59) Are there overall differences between boys & girls in Math & Science?
4th grade - boys in the U.S. outperform girls on standardized tests of Math & Science (like the T.I.M.S.S.
8th grade - there was no significant difference between groups
TIMSS results also showed that boys perform substantially worse than girls in many countries
in most liberal democracies show no differences at all, those with the biggest female advantages include some of the most repressed spaces for women (math)
in reading there’s a bigger advantage from the start & girls dominate internationally
(VIDEO 5.59) Are boys more likely to be exceptionally gifted than girls?
nearly impossible to tell since other factors, like discrimination, could play a role & very hard to measure
its been found repeatedly that in high school → girls get better grades than boys
data from the NCES → suggest that culture likely plays a large role in who studies Math at high level
(VIDEO 5.60) Do people really learn with their preferred learning styles?
a review article proposed to begin by asking people what their learning style is
then creating different training conditions based on their preference
randomly assign learner to these different conditions so that some people are in a condition that matches their preferred style and others in mismatch styles
(VIDEO 5.60) Learning styles conclusion
studies have found opposing results
science is simply not strong enough to support the idea that learning styles exist and affect learning
also not strong enough to tell us that the idea is false
right now evidence suggests that we should use whichever method works best overall, rather than tailoring techniques to the preferences of individual students
(VIDEO 5.61) UCLA Study
researchers found that only about one in five college students had ever been taught about effective study habits & actually used those techniques
the remaining 80% were either never taught to study or don’t use the methods that they were taught
(VIDEO 5.61) Bjork Lab at UCLA
desirable difficulties
the idea is that our experience of difficulty when trying to learn something does not give us very good information about whether we’ll actually remember it in the future
we’re bad at predicting how well we’ll remember things after a delay
(VIDEO 5.61) Difference between recognition memory & recall memory
very easy to recognize text we’ve already fact or a detail in a movie we’ve already seen but often incredibly difficult to spontaneously describe these same details when asked to
(VIDEO 5.61) Pros of recall memory
technique is better because it’s similar to real tests, but also because recalling memories actually makes them stronger, even if recall something incorrectly and then are corrected
(VIDEO 5.61) limited amount of study time
you’re far better off breaking that study time into chunks and leaving time between each session than just continuously studying
many studies have shown that the long you wait before restudying something, the better you remember it later on
(VIDEO 5.61) Colorado State University (2005 Study)
taught subjects the names of people in a set off photographs
each learner studied some faces by retrieval practice where they were given a photo & had to type in a name
the other face is by restudy, where they simply looked at the face & the name & tried to remember them
learners saw each face, name pair three times, but some learners had these repetitions, while other subjects saw three new faces before the first set was repeated
when they were retested five minutes later, learners remembered retrieved faces far better than restudied faces & remembered spaced-out faces far better than faces that were presented repeatedly all in one chunk
(VIDEO 5.61) Cramming
science tells us that both spaced repetition & retrieval practice really shine when there’s some delay between when the information is studied & when it’s tested
(TUTORIAL SPACING) Spacing effect
adding breaks in between repeatedly studying the same or similar information ends up improving your long-term recall for that same information
as long as forgetting is followed by relearning it does seem to be beneficial
the longer you wait, the greater the boost to retention that you’ll get, generally speaking
(TUTORIAL SPACING) the point of taking the test is to recall information
a useful principle seems to be that you should wait until you’ve almost, not quite forgotten what you’ve learned
the extra effort that you’ll have to put in to restudy when the material’s not so familiar appears to be helpful for long-term memory
spread out your study as much as you can & give yourself a chance to refresh on the material right before you need to take the test