Chapter 2
1/7
There's no tags or description
Looks like no tags are added yet.
Name | Mastery | Learn | Test | Matching | Spaced |
|---|
No study sessions yet.
8 Terms
The lesson of __________ is to forget about the money that's irretrievably gone and instead to focus on the marginal costs and benefits of future options.
Sunk costs
Opportunity costs
Marginal analysis
Budget constraints
Sunk Costs
The slope of the _________________ is determined by the relative price of the two goods, which is calculated by taking the price of one good and dividing it by the price of the other good.
Opportunity cost
Productive efficiency
Budget constraint
Production possibilities frontier
Budget constraint
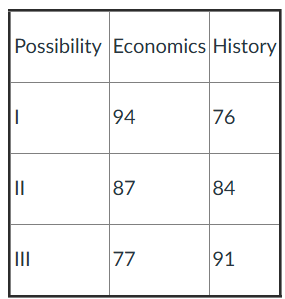
Referring to Table 2-1: A student has only a few hours to prepare for two different exams this afternoon. The above table shows alternative possible exam scores with three alternative uses of the student's time. The opportunity cost of scoring a 94 on the economics exam rather than a 77 is:
8 points on the history exam.
15 points on the history exam.
14 points on the history exam.
17 points on the history exam.
15 points on the history exam
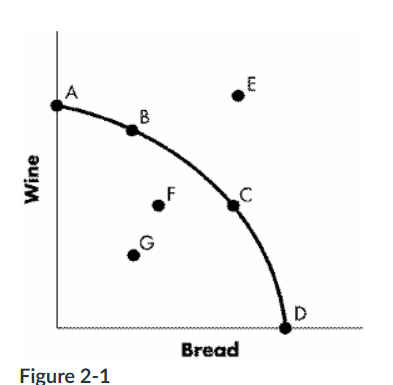
Refer to Figure 2-1. An economy is operating at full employment, and then workers in the bread industry are laid off. This change is portrayed in the movement from:
A to B
B to E
C to F
G to F
C to F
As depicted in _______________, it is necessary to give up some of one good to gain more of the other good.
The production possibilities frontier
Allocative efficiency
Scarcity
Utility
The production possibilities frontier
Most real-world choices aren't about getting all of one thing or another, instead, most choices involve _________________, which involves comparing the benefits and costs of choosing a little more or a little less of a good.
Utility
Opportunity cost
Benefit analysis
Marginal analysis
Marginal analysis
Which of the following would most likely shift the production possibilities curve inward?
An increase in the number of hours factories are in use
A decrease in the average number of hours worked per week as the labor force chooses to enjoy more leisure time
An increase in the production of capital goods
Technological progress
A decrease in the average number of hours worked per week as the labor force chooses to enjoy more leisure time
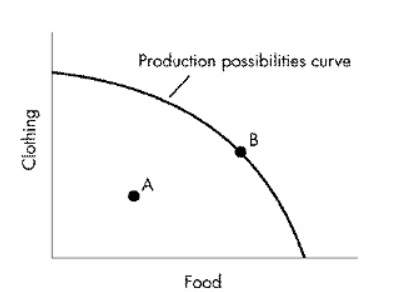
Refer to Figure 2-2. At Point A in the production possibilities graph shown above, the economy:
Is not using its resources efficiently.
Is using its resources efficiently while producing clothing but no food.
Is using its resources efficiently while producing food but no clothing.
Is using its resources efficiently to produce both food and clothing.
Is not using its resources efficiently.