L07 - Support Vector Machine for Diagnosis
1/15
There's no tags or description
Looks like no tags are added yet.
Name | Mastery | Learn | Test | Matching | Spaced |
|---|
No study sessions yet.
16 Terms
Maintenance
Combination of all technical, administrative and managerial actions during the life cycle of an item intended to retain it in, or restore it to, a state in which it can perform the required function
Maintenance: All actions (technical, administrative, managerial) to keep an item working or restore it so it can work.
Inspection
Examination for conformity by measuring, observing, or testing the relevant characteristics of an item.
Inspection: Checking an item’s characteristics by measuring, observing, or testing.
Service
Measures to delay the reduction of the existing wear-out reserve
Actions to slow down the wear and tear of an item.
Line Maintenance
Regular, routine maintenance tasks that are performed on an aircraft while it is in service. It is designed to keep the aircraft in good working condition and ensure its safety and reliability.
Line Maintenance: Routine tasks done while the aircraft is in service (e.g., pre-flight check, small repairs).
Base Maintenance:
More extensive maintenance type and involves tasks such as major repairs, overhauls, and modifications to the aircraft. Unlike line maintenance, base maintenance is typically performed on a scheduled basis.
Base Maintenance: Larger tasks like overhauls and major repairs, usually on a schedule.
Diagnosis
A judgment about what a particular illness or problem is, made after examining it.
Making a judgment about a problem after examination.
Involves steps from raw data to assessing the health of a system/component.
OSA-CBM (Open System Architecture for Condition-Based Maintenance)
Data Acquisition – Collect raw data
Data Manipulation – Process data
State Detection – Identify condition
Health Assessment – Evaluate health
Prognostics Assessment – Predict remaining life (RUL)
Advisory Generation – Maintenance recommendations
Presentation – Show results
Key idea: Without diagnosis, you can’t make accurate prognosis.
Support Vector Machines
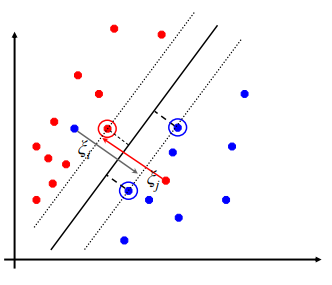
Linear classification: Which Hyperplane?
SVM finds the optimal line by maximizing the distance from the closest points (support vectors).
Many possible separating lines exist for classification.
Some methods find a line, but not the best one.
If no points are near the line, decisions are more certain.
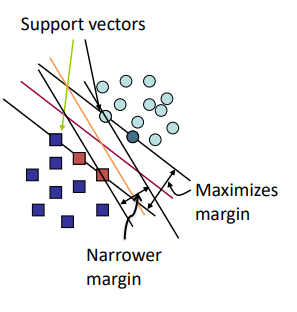
Support Vector Machines
Maximising the margin
SVM chooses the line with the largest margin (gap between classes).
Only the support vectors (closest points) matter for determining the line.
Solving SVM is a quadratic programming problem.
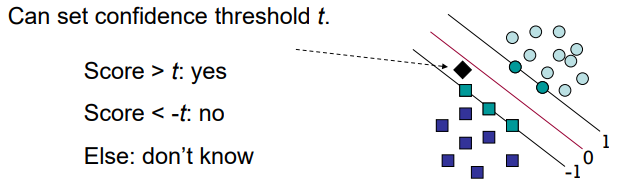
Classification with SVMs for a given a new point x
For a new point xxx, calculate score = wTx+bw^T x + bwTx+b
If score > 0 → one class, score < 0 → other class.
Can set threshold ttt for confidence:
score > t → yes
score < -t → no
otherwise → don’t know
Linear SVMs: Summary
SVM classifier is a separating hyperplane.
Only the support vectors (closest training points) define it.
Solved with quadratic optimization and Lagrange multipliers.
In the dual form, the model uses only inner products between points.
Soft Margin Classification
If data is not perfectly separable, allow errors with slack variables ξi.
Some points can be misclassified for flexibility.
Minimize both margin violation and training errors.
C parameter controls trade-off between margin size and errors.
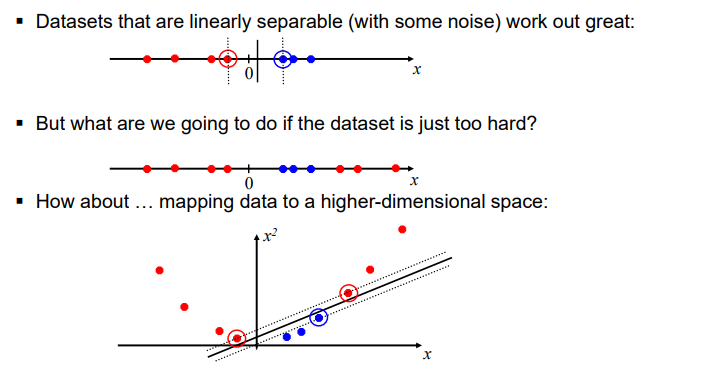
Non-linear SVMs
Works well for linearly separable data (even with some noise).
If separation is too hard, map data to a higher-dimensional space.
This may make it linearly separable in the new space.
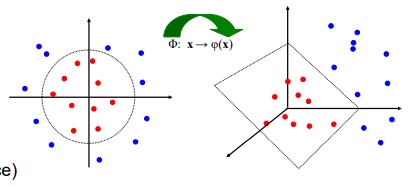
The Kernel Trick
Map data into higher dimensions without explicitly computing coordinates.
Use a kernel function K(xi,xj) to calculate inner products in the new space.
Common kernels:
Linear
Polynomial
RBF (Radial Basis Function) – infinite-dimensional space
γ parameter controls how far a single data point’s influence reaches.
Safety vs. False Alarms
Positive = Faulty, Negative = Healthy.
Safety goal: No real fault should be missed → False Negatives (FN) = 0.
Reduce false alarms: Avoid alarms for healthy machines → False Positives (FP) = 0.
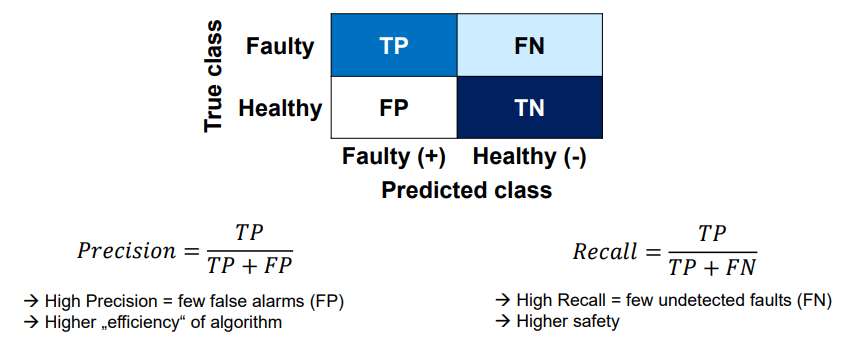
Safety vs. False Alarms translation into evaluation metrics
True Positive (TP): The model says faulty and it’s actually faulty → correct alarm.
False Positive (FP): The model says faulty but it’s actually healthy → false alarm.
True Negative (TN): The model says healthy and it’s actually healthy → correct no alarm.
False Negative (FN): The model says healthy but it’s actually faulty → missed fault.
Precision = TP / (TP + FP)
Of all the alarms given, how many were actually correct?
Recall = TP / (TP + FN)
Of all the real faults, how many did we detect?