MI580 Lecture 6 - Causality, Bias, and Confounding
1/52
There's no tags or description
Looks like no tags are added yet.
Name | Mastery | Learn | Test | Matching | Spaced | Call with Kai |
|---|
No analytics yet
Send a link to your students to track their progress
53 Terms
Types of Associations (4)
Necessary and Sufficient
Necessary, but not sufficient
Sufficient, but not necessary
Nether sufficient nor necessary
Necessary Cause
Must be present for the outcome to occur, but do not guarantee that the outcome will occur.
Sufficient
A set of minimal conditions and events that inevitably produce disease. Once these conditions are there, you will get disease.
Sources of Error (3)
Chance
Bias
Confounding
Precision
All data points are consistent.
Accurate
All data points are reflective of the true parameter.
Internal Validity
Results of an observation are correct for the particular groups being studied, implies valid statistical association
External Validity
Some valid associations exist only within particular subgroups, but externally valid results have similar results across diverse populations
Random error
Chance variation in the sample (analogous to precision problem on individual measurements)
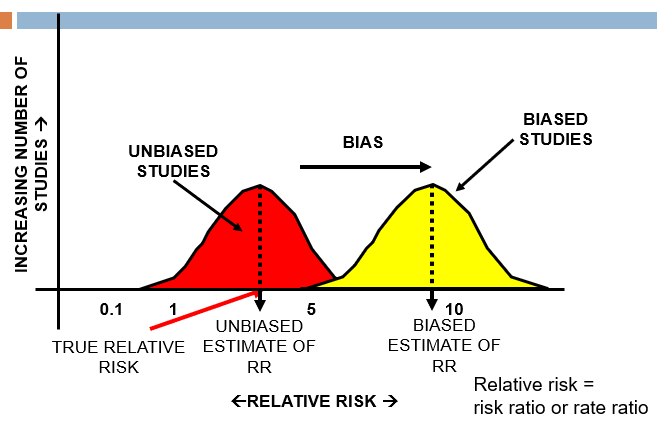
Bias
A systemic error in the collection or interpretation of data, results may not be valid or accurate. Results in an erroneous association.
Cannot be correct with statistical manipulation and increases with sample size.
Study Level Error
An inaccurate estimate of the correct value for the measure under study, correct value is unknown and all we can ever really know is the value of the estimate
Major Limitation of Observational Studies
Not randomized, so the control and experiment groups are not balanced
Observational Studies Not Inherently Balanced With Respect To (3)
Probability of exposure (e.g., drug or vaccine)
Likelihood of detection of outcome
Many other factors (i.e., important covariates and risk factors) that can influence why a person gets exposed and also be associated with the outcome of interest
Chance
Random error, lack of power, arbitrary nature of statistical significance threshold (e.g., p-value of < 0.05)
Confounding
A factor related to both the exposure and the outcome that may distort the observed association between the two.
Major Types of Bias in Observation Studies (2)
Selection Bias
Information Bias/Misclassification
Selection bias
Systematic error due to differences between those selected and those not selected for study/study group participation
Information bias/Misclassification
A flaw in measuring exposure or outcome that results in inaccuracy of information and misclassification
Can be non-differential or differential between the groups.
Nonresponse Selection Bias
Those who do not respond may be/are different than those who do
Volunteer Selection Bias
Select volunteers as exposed group and non-volunteers as non-exposed group in a study of screening effectiveness
Healthy Worker Selection Bias
Study health of workers in a workplace exposed to some occupational exposures comparing to health of general population
Publicity bias/Notoriety bias
Increased awareness through medical publication or media communication may increase physician’s likelihood of reporting a case or recording a diagnosis
How To Minimize Selection Bias in Case Control, Cohort, and Clinical Trials (3)
Define criteria of selection of diseased and non-diseased participants independent of exposures in a case-control study
Define criteria of selection of exposed and non-exposed participants independent of disease outcomes in a cohort study
Use randomized clinical trials
Information Bias
The means for getting information about the subjects is inadequate and results in some information about exposure and/or disease outcome being wrong
To be biased, the information must be more likely to be wrong in one group than another
Major Types of Information Bias (3)
Misclassification of outcome
Misclassification of exposure
Misclassification of any other variables in the analysis
Examples of Information Bias (3)
Interviewer Bias (Questioning Bias)
Recall Bias
Reporting Bias - selective suppression or revealing of information
“Wish” Bias
Subjects who develop a disease and seek to show that the disease is not their fault
Denial Bias
Subjects deny that their disease is due to known exposure (like in STD cases)
How to Decrease Information Bias (6)
Memory aids (e.g. calendar)
Validate responses
Blind interviewers and abstractors
Provide strict protocols and standardized training sessions
Standardize data collections forms
Carefully word questions and pre-test for understanding
Identify a Confounding Variable (3)
X is associated with Disease B
X is associated with Exposure A
X is not in the causal pathway between Exposure A and Disease B
Age is a confounder if … (2)
Age is a risk factor for the disease AND
Age is associated with (but not caused by) exposure
Why to Control for Confounding (3)
To obtain a more accurate estimate of the true association between the exposure and the disease
To understand how a third variable could potentially impact the association between the exposure and the disease
Important to understand for public health intervention
Confounding vs. Bias
Unlike bias, confounding does not involve error in the way measurements are collected or the way patients are selected, but in the interpretation of what may be an accurate measurement
Positive Confounding
The confounder produces an estimate that is more extreme (either harmful or protective) than the true association, overestimate
Negative Confounding
The confounder produces an estimate that is less extreme than the true association, underestimate
How to Control Confounding Through Design (3)
Randomization
Restriction
Matching
How to Control Confounding Through Analysis (2)
Stratification
Multivariate Analyses
Randomization
Patients randomly assigned treatment or placebo (or control intervention), a technique used in interventional studies (e.g. clinical trials) and not observational studies
Randomization Advantages (2)
Balances drug and control groups on known and unknown confounders
The larger the sample size, the better the randomization
Randomization Disadvantages (3)
Can be unethical or impractical
Patients aren’t always willing to be randomized
Patients may not adhere to the treatment to which they were randomized
Restriction
Study participation limited to individuals who fall within a specified category, can be done for any study design
Restriction Advantages (2)
Straightforward and inexpensive
Avoid diluting risk for certain diseases
Restriction Disadvantages (2)
Narrow restriction range can limit recruitment and ability to generalize results
Broad restriction may result in residual confounding
Frequency Matching
Frequency of the confounding variable is similar between cases and controls
Individual Matching
Each member of the case group has the same value of the confounding variable as each member of the control group
Matching Advantage
Very powerful method to control for confounders
Matching Disadvantages (3)
Time consuming and expensive
Not feasible when controlling for large # of confounders
Cannot study the variable on which matching was performed
Stratification
Evaluation of exposure/disease association within “homogeneous” categories of the confounder, can be used with any study design
Stratification Advantage
Very powerful method to control confounders
Stratification Disadvantages (3)
Not feasible when controlling for large # of confounders
Depending on how the strata are defined, there may be residual confounding
May not be feasible if large number of strata are required
Multivariable Analyses
A statistical technique that adjusts for multiple variables simultaneously, can be used with any study design
Multivariable Analyses Advantage (2)
Can control for many confounders at the same time
Powerful method whether outcome is categorical or continuous
Multivariable Analyses Disadvantages (2)
Sample size has to be large to accommodate controlling for multiple confounders
Depending on the statistical technique, the data must satisfy certain assumptions