GIS Midterm 1
1/243
There's no tags or description
Looks like no tags are added yet.
Name | Mastery | Learn | Test | Matching | Spaced |
|---|
No study sessions yet.
244 Terms
Definition of GIS
a computer-based system to aid in the collection, maintenance, storage, analysis, output, and distribution of spatial information
What does a GIS allow us to do?
visualize combinations of spatial information
Data is
spatial
GIS recognizes
spatial aspects of data
GIS as a system
collect, store, process, analyze, visualize
GIS as a software
actual tools
GIS as a way of ‘doing’ or a science/way of knowing
concepts, principals, and methods
Three key characteristics
uses geographical data (spatial)
capable of conducting spatial analysis (synthesis)
computer based (not just maps)
hardware components
software components
data entry
editing
data management
analysis
output
GIS in organizations
all maps do what?
lie - they are made up of choices about what to have and not
what does it mean to ‘do’ GIS?
combines skill, knowlegde, and techinical capacity
what are the three ways of ‘doing’ GIS?
solve problems/answer questions
use compsci principles to design, build, and test tools
studying tools, methods, and theories (GIS science)
Notable use of spatial analysis before GIS
John Snow’s 1850’s cholera outbreak map of London
Early US stats mapping example
Slavery in the antebellum south
When did GIS emerge?
1960s
What were the early links to GIS?
Academy + military + civil gov
Early computing tech
SYMAP and Canada GIS
When was GIS made practical for users?
1980s
SYMAP
1965 Harvard
Allowed for the first time relatively cheap and easy automatic computer cartography
Canada GIS
1970 combined computer cartography with geographic database from Canada Land Survey
First true GIS
What was the first “true” GIS?
Canada GIS
What are the 4 perspectives of GIS?
Business
Government
Geography
Society
Business perspective
Develop software
For-profit data services
Consulting
Government perspective
Planning
Public reporting
Project management
Geography perspective
Cartography/location
Relevance
Ontological/epistemology concerns
Ontology
How must world be in order for us to understand it
Epistemology
What methods do we use to understand the world
Society perspective
Role of GIS
Privacy
Growth/spread of location-based services
Role of technological change
Intersections between GIS and other social theories
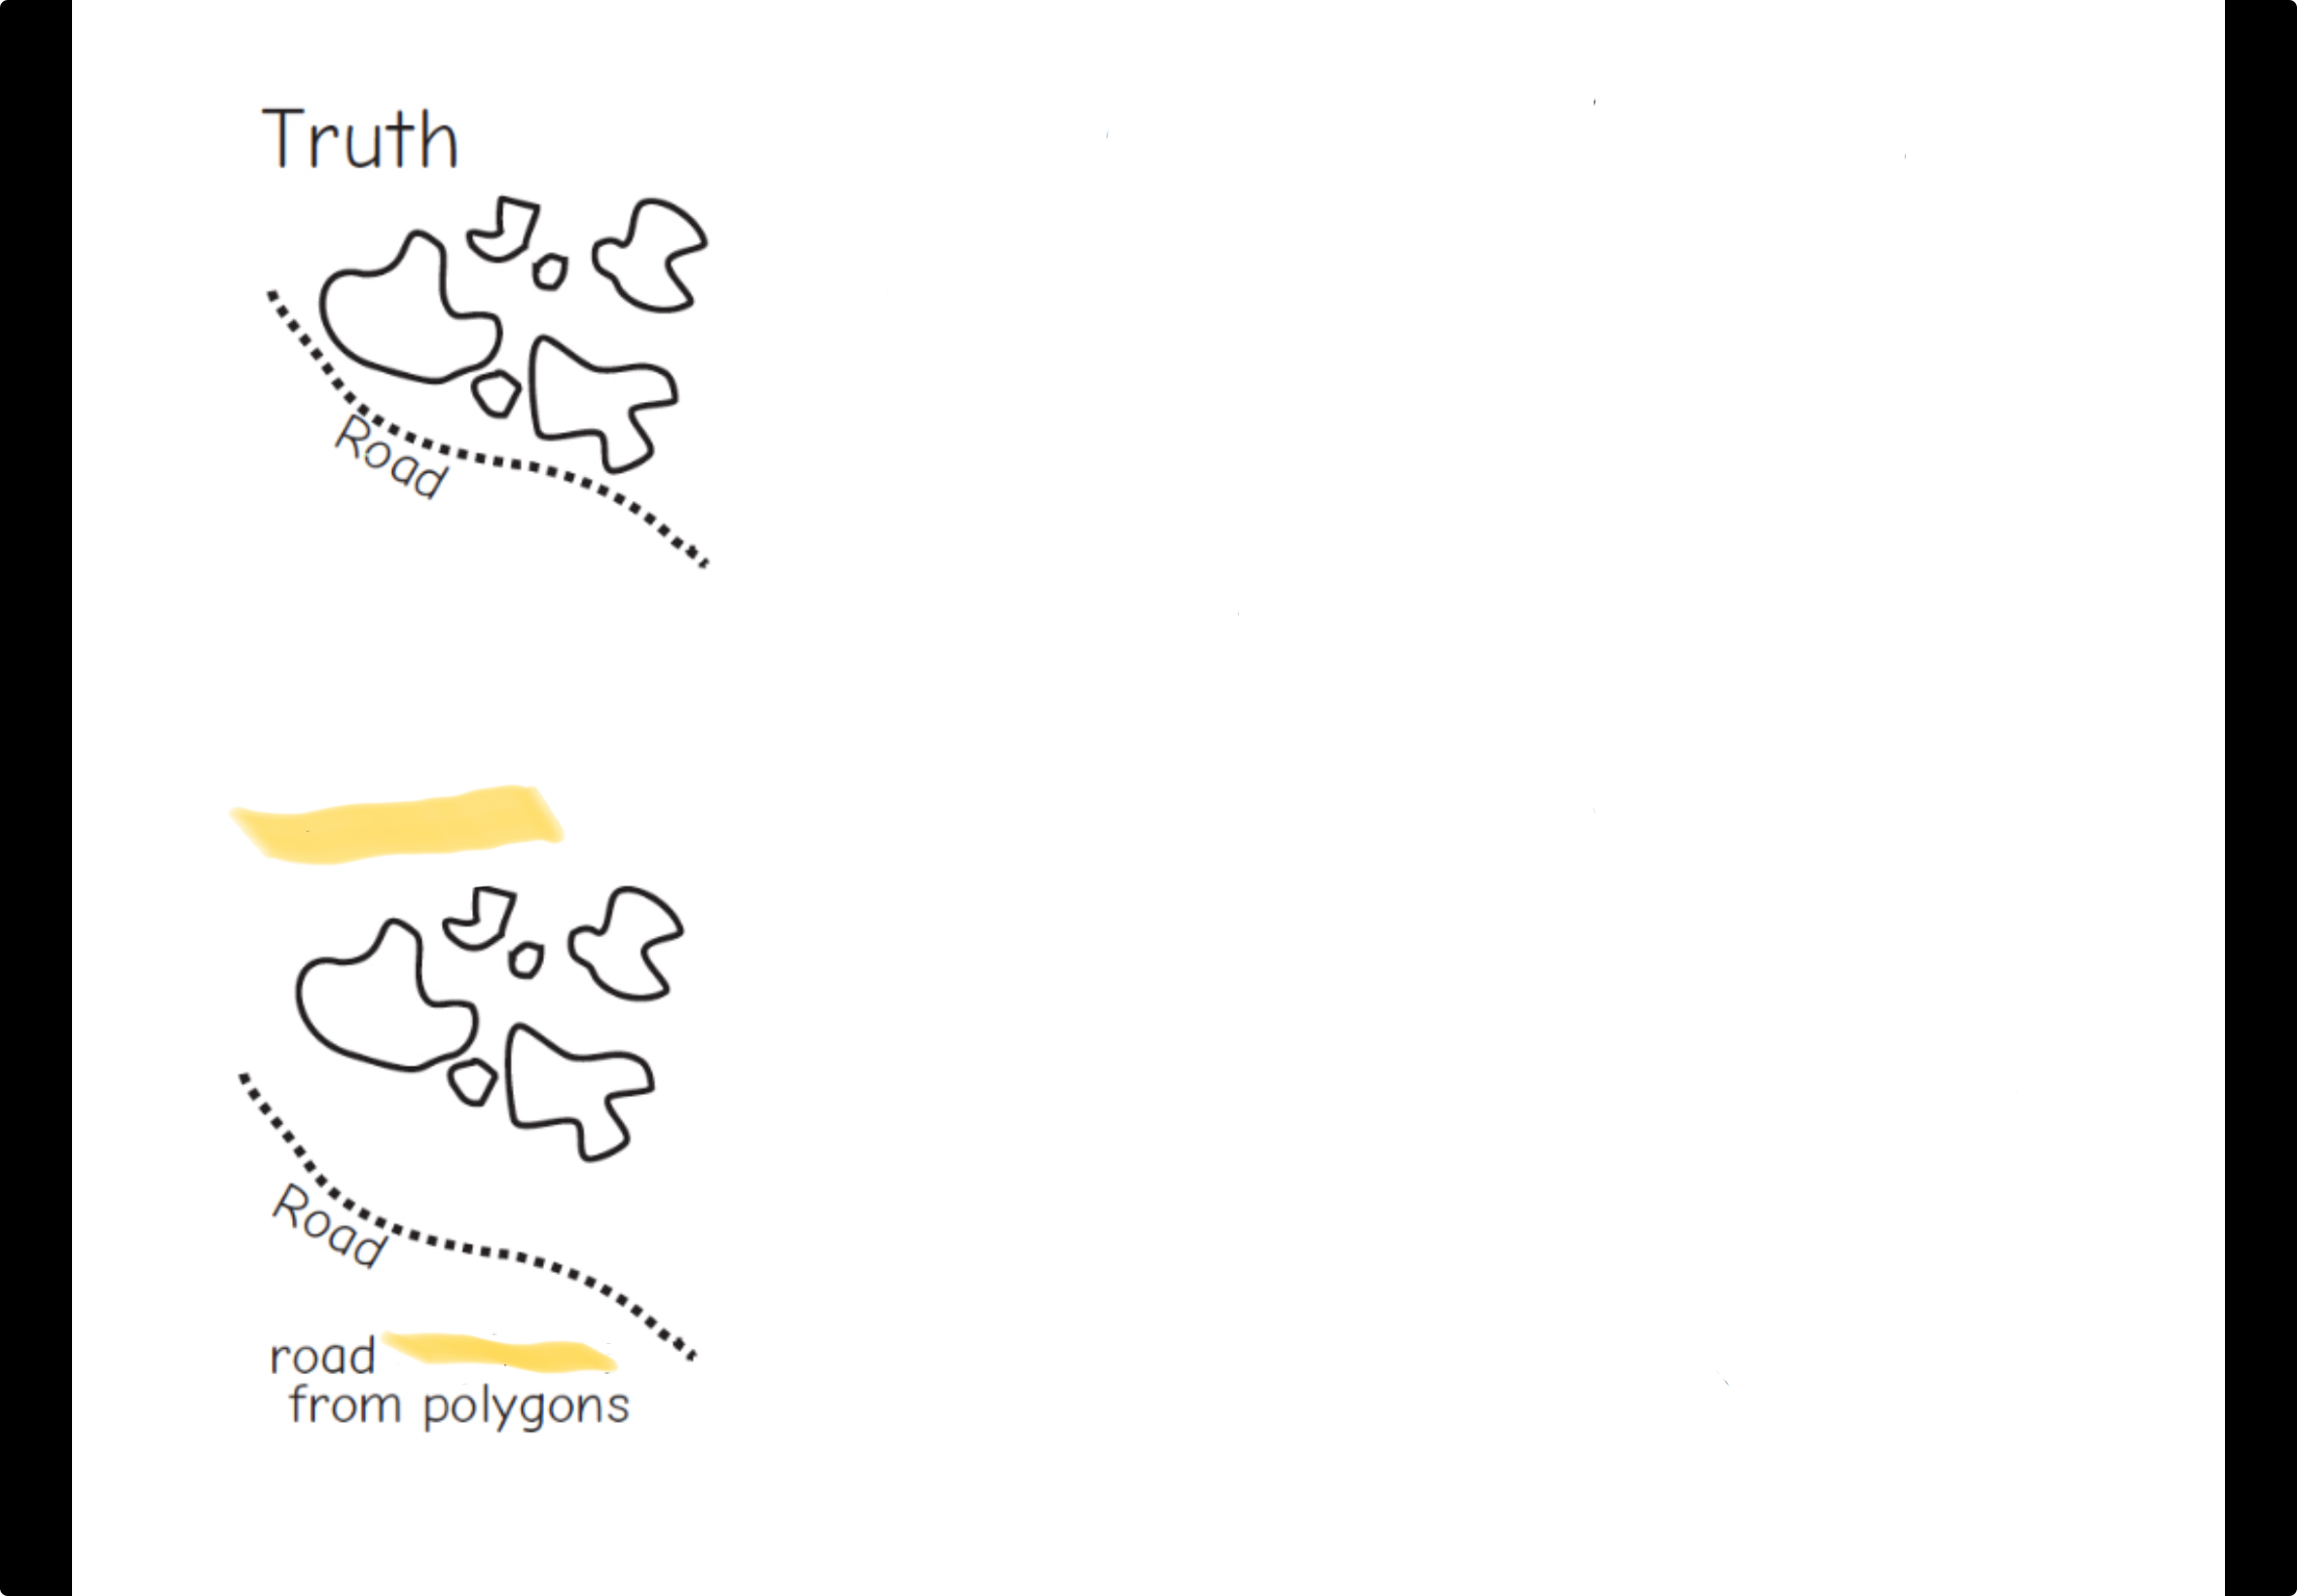
Maps are
Representations based on decisions that are scale dependent
Why maps?
Communicate complex info concisely
Key things to think about for maps
Intended audience
Information that needs to be communicated
Area of interest
Production limitations
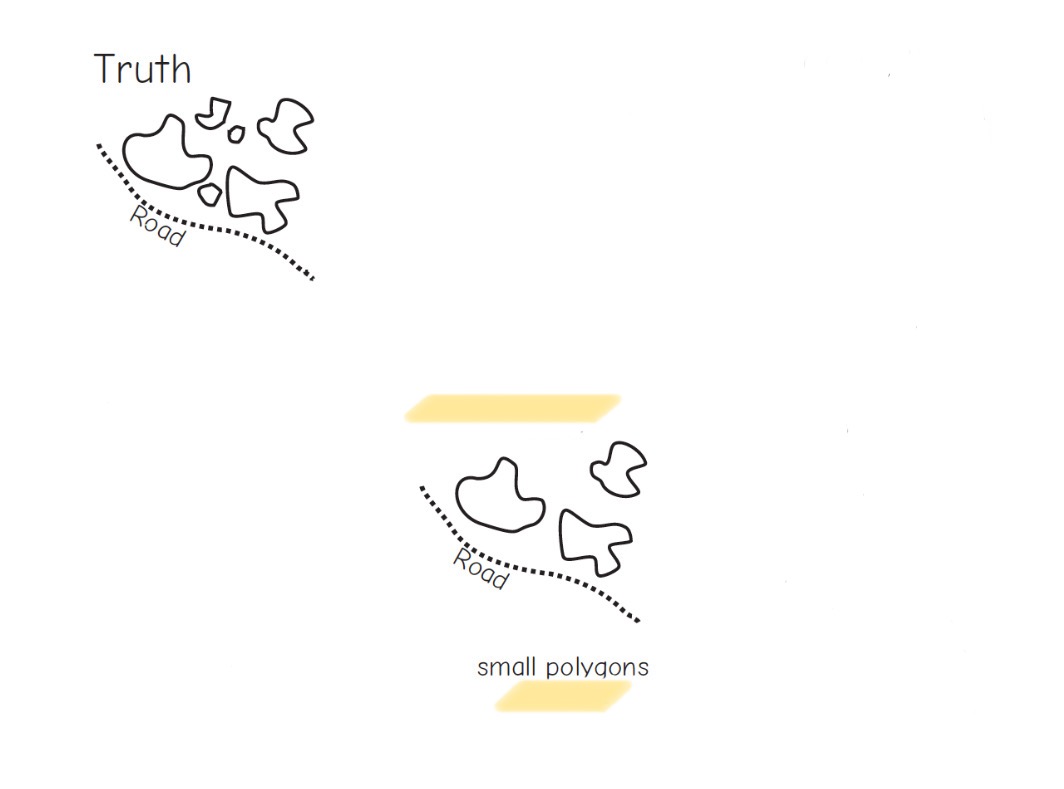
Three levels of scale
Level of detail
Extent/scope
Cartographic scale
Level of detail
Resolution
Amount of information found in data/displayed
Extent or scope
Size of the scale
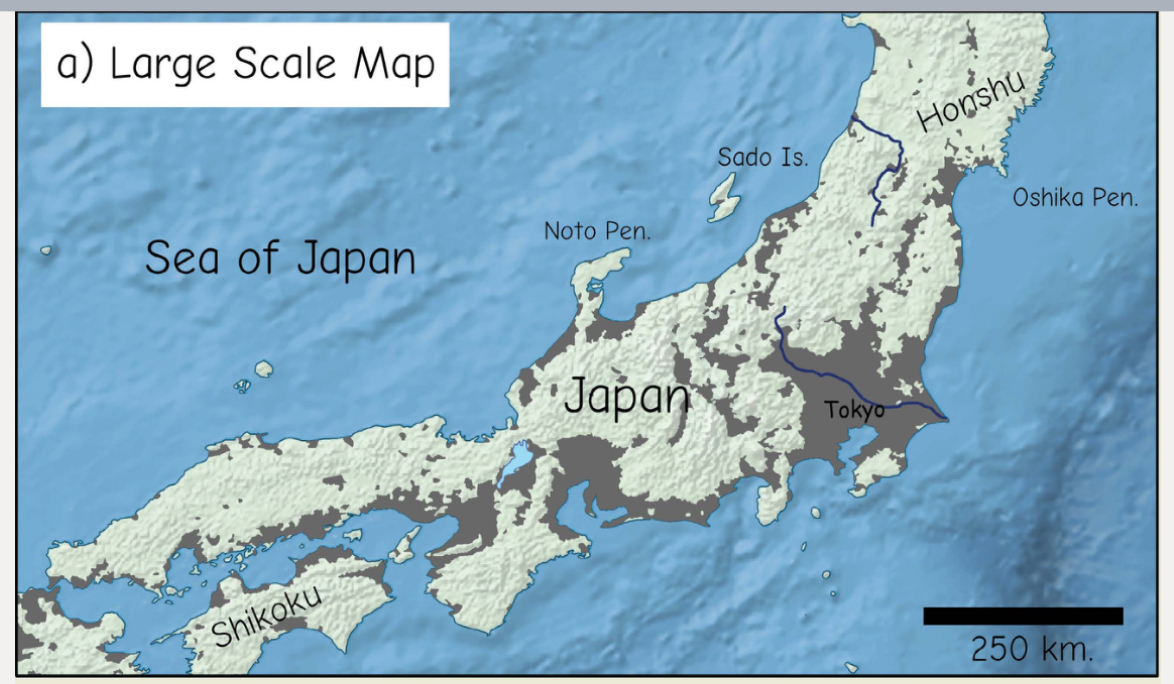
Large-scale
Large area covered
Large ratio
Lots of detail
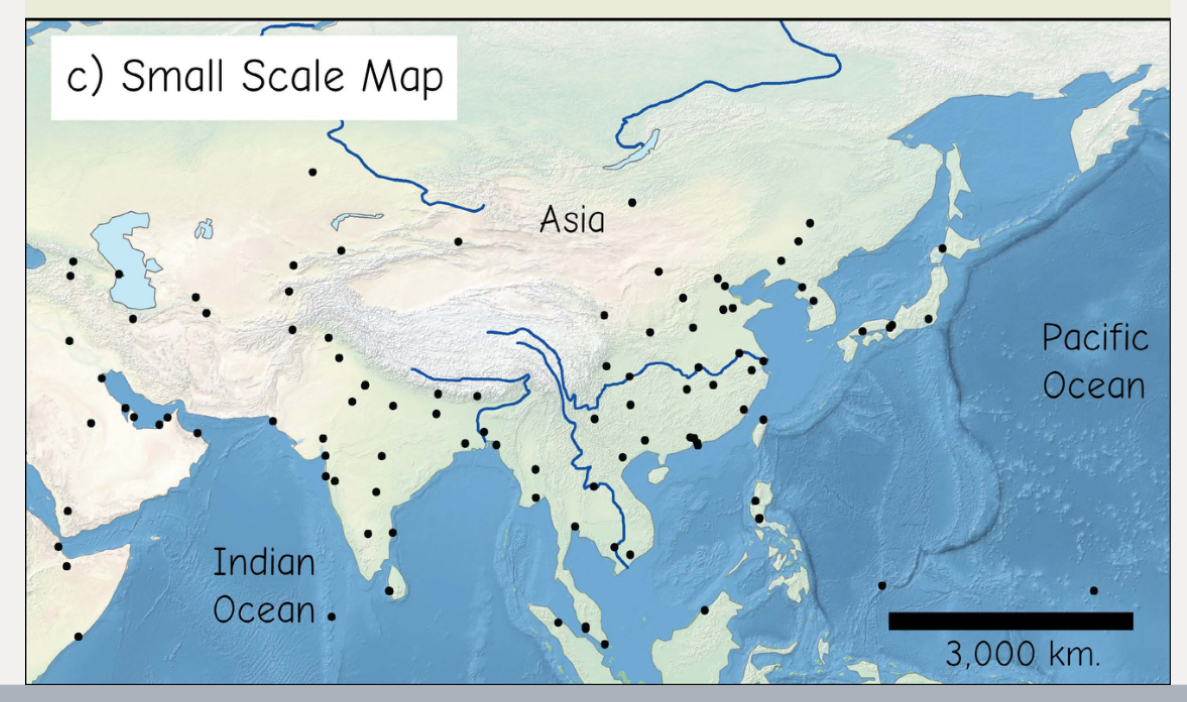
Small-scale
Small area covered
Small ratio
Very little detail
Cartographic scale
Map’s representative fraction or ratio
What are the 4 types of maps?
Reference or feature
Choropleth
Dot density
Isopleth
Reference or feature map
Shows basic information
Symbols may or may not be true to scale
Choropleth maps
Quantitative information displayed as shades or colors filling in an area
Dot density map
Quantitative information shown as dots per area
Isopleth map
Contours that connect points of equal value (ex topo)
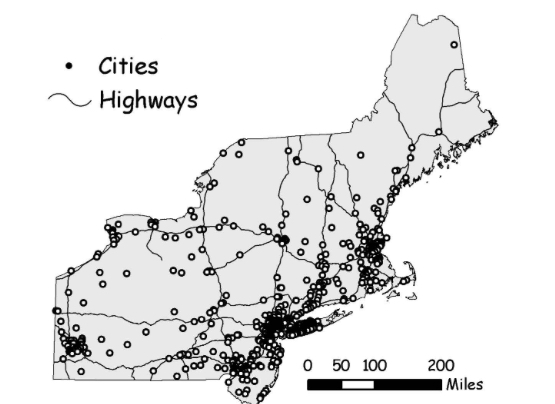
Reference/feature map
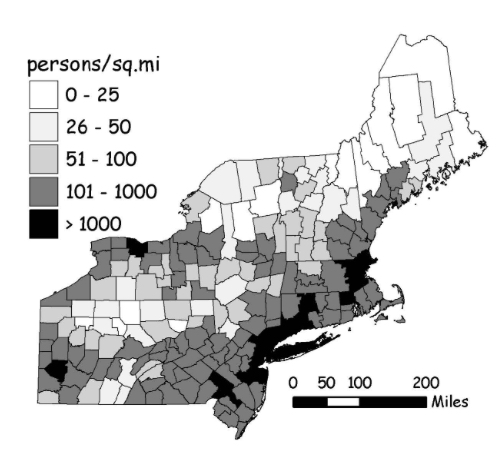
Choropleth map
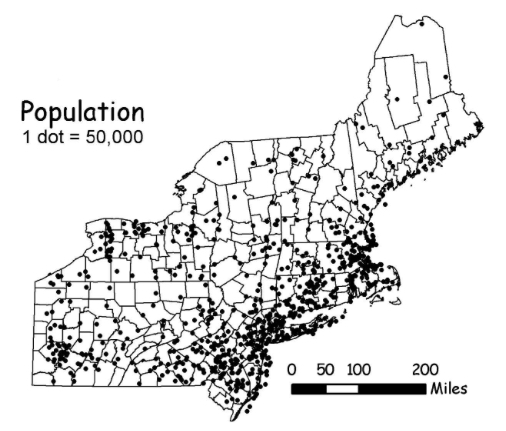
Dot density map
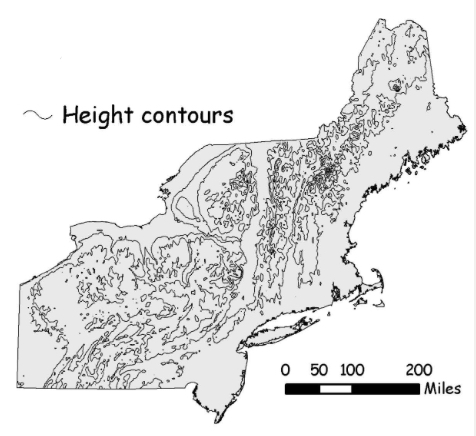
Isopleth map
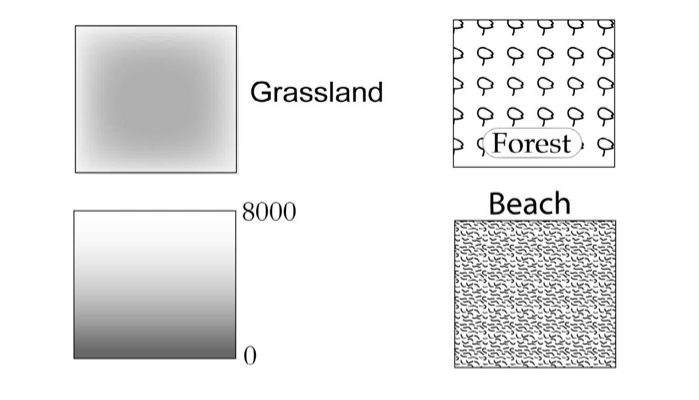
How should you decide symbols?
Map’s purpose and audience
Logical connections
Cultural relevance
Not detract or distract
What do points show
Discrete objects or locations
What do lines show
Linear objects or locations
What do area patterns show
Density or features that take up defined space
Elements of a map
Legends
North arrows
Scale bar or ratio
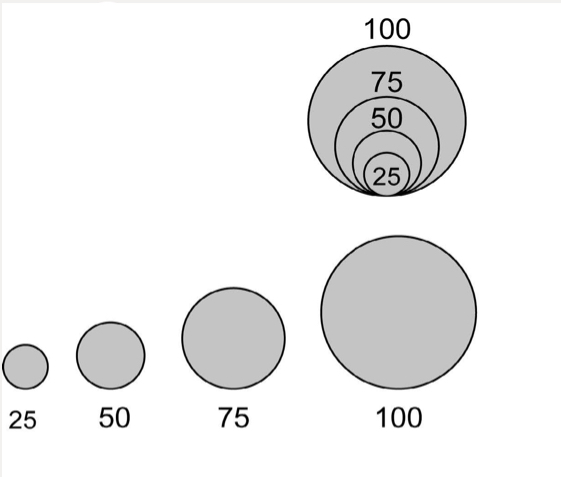
Graduated symbols legend
Area legend
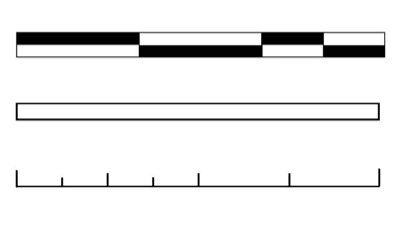
Scale bar
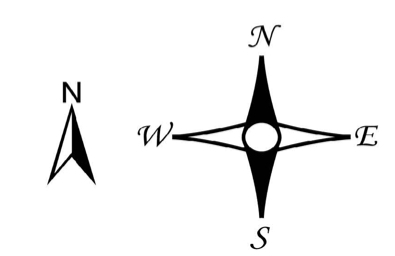
North arrows
Representation involves selecting
What we want to represent
Level of detail
How to represent
What are the 4 types of representation?
Space/time
Image
Visualizations
Maps (cartographic)
Space and time
Imagery
Visualizations
Map representation
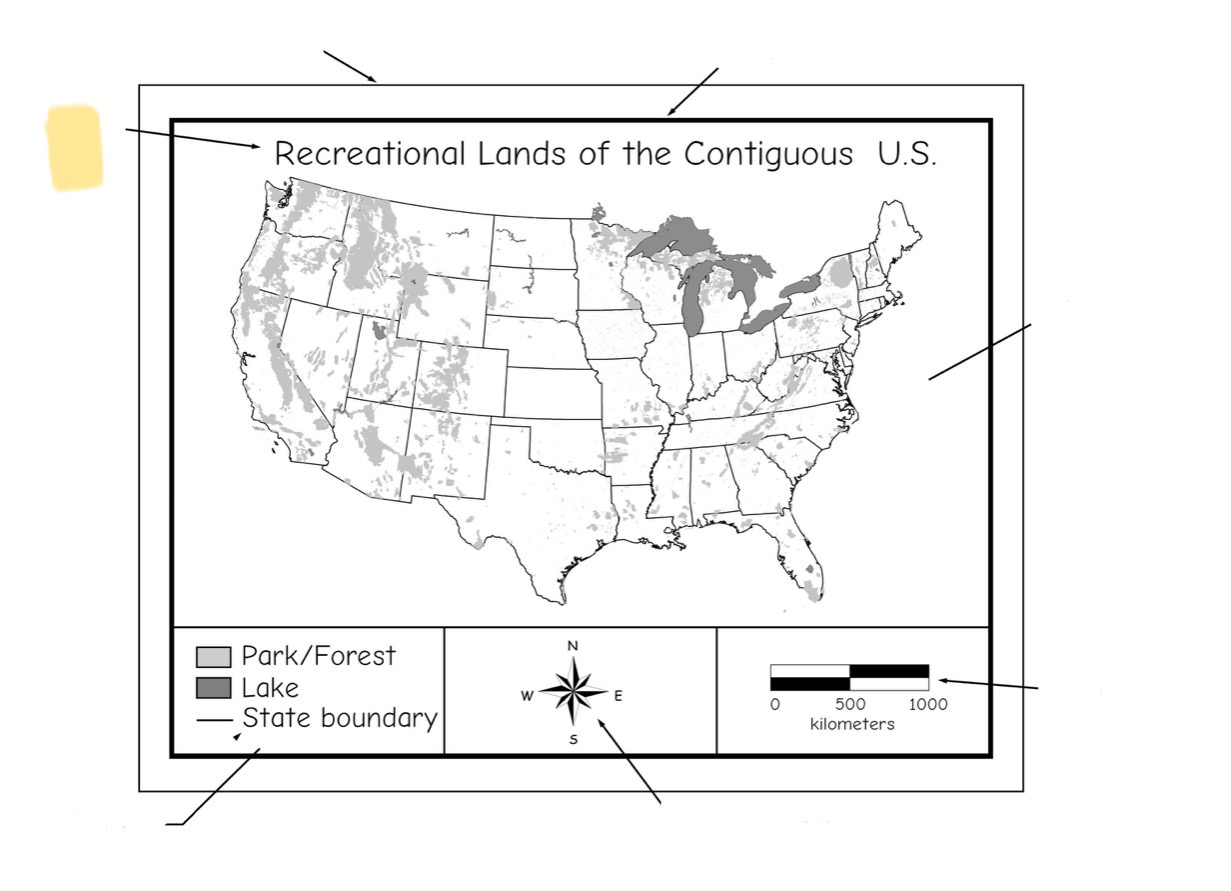
Title
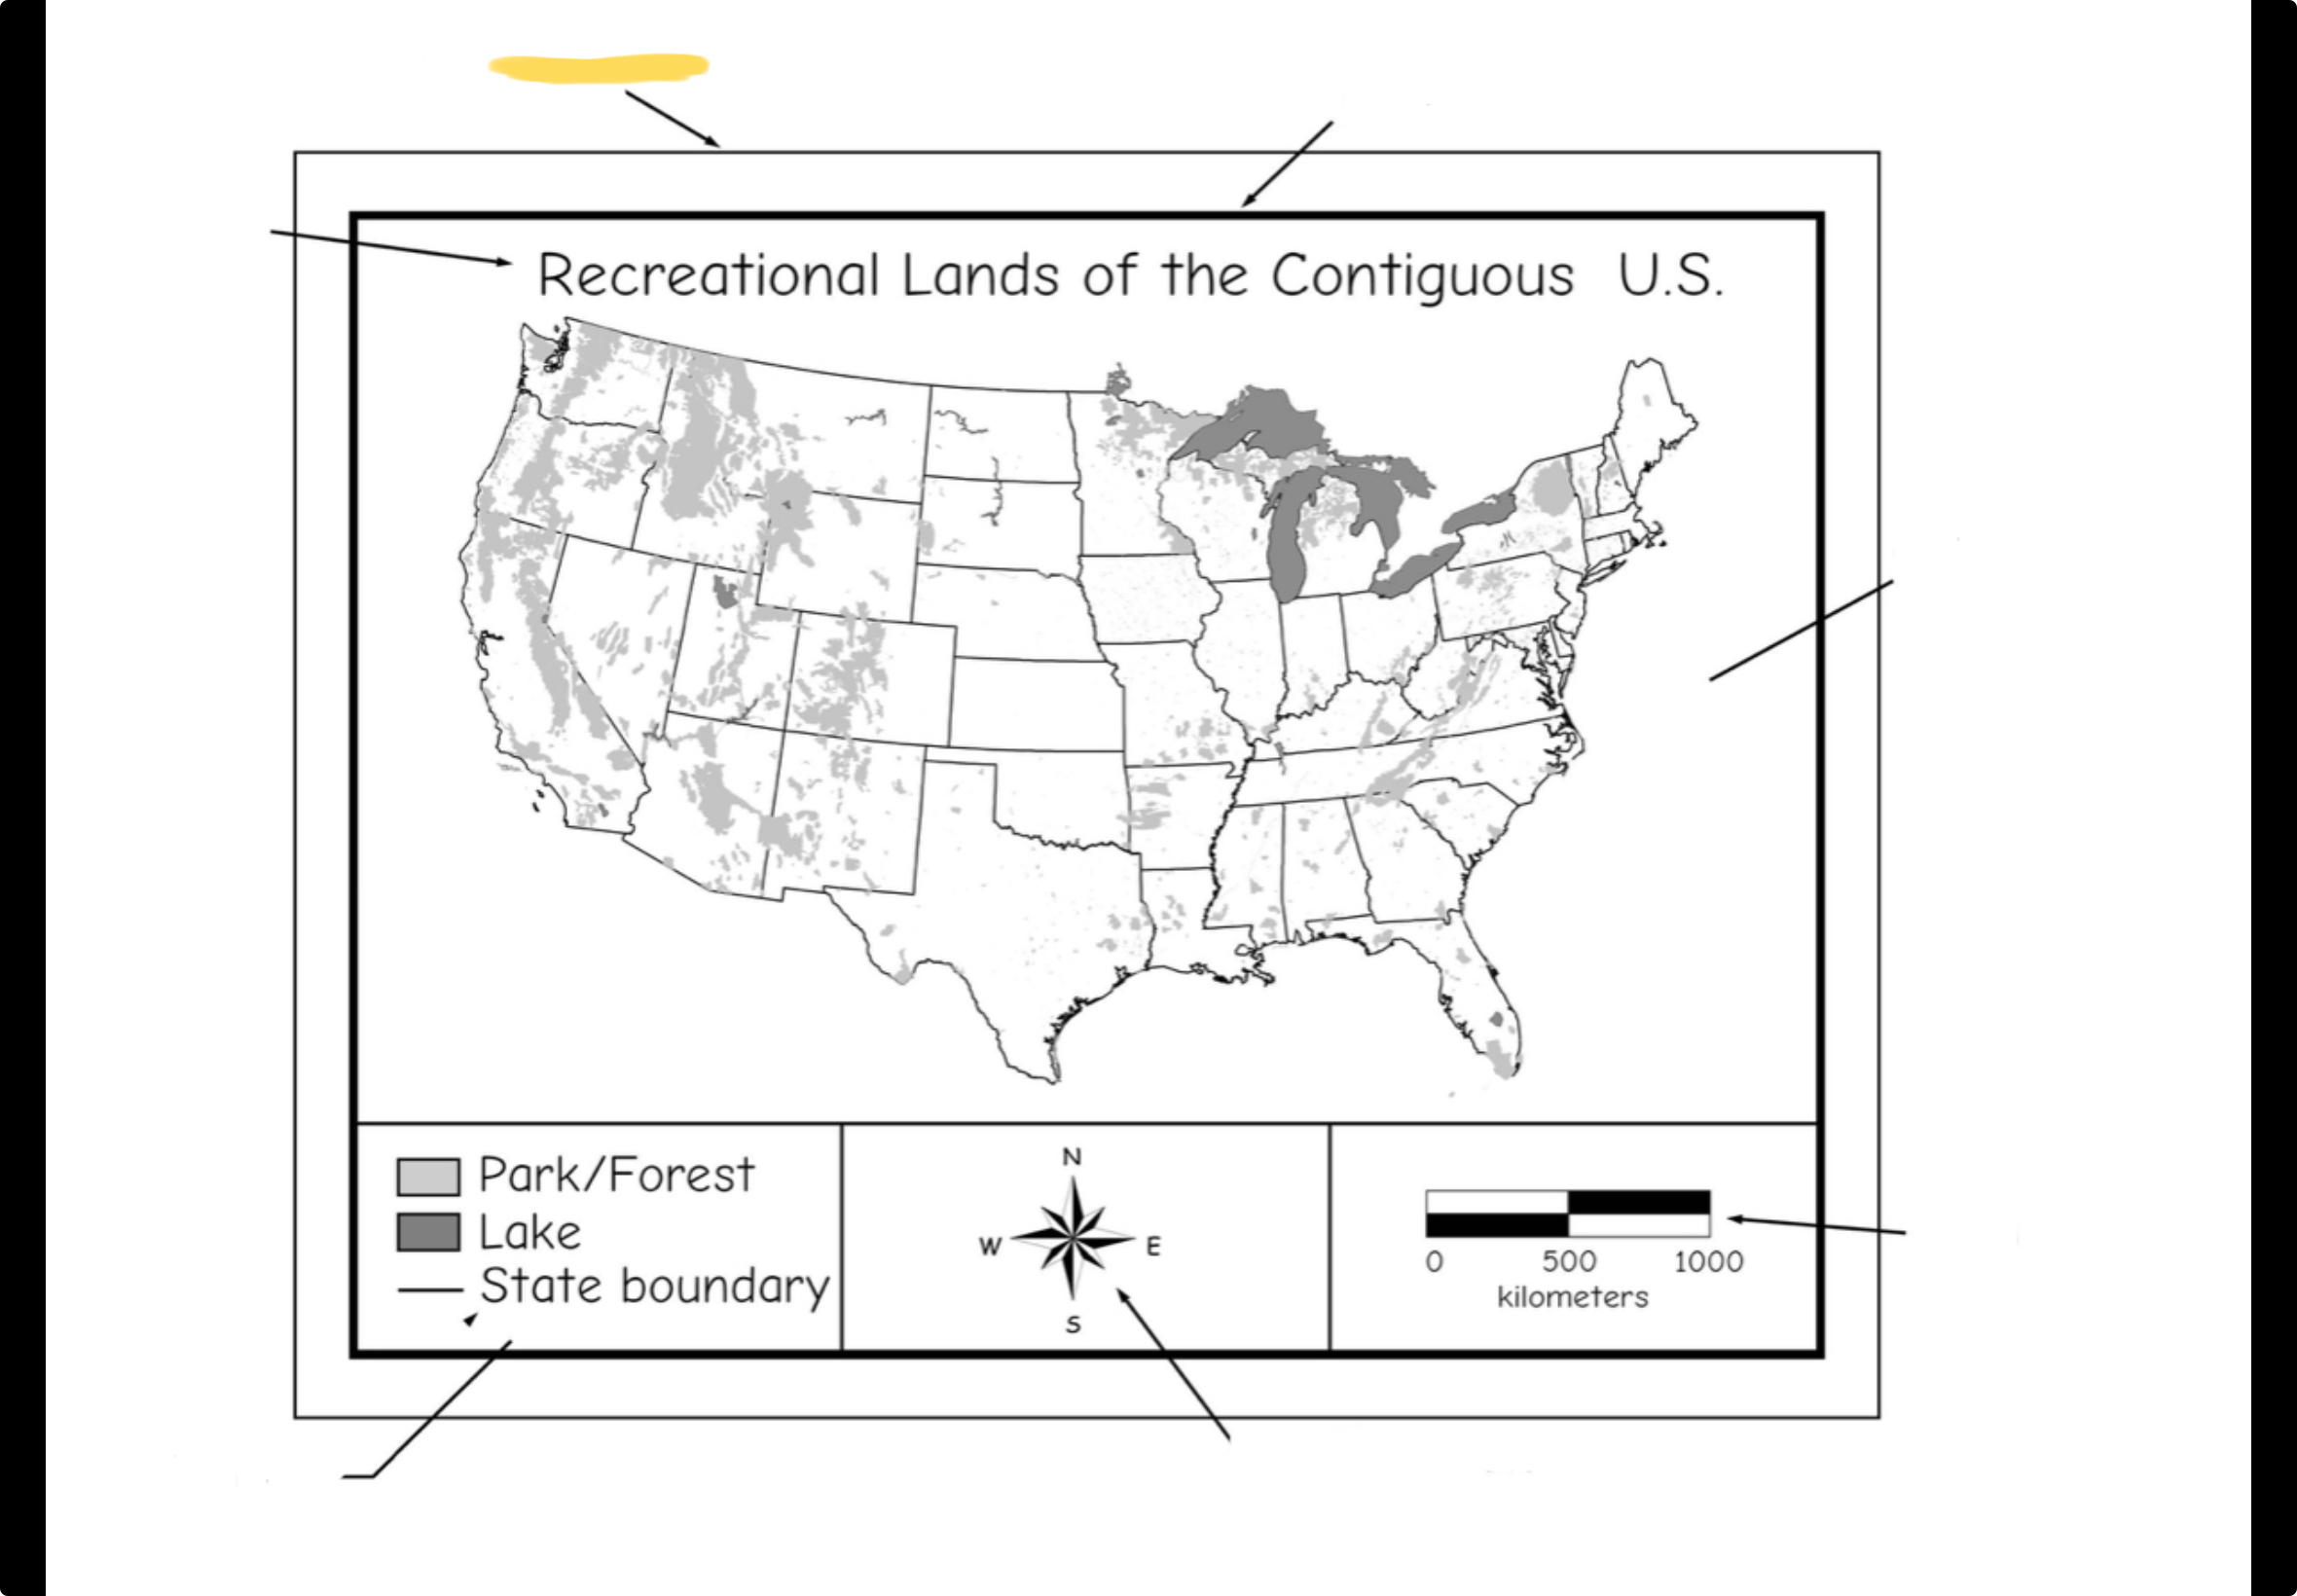
Media edge
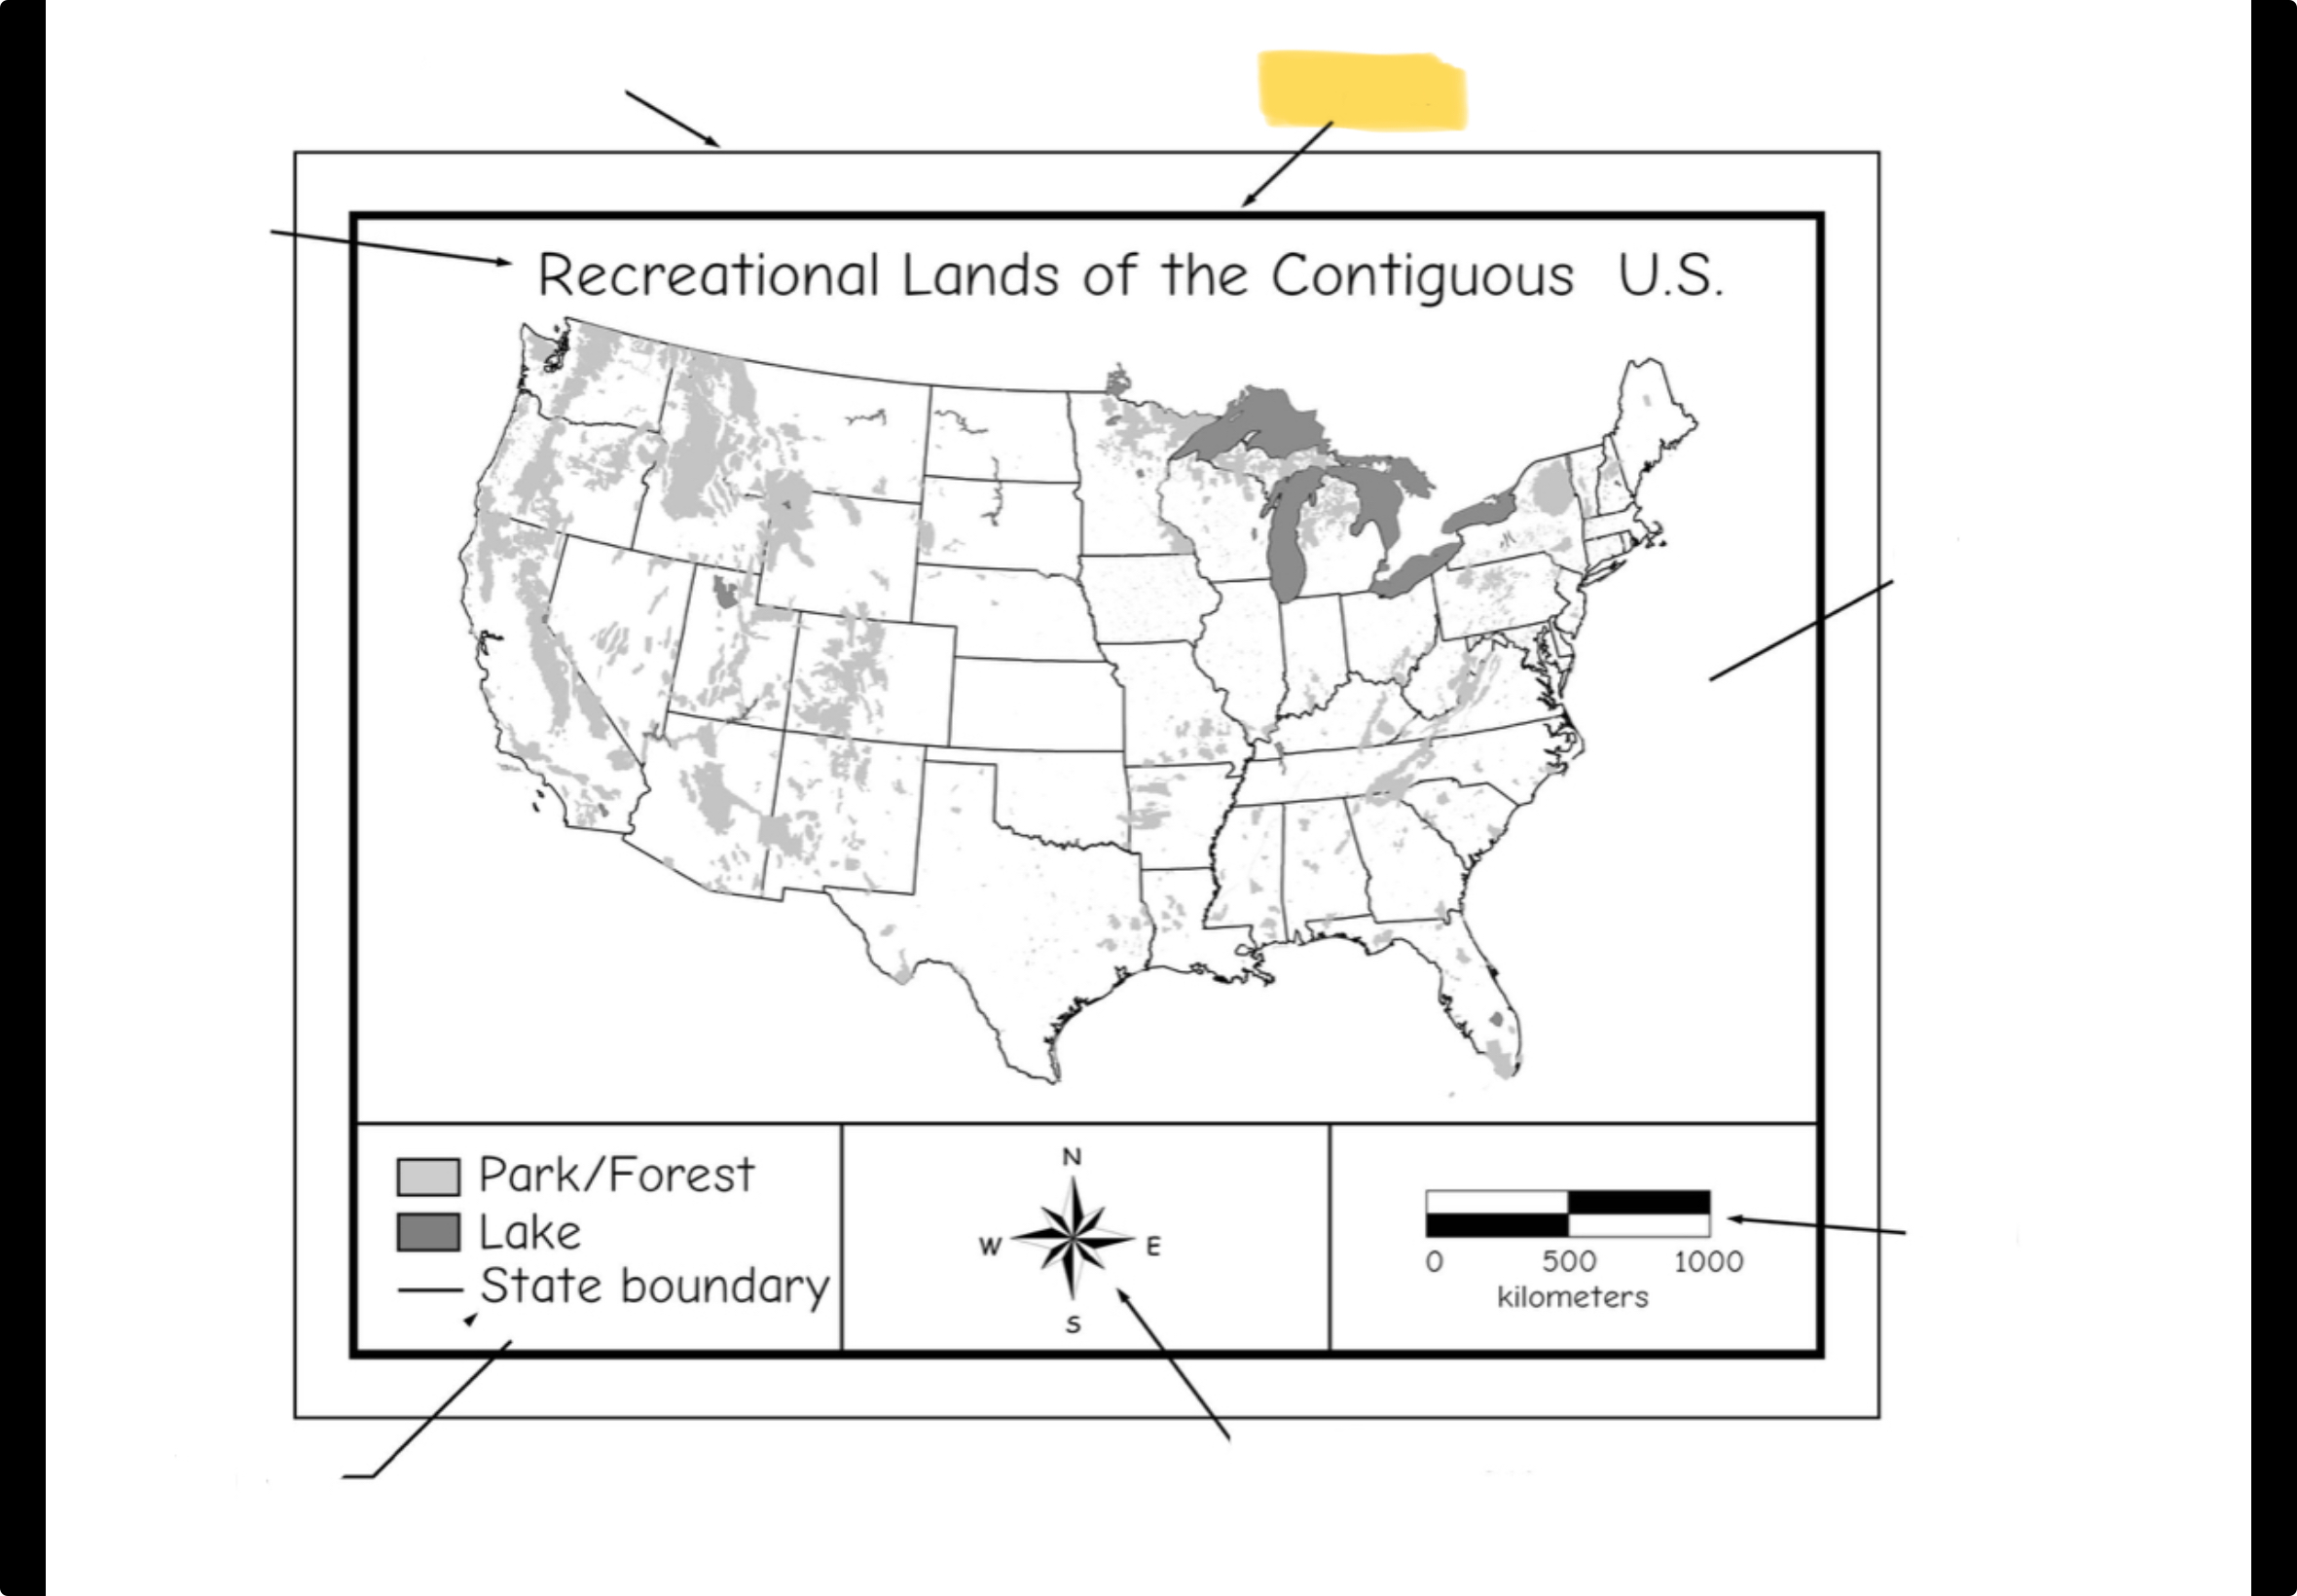
Neat line
Data pane
Legend
Scale bar
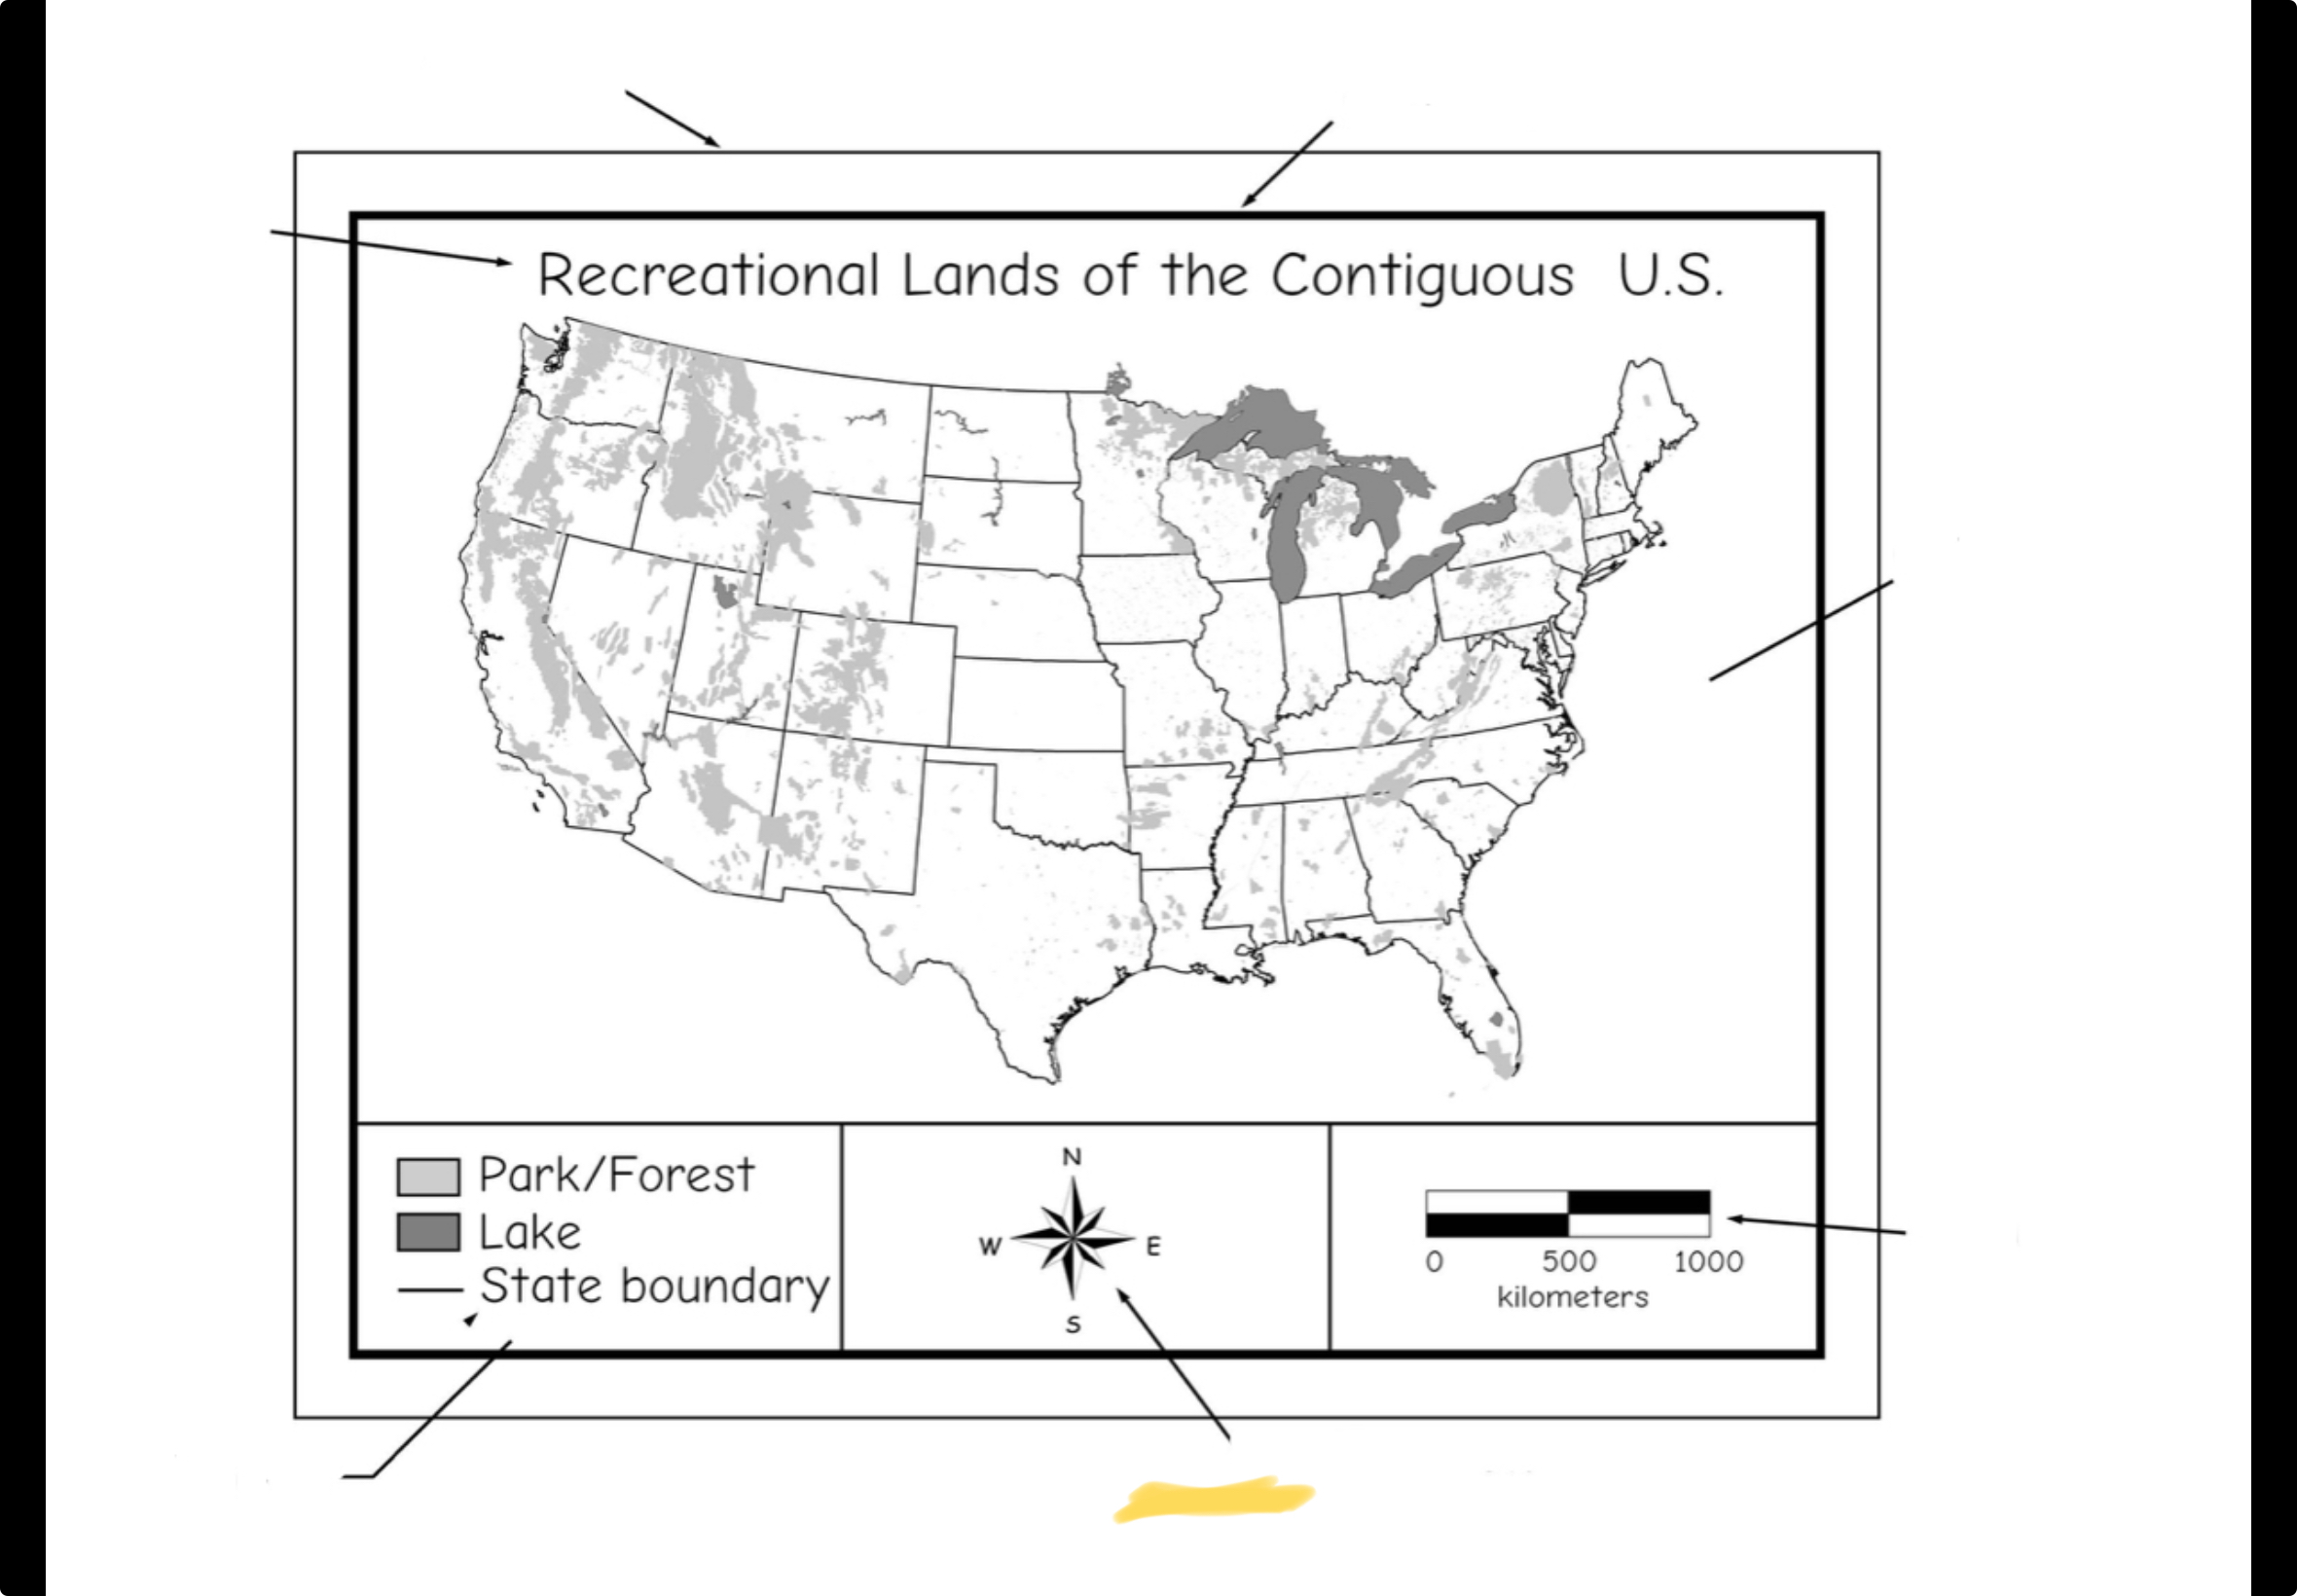
North arrow
Representation allows us to
Predict, model, and analyze
3 attributes of phenomena
Position
Attributes
Time
Position is represented
with symbols
Omitted
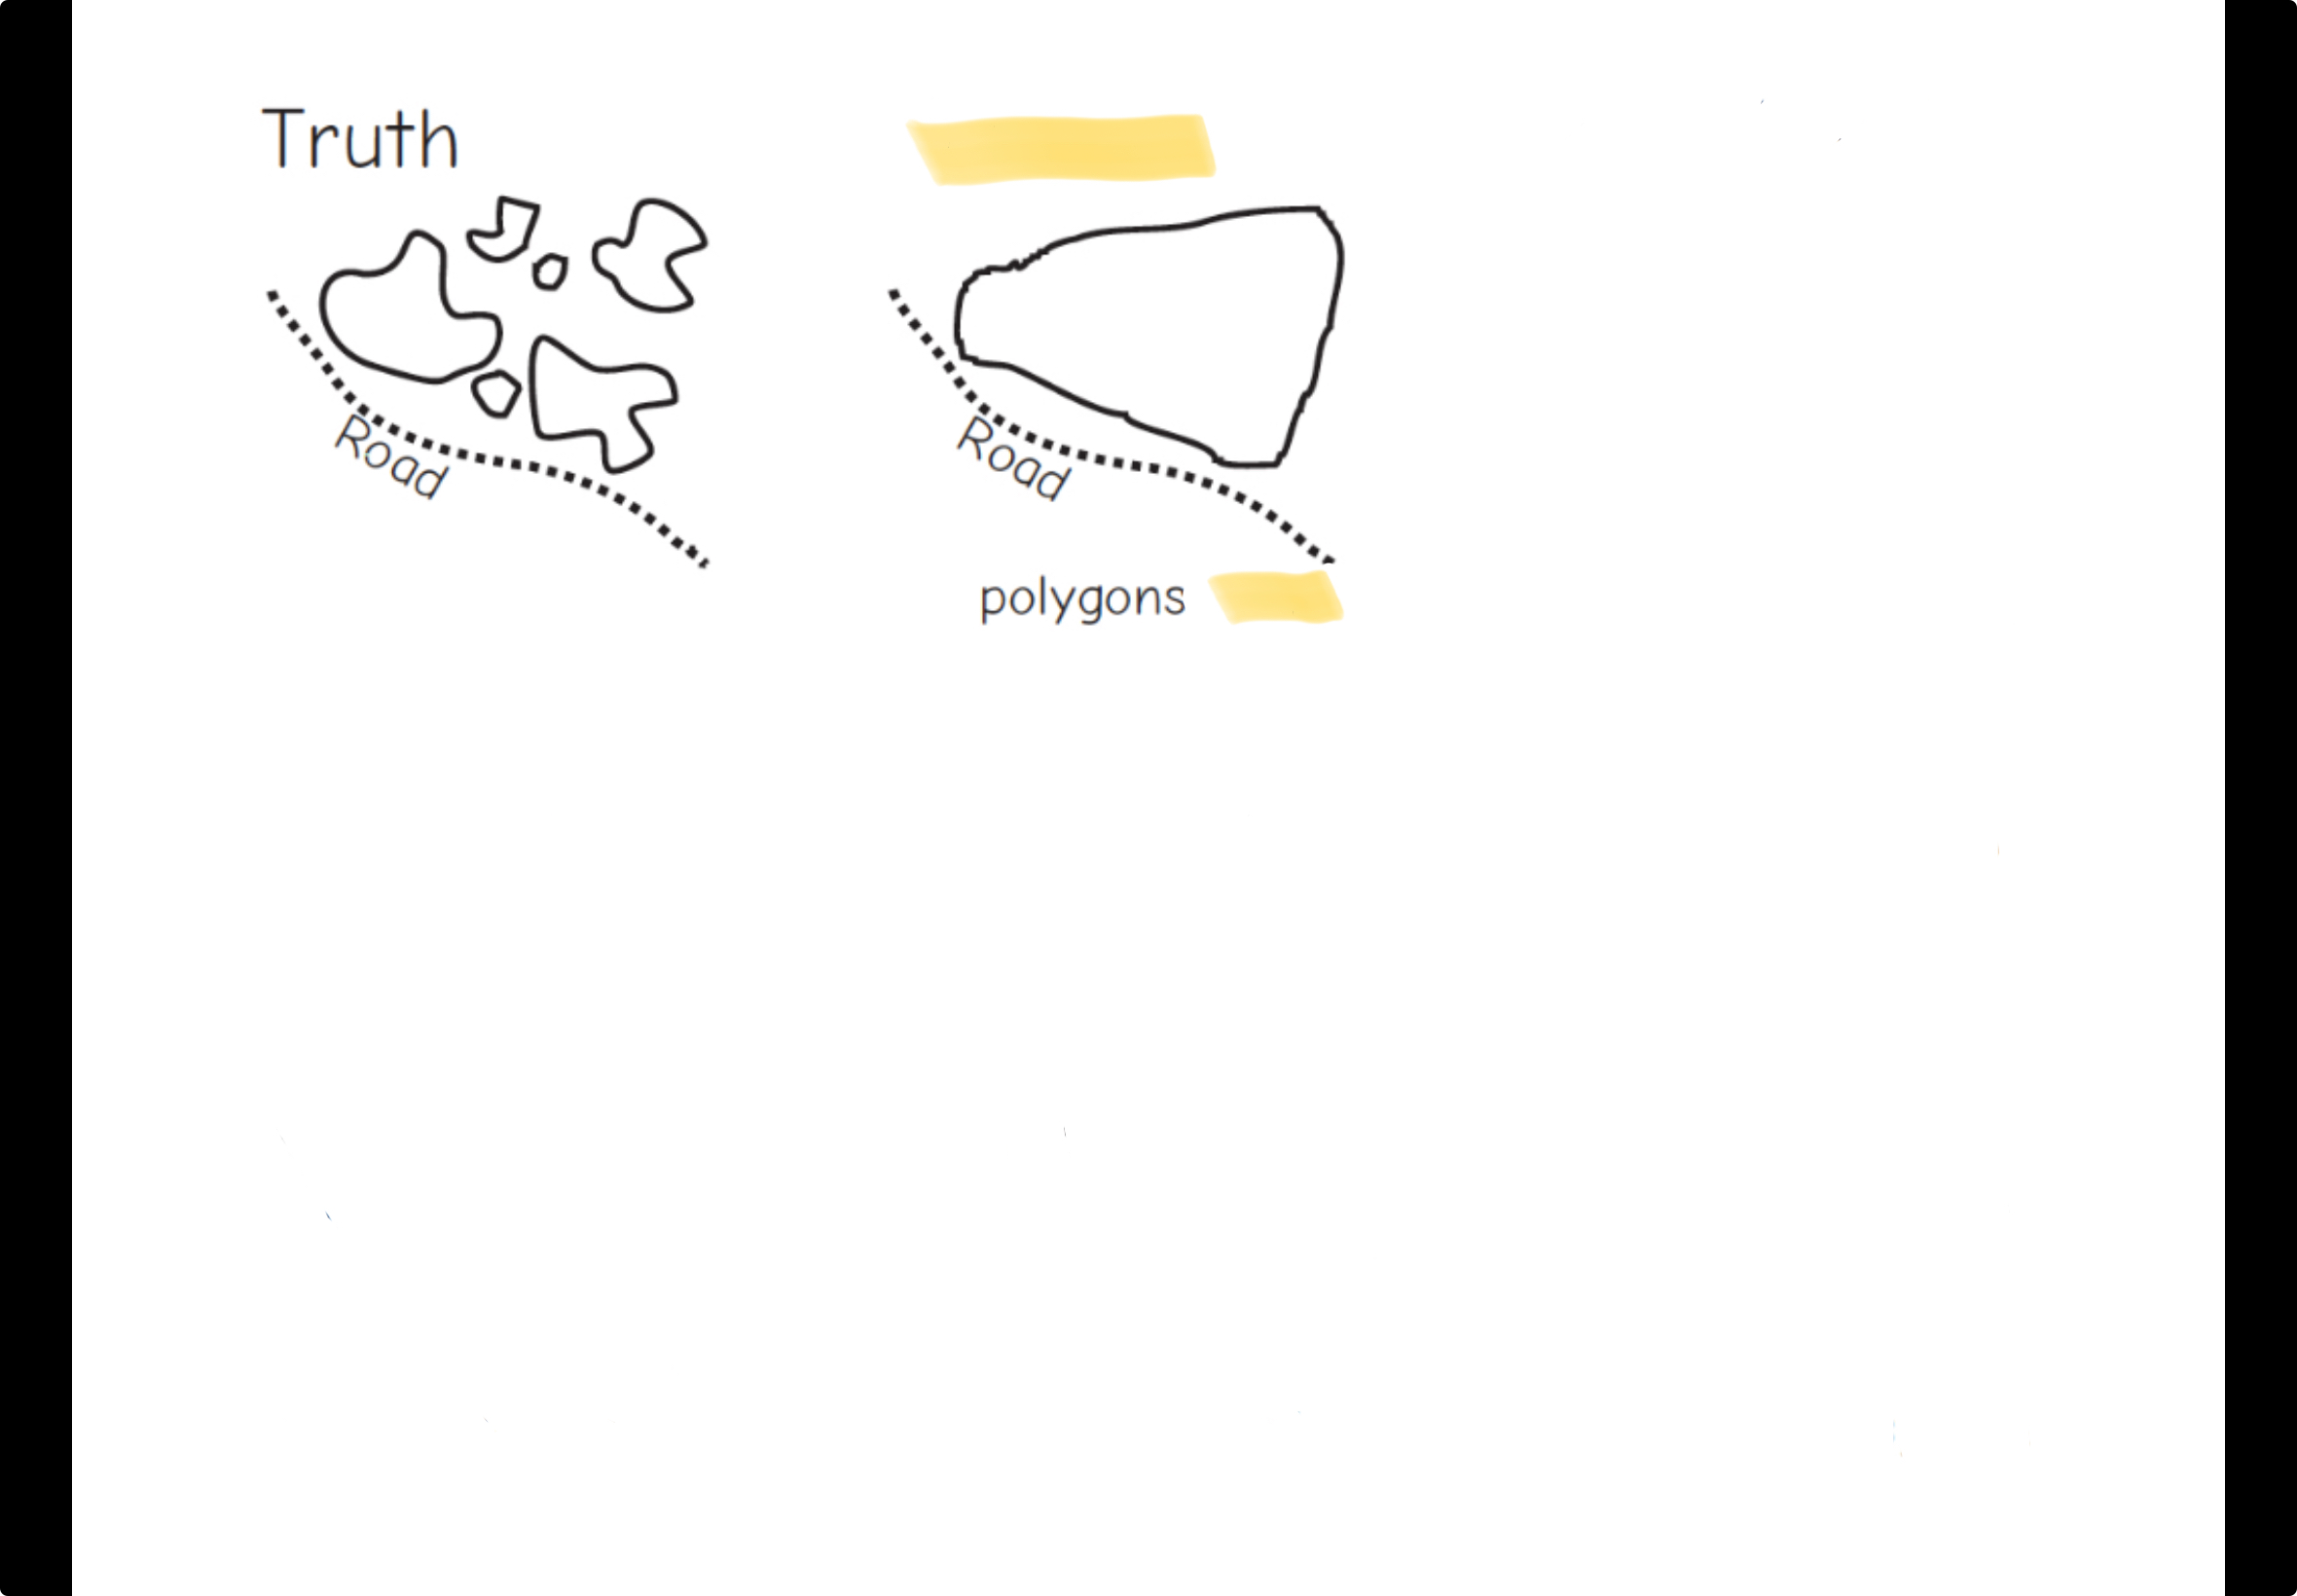
Fused
Exaggerated

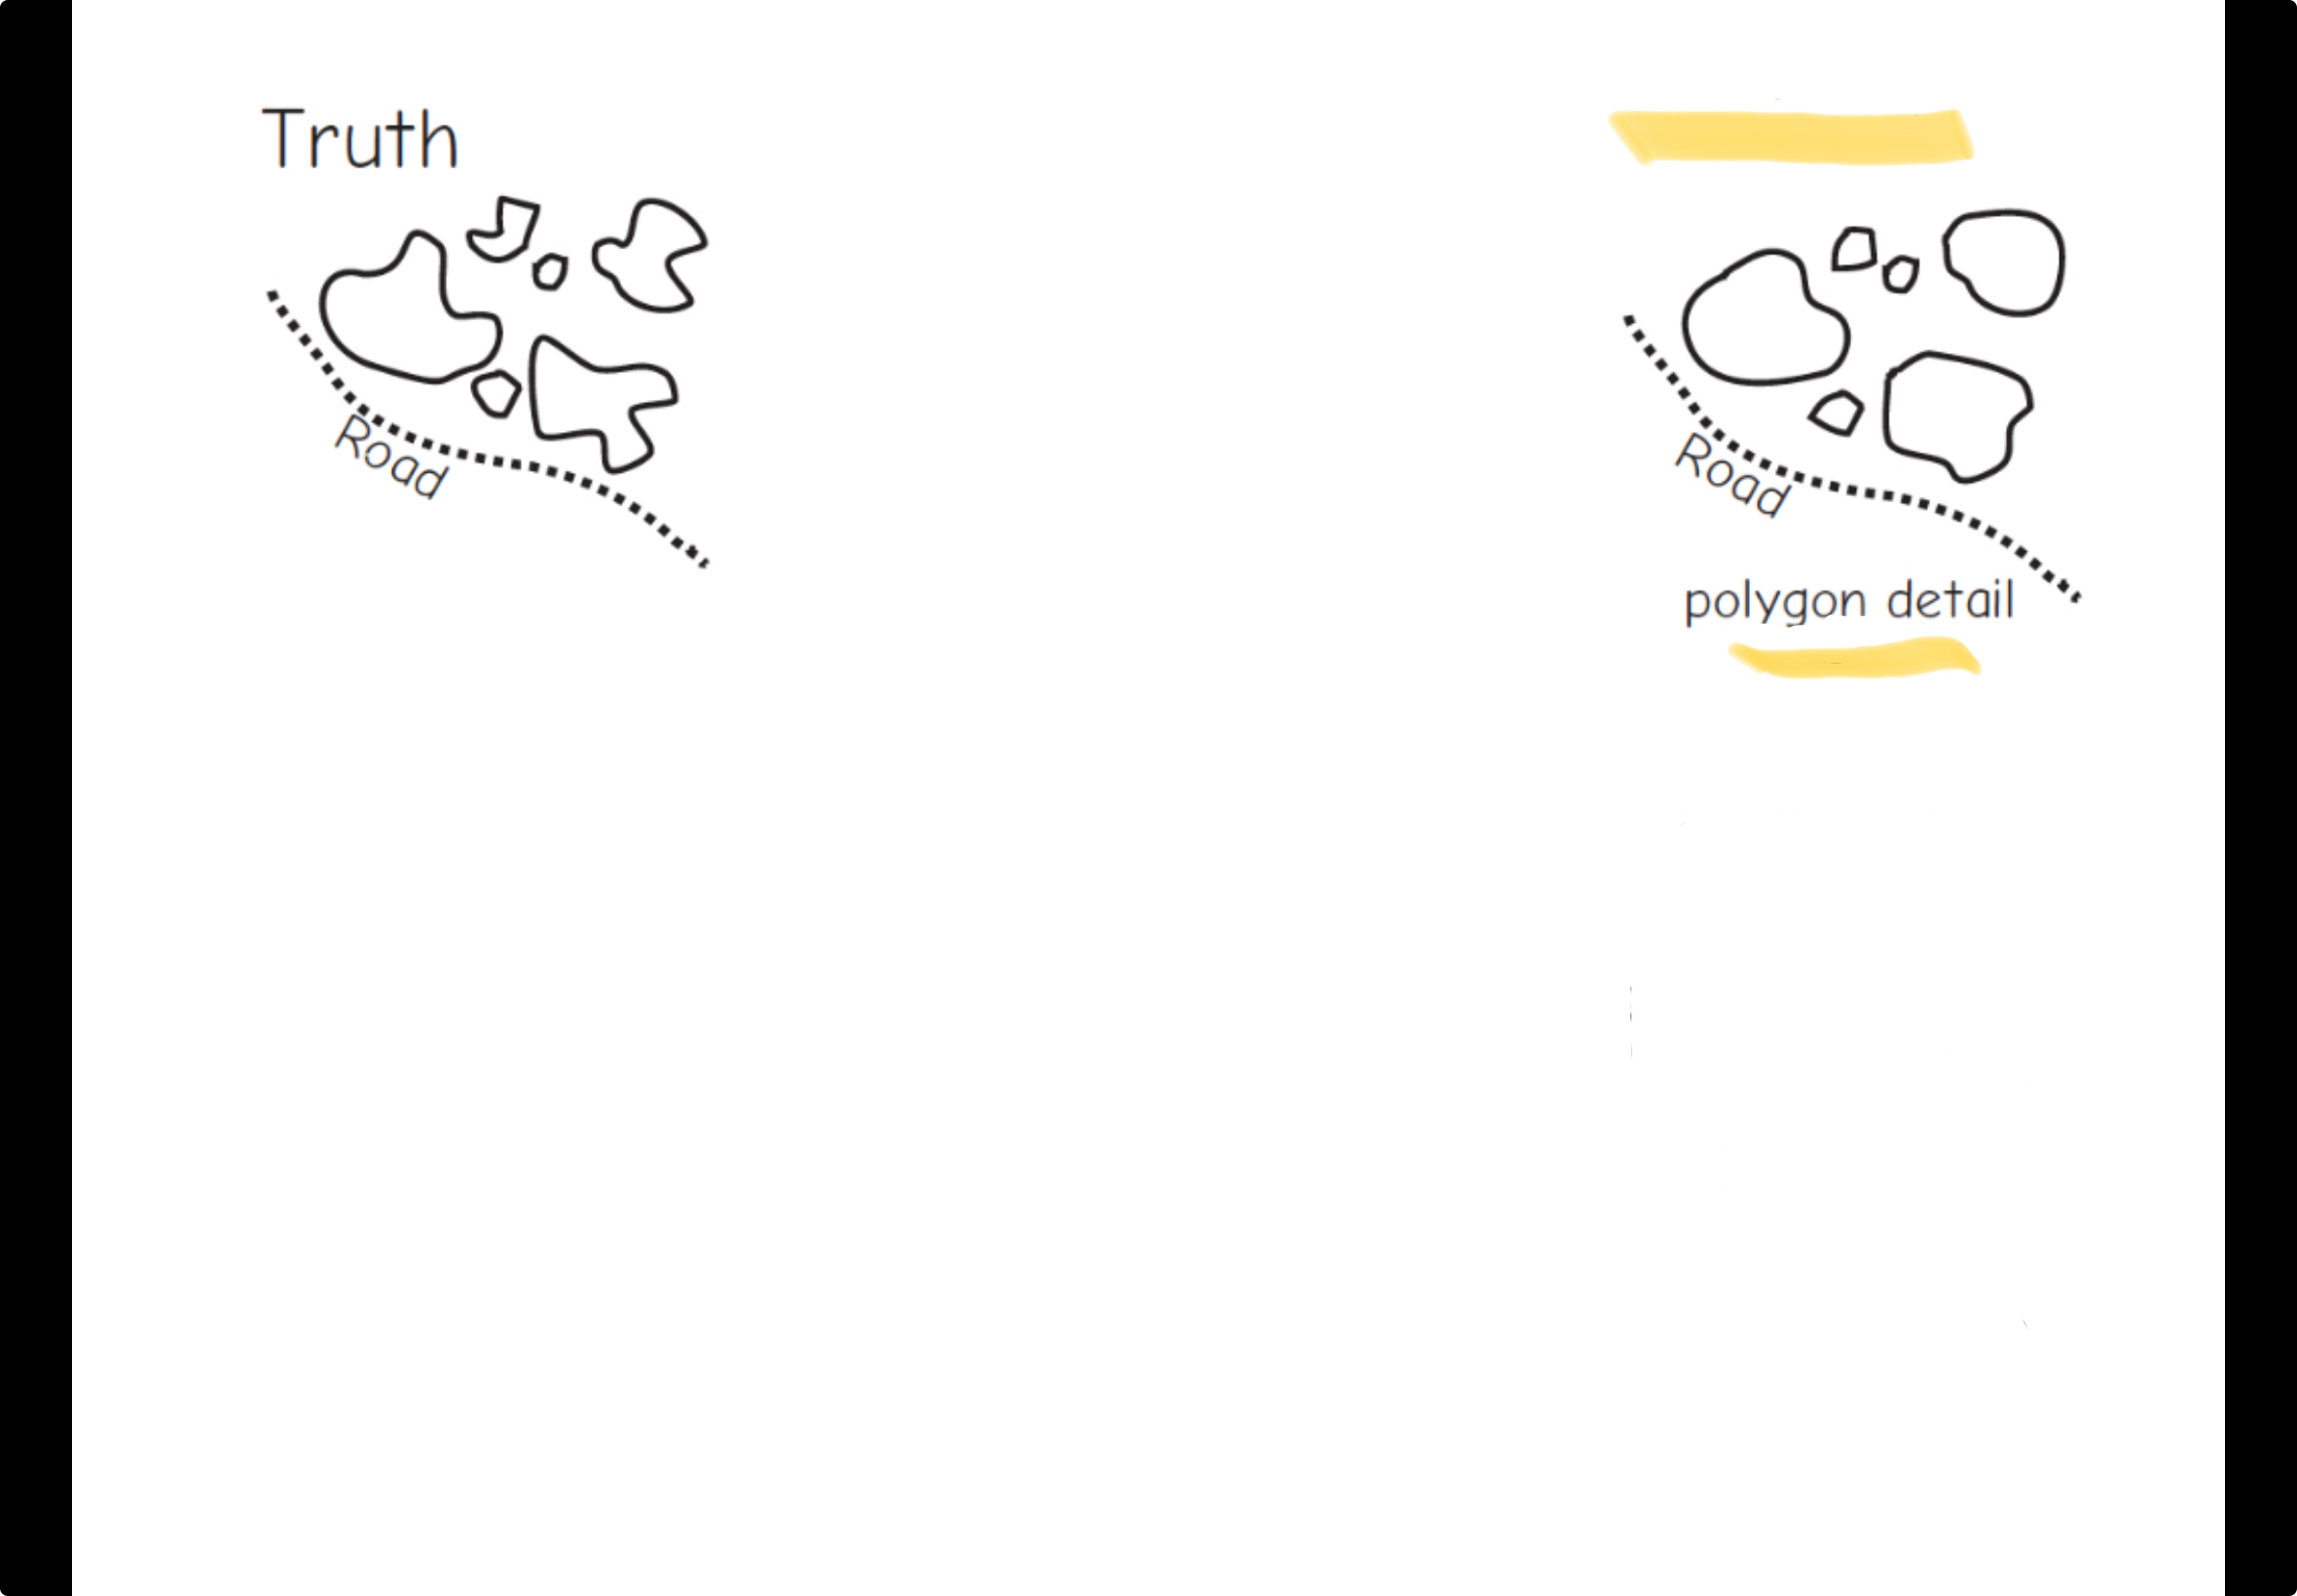
Simplified
Displaced
Scale
Ratio of distance on map to earth
Distance measurements determine
Shape, size, etc
T/F: time is optional
True
T/F: Location is not necessary
False
Locations need to be
Unique
Easily shared
Georeference
Shared means of explaining location and position
3 components of georeferecne
Coordinate system
Map scale/spatial resolution
Projection
What do you need to georeference?
Provision for fine spatial resolution
Ability to measure distance
Allowance for other spatial analysis
Cartesian coordinate system
2D systems = plane coordinate systems
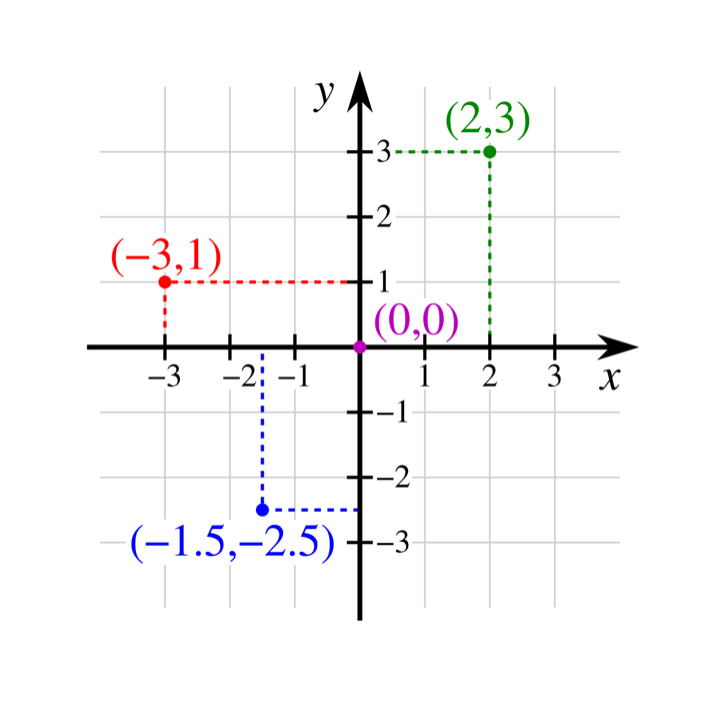
Cartesian coordinate systems
Latitude
X-axis
Longitude
Y-axis
What is the only true geographic coordinate system?
Latitude and longitude
What are the reference planes for lat/long?
Equator and prime meridian
Coordinate pairs
Pairs of lat and long
Do lines of latitude intersect?
No, they are parallels
Do longitude lines intersect?
Yes, they are meridians that intersect at the poles
What must not be forgotten in coordinate pairs?
Hemisphere
Where is the origin for coordinate pairs?
0 d N/S, 0 d E/W
Intersection of prime meridian and equator
Latitude is
Angular distance north or south of equator
Longitude is
Angular distance east or west of prime meridian
What do latitude and longitude from when combined
Graticule or reference grid