Week 11 graphs
1/12
There's no tags or description
Looks like no tags are added yet.
Name | Mastery | Learn | Test | Matching | Spaced | Call with Kai |
|---|
No analytics yet
Send a link to your students to track their progress
13 Terms

Graph which represents an ecological niche as an area of N dimensional hypervolume, based on all its resources and tolerances necessary for survival.
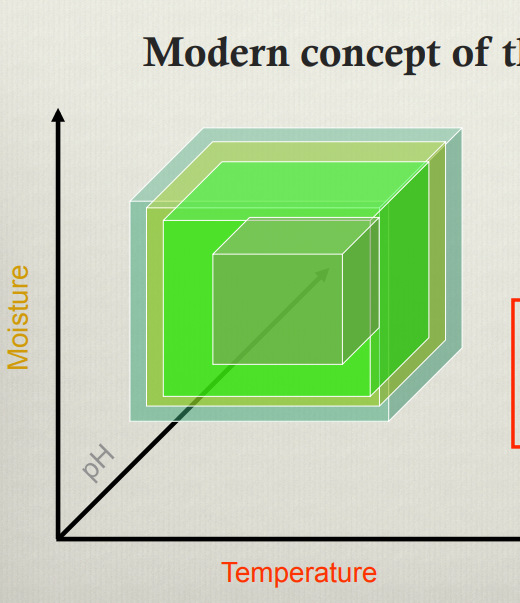
Shows that a niche can decrease in size, with a species only able to occupy areas with a certain set of conditions and resources. This occurs due to interspecific competition with an species which has partial niche overlap forcing the competitor to narrow its niche in resource partitioning to prevent competitive exclusion.
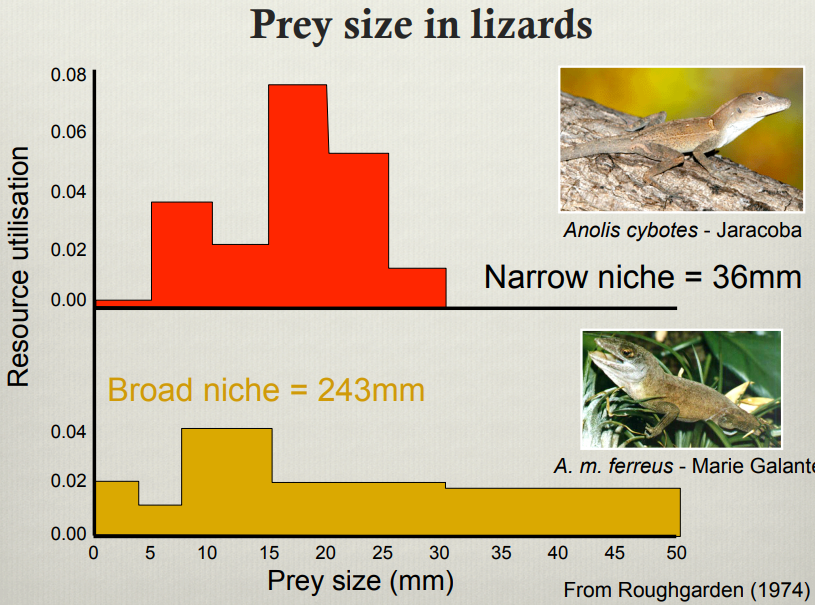
Represents how anolis lizards are able to exploit a different breadth of resources depending on their species,anolis cybotes has a narrow niche that allows it to utilize specific resources, whereas other anolis species can exploit a wider variety of resources
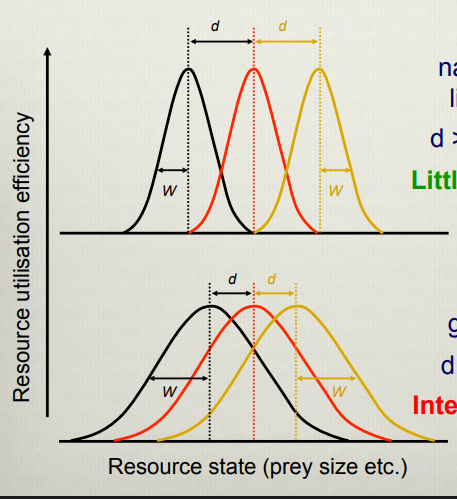
Demonstrates the limiting similarity problem which aims to see how much niche overlap is possible before co-existence becomes unstable. This model assumes an uni - dimensional resource and unidimensional realised niches. This model suggests that stable co-existence is possible where the distance between the peaks of the niches is greater than the relative niche width. Therefore stable co-existence can be achieved either through narrowing of niches reducing width, or through co evolving widely spaced niches
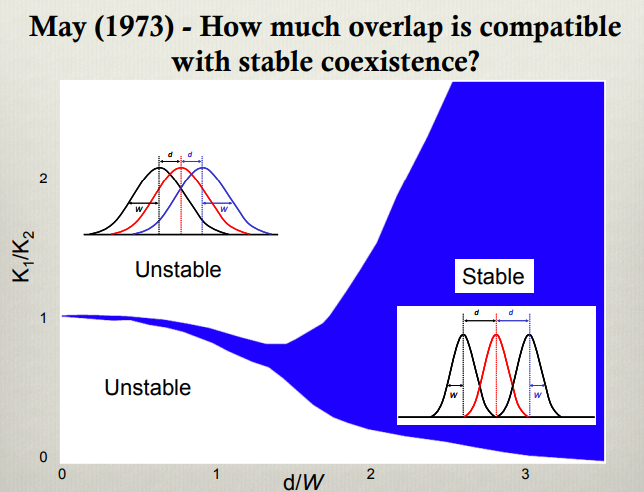
How much overlap is compatible with co-existence when species have different carrying capacity. model assumes peripheral species have equal carrying capacity. As overlap increases it is seen that the space where species are able to stably coexist decreases. At a high level, the space where co-existence is possible is small, and natural fluctuations in population size will result in them exceeding this leading to population crashed.
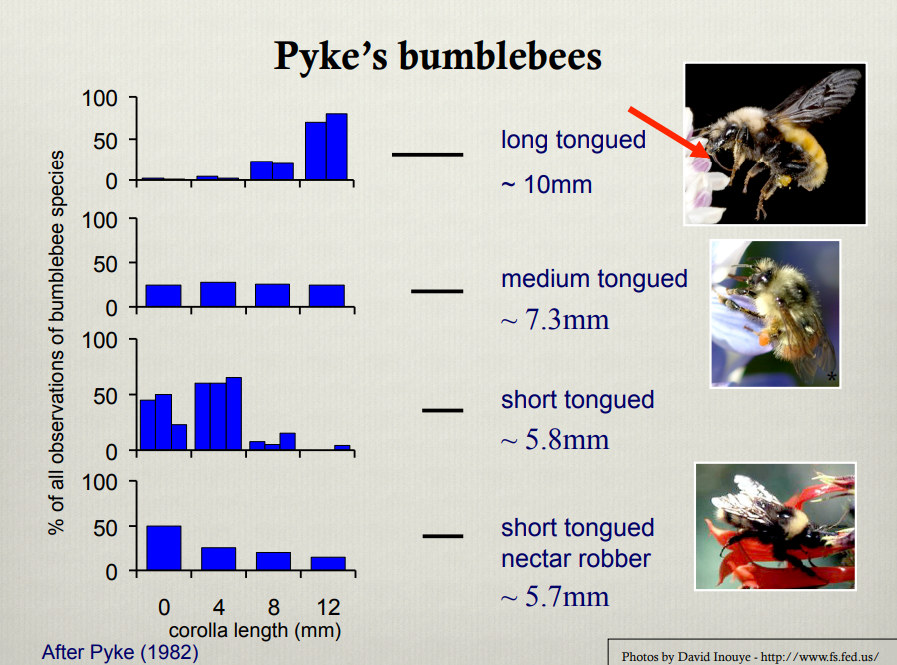
Pykes bumblebees. They demonstrated niche partitioning as depending on their tongue length they exhibited different foraging behaviour, with long tongued bees accessing flowers with longer corrolas while short-tongued bees foraged on shorter corrolas. Medium lenght showed the greatest breadth. This partitioning reduces competition for resources among the species. The exception to this was the short tongued nectar robber which showed niche parttioning in a second dimention - is able to chew through the base of the flower, making its foraging ability less limited by corrola length. The bees also showed niche partitioning in space, as species who shared a tongue length would not be found in the same foraging area to minimize competition. This allows for resource use without significant niche overlap, enhancing survival and reproductive success among different bumblebee species.
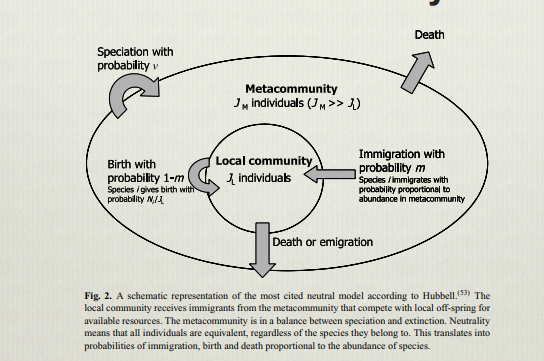
Schematic of a model of neutral theory, It explains the biodiversity of a metapopulation as the stochastic balance between speciation and extinction, and the biodiversity of a local community as the balance between immigration and extinction depending on their respective probability due to random abundance within the metacommunity.
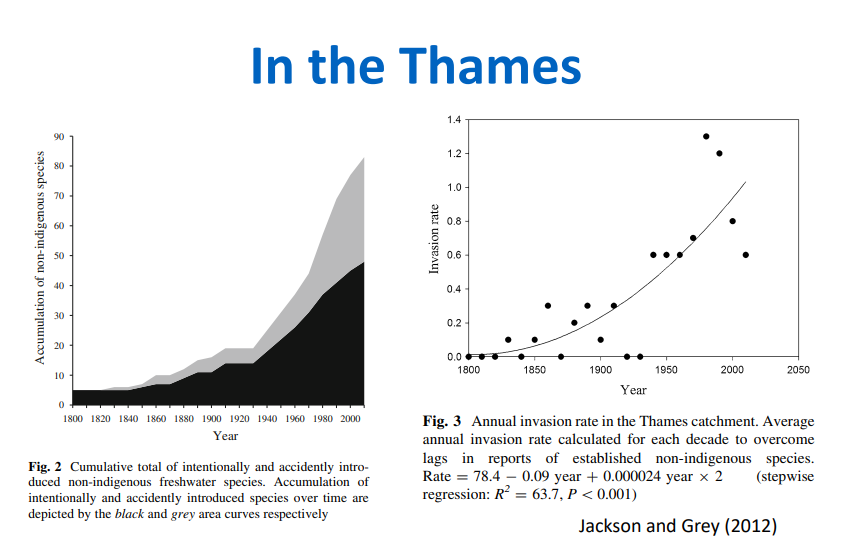
Shows that the rate of species invasion in the thames is increasing over time.
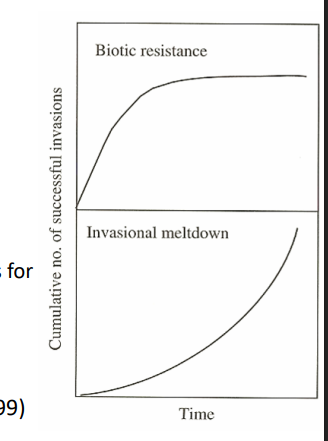
Shows how the rate of invasive species establishment changes depending on whether it follows the biotic resistance model or invasional meltdown model. The biotic resistance model suggests that native species limit invasions due to competition, with the rate of invasion decreasing as the cumulative number of invasions incrreases and increases the level of competition for future competitors, while the invasional meltdown model posits that existing invasive species facilitate the establishment of new ones, resulting in an increased rate of invasion success over time.
For example:
invasive dreissenid mussels providing food in the form of ‘pseudo-faeces’ and a protective habitat for amphipod Echinogammarus ischnus, or parasitic sea lamprey Petromyzon marinus which suppressed native predatory salmonids and released Alosa pseudoharengus from predation pressure
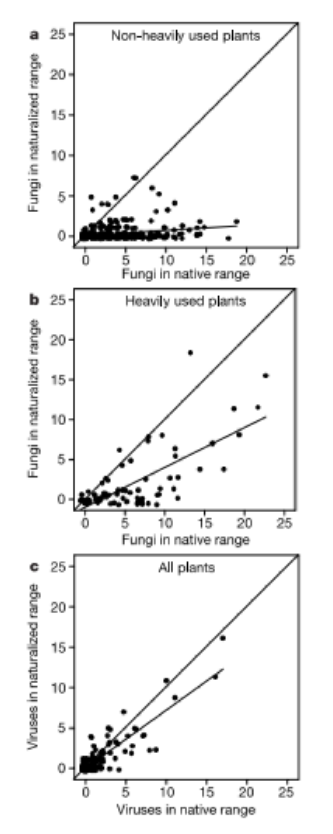
Shows that plants had fewer pathogens in their naturalised ranges than the invasive range. The effect of this is strong in non heavily used plants, weaker in heavily used, and less evident in the case of viral pathogens.
overall Non-native species had fewer pathogen and virus species than comparable native plant species
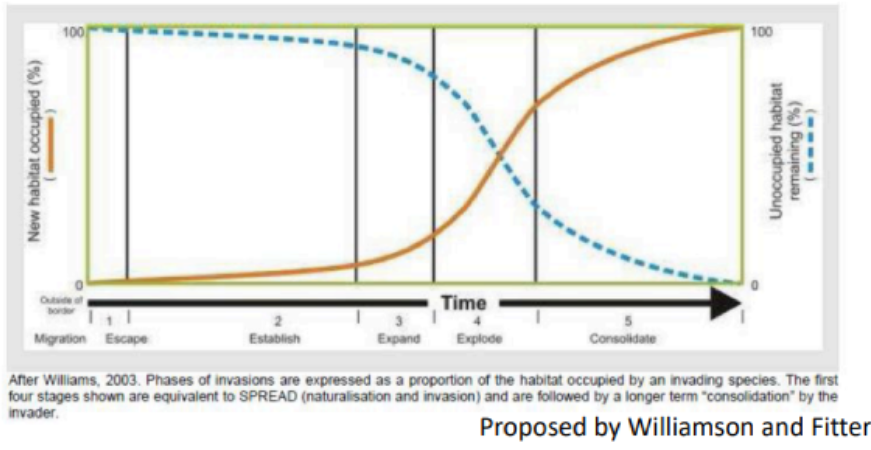
Graph showing the rate a habitat gets occupied by invasive species based on the rule of tens. At 10% occupying the habitat, it is considered to be established, following which, the population begins to expand and then explode, fully occupying the habitat. If the invasive species is not managed before the explode stage, it is near impossible to remove with the only available option to try and manage the new populaion.
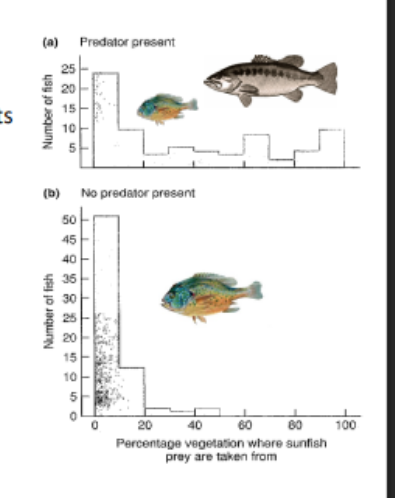
The presence of an invasive predator causes the sunfish to spend more time in areas with high vegetation cover, which is not their usual occupied niche. Therefore the invasion of predators affects their fitness.
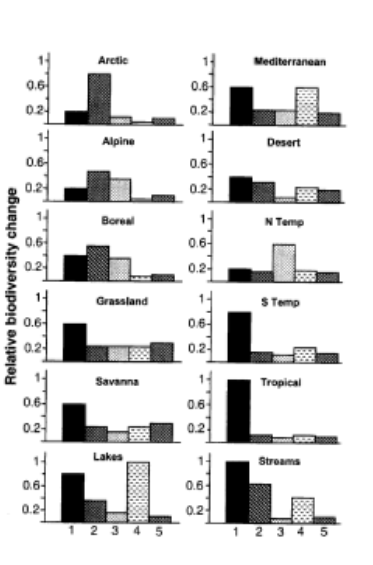
Shows that invasive species have more impact on freshwater environments. This is attributed to their relative isolation from other ecosystems strengthening the effect of a trophic cascade and the frequent introduction of organisms in these environments.