Research & Statistics Exam I
1/50
There's no tags or description
Looks like no tags are added yet.
Name | Mastery | Learn | Test | Matching | Spaced | Call with Kai |
|---|
No analytics yet
Send a link to your students to track their progress
51 Terms
Nominal
Applies a label
Numbers do not represent amounts of anything - they only distinguish groups
Numbers have no meaning
Ordinal
Ranking
Quantitative
Interval
Information about distance between points on the scale
No meaningful zero point
The Likert Scale
Ratio
Meaningful zero point
Examples:
how many jelly beans were eaten
multiple choice questions answered correctly
income
time
Independent Variable (IV)
The factor that the researcher changes or controls
Manipulates in an experiment to see it’s effect on another variable
Categorical
Exactly two levels
Dependent Variable
The outcome or effect being measured that changes in response to manipulations
Quantitative
On the interval scale
Descriptive Statistics
Simply describing your sample
Measures of central tendency (mean, median, mode)
Measures of validity (range, standard deviation)
Inferential Statistics
Inferring something about what’s happening in the population based on what we found in our sample
Conducting Inferential Statistics Research
On a sample (subset) taken from the entire population of interest
Sampling Distribution
A theortical distribution consisting of the mean scores for all possible random samples of a given size that can be drawn from a population
Central Limit Theorem
The mean of the sampling distribution = mean of the population
The sampling distribution becomes more normal as N increases
Degrees of Freedom
The number of scores in a dataset that are free to vary (i.e., take on any value) given a particular mean
The Degrees of Freedom Determine
The shape of the sampling distribution
Null Hypothesis
States that no differences exist
Our IV has no effect
There is no relationship
The Null Hypothesis is Always Stated in
Population terms - we are trying to characterize what’s going on in the population
p value
The probability of getting your outcome, if the outcome is true
Every Sample Mean has
A probability associated with it
Alpha
The area under the curve
Does not change at any point in the process
Alpha in a Directional One Tailed Test
It is put on one side of the distribution
When do we Reject the Nul Hypothesis
If p ≤ .05
If you Reject the Null Hypothesis you have Achieved
Statistical Significance
Critical Value
Will always have p = α
p = α : α
Area under the curve
It is always constant
p = α : p
The value of p will vary from 0 to 1.00 depending on the value of your sample mean
p only equates α at the critical value
Directional Conditions (1)
You must have some expectation that the difference will fall in one direction and not the other
Directional Conditions (2)
You must have zero interest in the outcome if it should end up in the opposite direction
Why do you Never Say “Accept the Null”
States there is no relationsip between your variables of interest in the population
To say that you assert the null is a true statement
“Failed to Reject the Null” Acknowledges
That you don’t know why you didn’t reject the null
Type I Error
You rejected the null when it was true
Declaring there to be an effet when there isn’t one
False positive
Type II Error
Failing to reject the null hypothesis when the null hypothesis is false
When someone claims there is no difference but there actually is a difference
False negative
Between Subjects
Participants are only exposed to one level of the IV - they only experience one variable of the IV
Conditions you Would Use a T-Test
Your IV us between subjects and categorical
Your IV has exactly two levels
Your DV is continious and quantitative - at least on the interval scale
Assumptions of the T-Test
Your samples are independently and randomly selected from their population
Scores on the DV are normally distributed in the population
Homogeneity of Variance
Homogeneity of Variance
The variablity of the scores in the first group are equivilant to the variablity of scores in the second group
SS
Sums of squares - the SD from the mean
n
The number of scores in one subgroup
N
Total number of scores in all groups combined
Always refers to your total sample size
How do you Make the T Formula Bigger
Increase the numerator
Decrease the dominator
Between Group Variability
The extent to which your group means are fluctuating (i.e., differ from one another)
Within Group Variability
The extent to which individual participant scores within each group are fluctuating
n2 Equation
SS Total = SS Between + SS Within
n2 equation (2)
SSbetween over SStotal
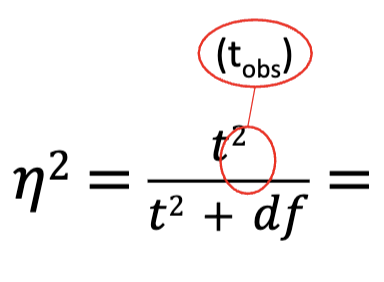
Computational Formula for N2
Rule of Thumb for N2
Weak: .05
Moderate: .10
Strong: .15
Three Questions (1)
Is there an effect?
Compare tobs and tcrit if t > tcrit reject Ho, there is an effect
Three Questions (2)
What is the nature of the effect?
Which group scored higher on the DV? - Eyeball the means. The mean of group 2 was higher than the mean of group 1
Three Questions (3)
How strong was the effect?
n2
Why is it n-2
There is one place in the dataset that is not free to vary
BGV Graph
How far apart or close the center point of 1 and 2 are
WGV Graph
How wide are the graphs
SSwithin
SS1 + SS2