A level Stats
1/55
There's no tags or description
Looks like no tags are added yet.
Name | Mastery | Learn | Test | Matching | Spaced |
|---|
No study sessions yet.
56 Terms
population
whole set of items that are of interest
census
observes or measures every member of a population
sample
selection of observations taken from a subset of the population which is used to find information about the whole
advantages of a census
it should give a completely accurate result
disadvantages of a census
time consuming and expensive
cannot be used when testing process destroys the item
hard to process large quantity of data
advantages of a sample
less time consuming and expensive than a census
fewer people have to respond
less data to process than in a census
disadvantages of a sample
data may not be as accurate
the sample may not be large enough to give information about small sub-groups of the population
sampling units
individuals (units) of a population
sampling frame
list of sampling units
what are the three types of random sampling?
Simple random, stratified, and systematic sampling
simple random sampling
the elements of the sample have an equal chance of being selected
two types of simple random sampling
random number and lottery sampling
advantages of simple random sampling
free of bias
each sampling unit has a known and equal chance of selection
easy and cheap to implement for small populations and small samples
disadvantages of simple random sampling
not suitable when population size or sample size is large as it is potentially time consuming,disruptive and expensive
a samplign frame is needed
systematic sampling
the required elemenrs are chosen at regular intervals from an ordered list/take every kth unit when k = pop/sample (first person is chosen at randomly)
advantages of systematic random sampling
simple and quick to use
suitable for large samples and large populations
disadvantages of systematic sampling
sampling frame is needed
can introduce bias if the sampling frame is not random
stratified sampling
population is divided into mutually exclusive strata (groups) and a random sample is taken from each.
no. sampled in a stratum = no. in stratum/no.in population x overal sample size
advantages of stratified sampling
reflect population structure
guarantees proportional representation of groups within a population
disadvantages of stratified sampling
population must be clearly classified into strata
selectrion within each stratum suffers from the same disadvantages as simple randomsampling.
two types of non-random sampling
quota and opportunity sampling
quota sampling
interviewer or researcher selects a sample that reflects the characteristics of a whole population - like stratified sampling, strata are filled by interviwer or researcher
advantages of quota sampling
no sampling frame required
allows a small sample to still be representative of a whole population
quick, easy and inexpensive
disadvantages of quota sampling
non-random sampling can introduce bias
non-responses are not recorded as such
opportunity sampling
taking the sample from people who are available at the time the study is carried out and who fit the criteria you are looking for.
advantages of opportunity sampling
easy to carry out and cheap
disadvantages of quota sampling
unlikely to be representative and highly dependent on individual researcher
quantitative data
numerical data eg. shoe size
qualitative data
non-numerical data eg. hair colour
discrete
a variable that can take only specific values in a given range eg. number of girls in a family has to be an integer
comtinuous
a variable that can take any value in a given range eg. time
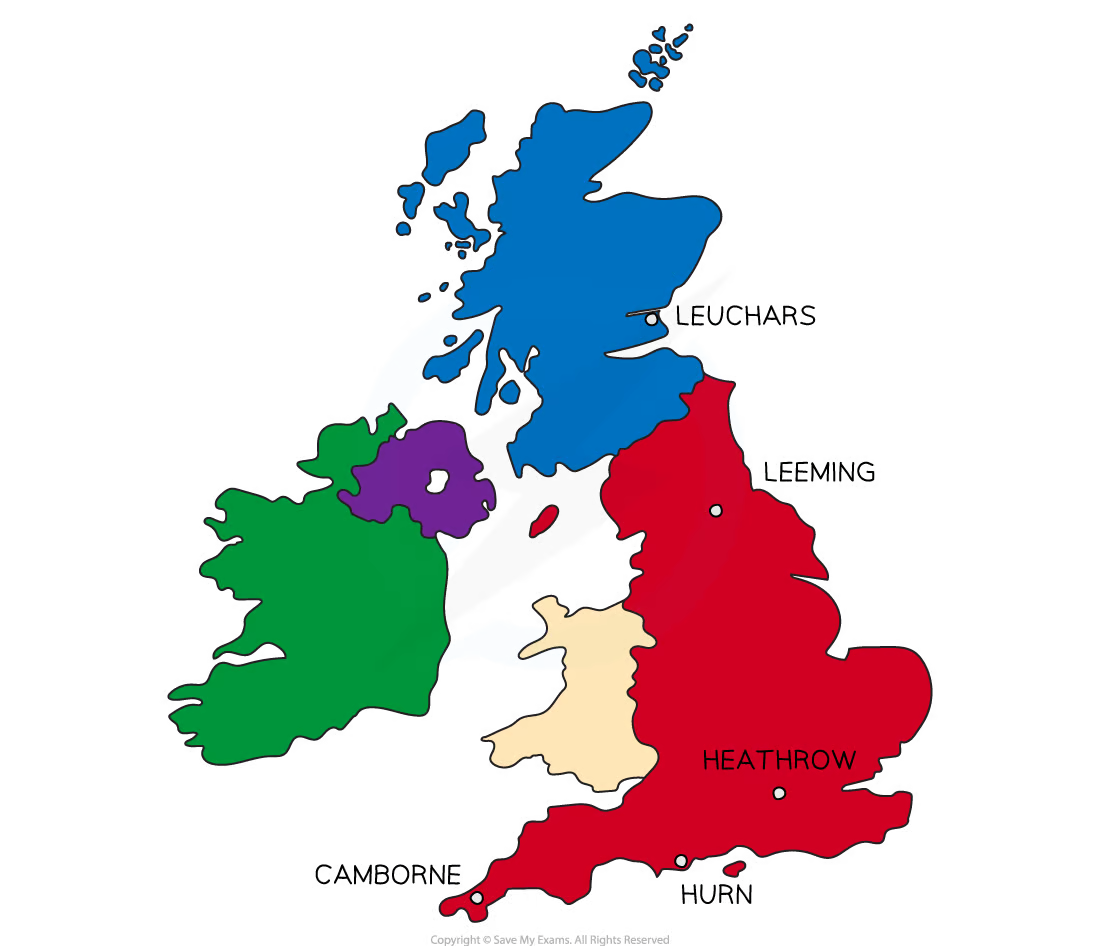
what are the five UK weather stations?
Leuchars (most northern)
Leeming
Heathrow
Hurn
Camborne (most southern)

map of Uk weather stations
what are the 3 international stations?
Jacksonville (Nothern Hemisphere)
Beijing (Northern Hemisphere)
Perth (southern hemisphere)

map of international stations
when for large data sets?
may - october 1987 and 2015
coastal weather stations
windier and rainier areas in UK
southern weather stations
more sunshine and warmer in the day in the UK
perth
summer and winter switched around + very hot in summer
beijing
really hot, really rainy in the summer, very cold in the winter (more extreme)
jacksonville
warm and prone to hurricanes, two hurricans in oct 87 and oct 15
daily mean temp
(°C) - average of the hourly temperature readings during a 24 hour period
daily total rainfall
includes snow and hail - amounts less than 0.05 mm are recorded as ‘tr’ or ‘trace’ (treat as 0 in calculations)
n/a
means reading is not available, can’t be used in a sample
daily total sunshine
recorded to the nearest tenth of an hour
daily mean cloud cover
meaured in oktas or eigths of the sky covered by clouds (integers from 0 - 8)
daily maximum gust
strongest windspeed 1 knot = 1.15mph, great storm UK ocr 15/16th ‘87
daily mean wind direction and windspeed
knots, averaged over 24 hours, wind directions are given as bearings and as cardinal (compass) directions. data for mean windspeed is also categorised according to beauford scale
daily max relative humidity
percentage air saturation with water - relative humidities abpove 9% give rise to misty and foggy conditions
daily mean visbility
measured in (Dm) decametres. - greatest horizontal distance at which an object can be seen in the distance
daily mean pressure
measured in hPa, hectopascals
casual relationship
if a change in one variable causes a change in the other (however, just because 2 variables show correlation does not necessarily mean they have a casual relationship)
regression line
y = a + bx
when is using a regression line valid
regression line should only be used to predict a value of y when given x
interpolation
estimate inside the data range - reliable
extrapolation
estimate outside the data range