AP Economy
1/39
There's no tags or description
Looks like no tags are added yet.
Name | Mastery | Learn | Test | Matching | Spaced |
|---|
No study sessions yet.
40 Terms
Profit
Total Revenue - Total Cost
Total Revenue
All the money the firm takes in from its sales
OR
P * Q
Total Cost
Comprises of two type of costs, explicit + implicit
EXPLICIT: cost that involves laying out money
IMPLICIT: doesn’t require outlay of money; measured by the value in terms of benefits that are forgone
Economic Profit
TOTAL REVENUE - OPPORTUNITY - EXPLICIT DEPREICFATION
Accounting Profit
TOTAL REVENUE - EXPLICIT COSTS/DEPRICATION
Implicit Cost of Capital
The opportunity cost of the capital used by a business — the income the owner could have realized from that capital if it had been used in its next best alternative WAY
Accounting Profit indicators
+ - best current use of resources
- : there is a better alternative use for resources
0: couldn’t be better or worse off
Principal of Marginal Analysis
every activity should continue until MARGINAL BENEFIT EQUALS MARGINAL COST
Marginal Revenue
The change in total revenue generated by an additional unit of output
Optimum output rule
Profit is maximized by producing the quantity of output at which the marginal revenue of the last unit produced is equal to its marginal cost
CHARTS FOR OUTPUT
MC - Total Cost Change
(EX: P1: 30
P2: 35
P2 - P1 = MC)
MR - CONSTANT COST OF A PRODUCT
Profit: Total Revenue - Total Cost
KEEP PRODUCING UNTIL PROFIT drops (highest possible profit)
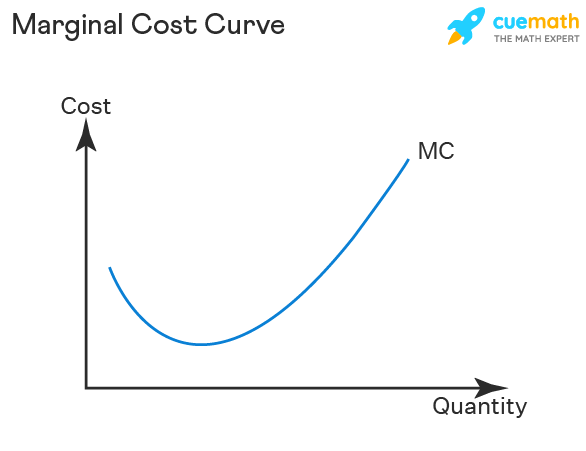
Marginal Cost Curve
shows how the cost of producing one more unit depends on the quantity that has already been produced
Profit Maximizing Quantity
Keep producing until you reach negative/make more revenue than costs
Marginal Revenue Curve
Shows how the marginal revenue varies as output varies
Production Function
The relationship between the quantity of inputs a firm uses and the quantity of outputs it produces
Fixed
an input whose quantity cannot be varied for a period of time
Variable input
An input whose quantity the firm can vary at any time
LONG RUN
period in which ALL inputs can be varies
SHORT RUN
period in which AT LEAST ONE input is varied
Production Function
The relationship between the quantity of the variable input and the quantity of output for a given quantity of a fixed input
Total product curve
increases at a decreasing rate, shows how the quantity of output depends on the quantity of variable input for any given quantity of fixed input
EX: too many people in the kitchen, becomes counter productive
Marginal Product Curve
when an increase in the quantity of that input, holding the levels of all other inputs fixed, leads to a decrease in the marginal product of that input
same as original curve, but reflecting CHANGE instead of overall
Law of Diminishing returns
When an increase in the quantity of that input PRODUCED, holding the levels of all other inputs fixed, leads to a decrease in the marginal product of that input
Fixed costs
Does not depend on the quantity of output produced EX: oven
Variable Costs
A cost that depends on the quantity of output produced EX: ingredients, pay for workers
Total Cost Curve
Becomes steeper as more output is produced due to diminishing returns
COST DEPENDS ON QUANTITY OUTPUT
could be bent based on FIXED COSTS
Marginal Cost
Change in total cost by producing 1 more unit
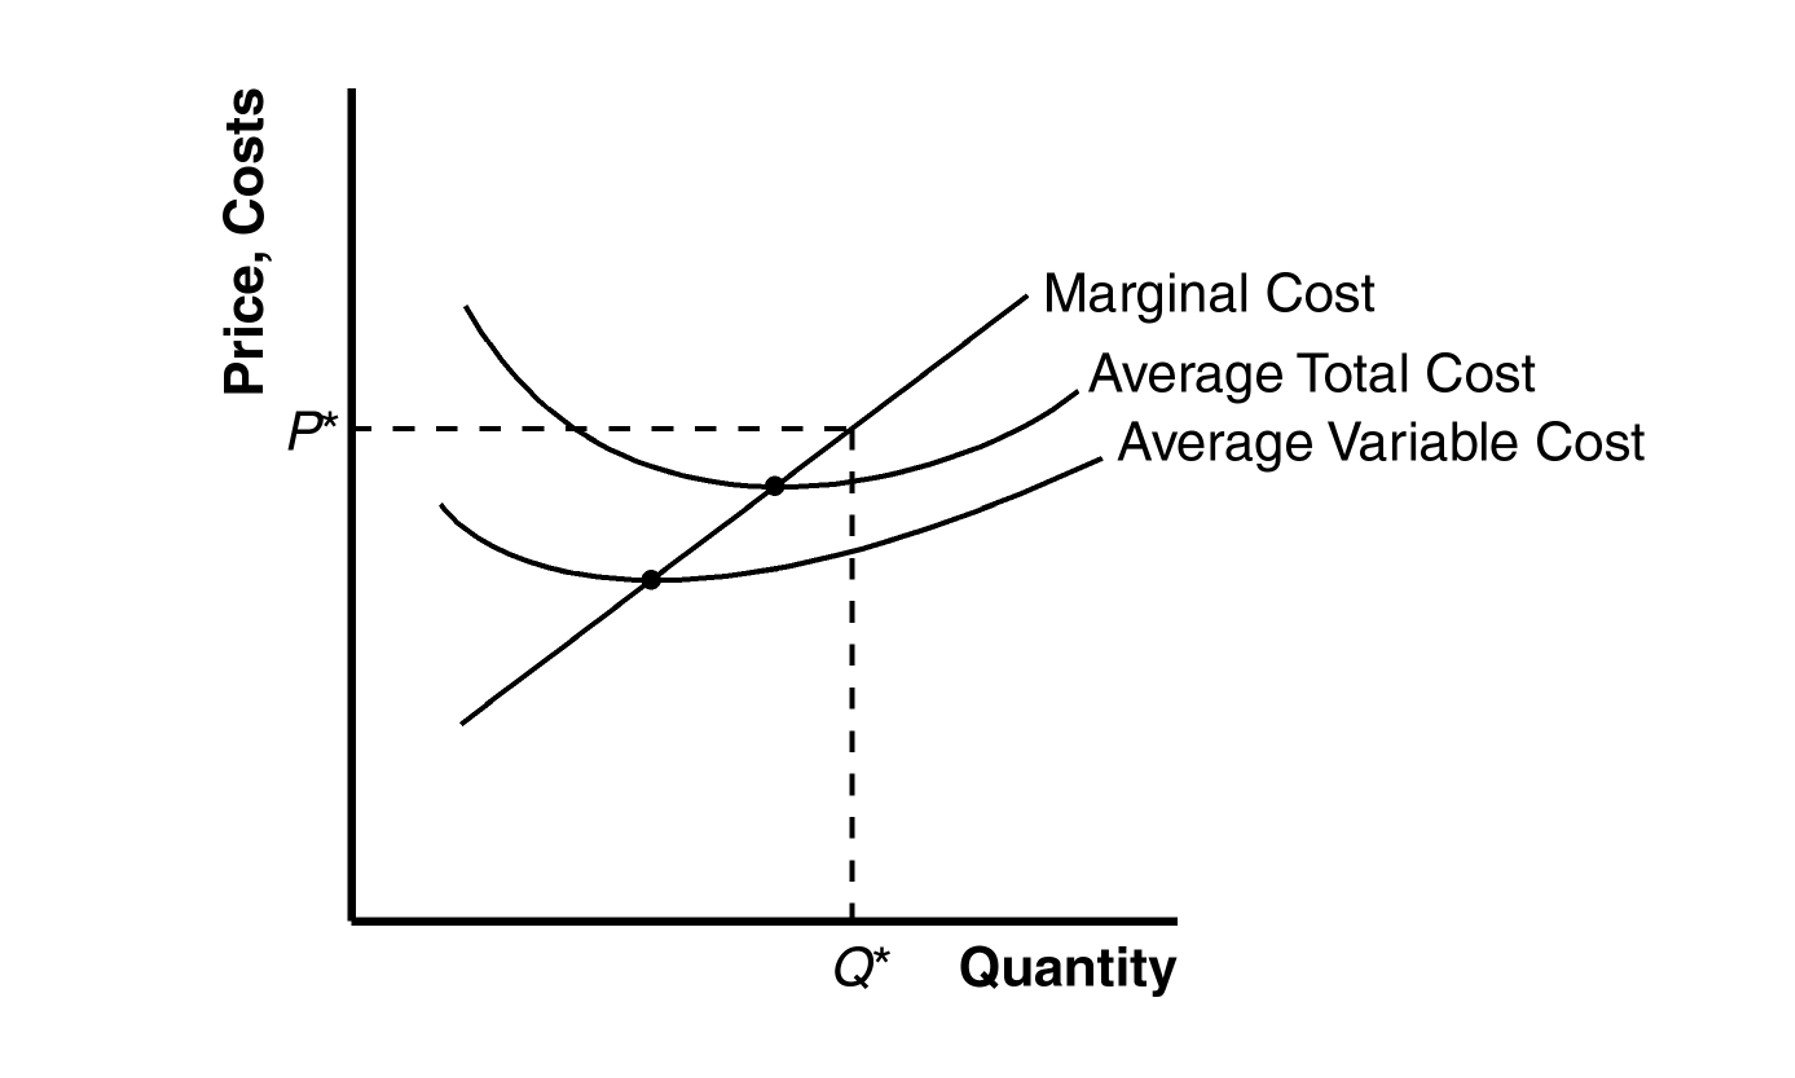
Average Total Cost
total cost divided by quantity of output produced, minimum costs can be MC = MR
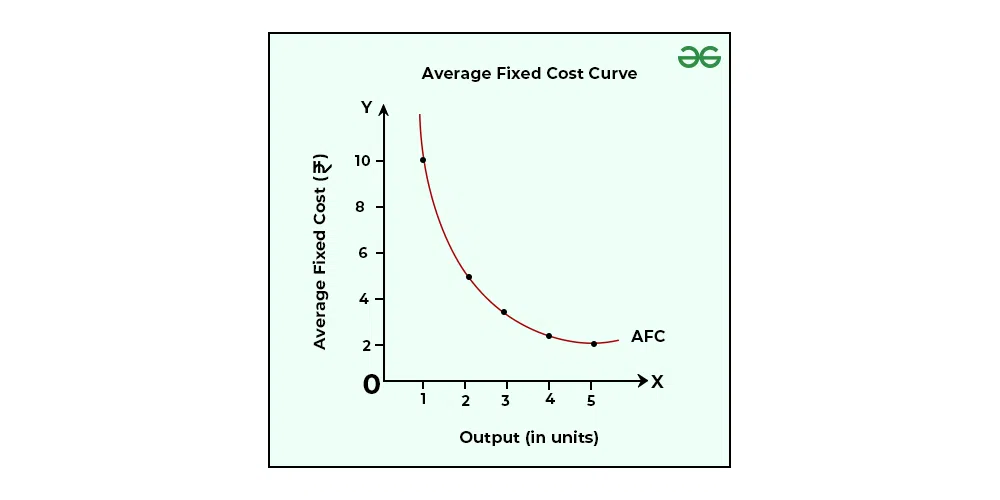
Average Fixed Cost
Fixed cost per unit of output
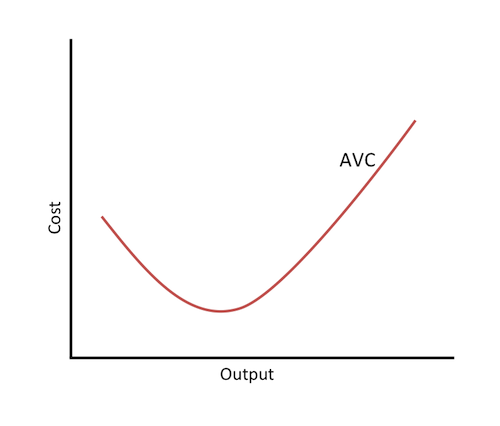
Average Variable
variable cost per unit of output
WHY IS ATC U-SHAPED
I. The spreading effect - the larger the output, the greater the quantity of output over which the fixed cost is spread, leading to a lower average fixed cost
II. The diminishing returns effect - the larger the output, the greater the amount of the variable input required to produce additional units, leading to a higher average variable cost
When output INCREASES,
average fixed costs decrease sooner average variable costs increase
Minimum Average Total Cost
Minimum cost Output: quantity of output at which your average total is lowest , The bottom of the TOTAL COST CURVE
If output < minimum-cost output, marginal cost is less than average total cost, and average total cost is falling (MC below ATC)
If output > minimum-cost output, marginal cost exceeds average total cost, and average total cost is rising (MC above ATC)
Average Product
the total product divided by the quantity of the input
Average Product Curve
shows the relationship between the average product and quantity of input
Long-Run Costs of Economies of Scale
shows the relationship between output and ATC, when fixed cost has been chosen to minimize average total cost for each level of output
LOWEST POINT IS WHERE YOU WANT TO BE AT, lowest costs
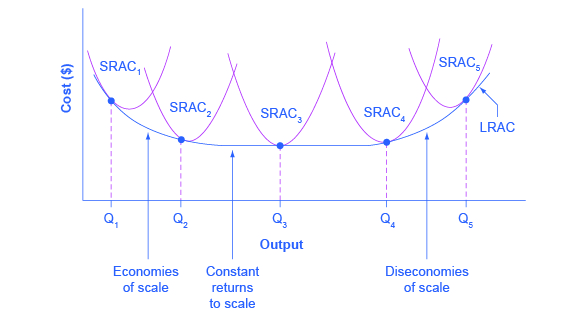
Economies of scale
when long-run average total cost decreasing as output increases
Diseconomies of scale
When long-run average total cost increases as output decreases
Constant returns to scale
When output increases directly in proportion to an increase in inputs
Sunk Costs
A cost that has already been incurred and is non-recoverable, should be ignored in future transactions