BUS 312 - CH 8
1/36
There's no tags or description
Looks like no tags are added yet.
Name | Mastery | Learn | Test | Matching | Spaced | Call with Kai |
|---|
No analytics yet
Send a link to your students to track their progress
37 Terms
Q: Which system would be used to track sales with each customer?
A: Customer Relationship Management System
Q: This computer standard allows an easy, automated exchange between a financial statement repository and a financial statement user.
A: XBRL
Q: EDGAR, the SEC repository of SEC forms, stands for ________.
A: Electronic Data Gathering, Analysis, and Retrieval system
Q: ________ includes information on active and inactive vendors and the orders made to date.
A: Supply chain system
Q: A graph displaying net sales over the past four years would result from which type of analytics?
A: Descriptive analytics
Q: Financial statements are an example of which kind of accounting data?
A: Financial accounting
Q: Which form is a required submission to the Securities and Exchange Commission on an annual basis?
A: 10-K
Q: What type of analytics would address the question of whether a bank should extend a loan to a potential borrower?
A: Predictive analytics
Q: Determining why a company's performance differs from its competitors is an example of what type of analytics?
A: Diagnostic analytics
Q: What prescriptive analytics technique would be used to determine if a similar decision should be made under varying assumptions?
A: Sensitivity analysis
Q: Which type of analytics includes time-series analysis techniques?
A: Predictive analytics
Q: A heat map like that used in sensitivity analysis is an example of what type of visualization?
A: Conditional formatting
Q: What kind of predictive analytics is generally used to forecast future sales, using its past sales?
A: Time-series analysis
Q: What type of analytics technique evaluates the percentage change in performance from one period to the next?
A: Horizontal analysis
Q: Which type of analytics would encompass compiling the financial statements?
A: Descriptive analytics
Q: Descriptive quantitative analytic measures of financial statements to help evaluate liquidity, solvency, profitability, and efficiency are called:
A: ratio analysis.
Q: Which type of analytics will summarize how much the company paid in federal taxes last year?
A: Descriptive analytics
Q: Which type of analytics will work to explain why the average amount of taxes paid changed from last year?
A: Diagnostic analytics
Q: Determining the best course of action under nine possible tax rate scenarios is an example of:
A: scenario analysis.
Q: Which prescriptive analytics technique determines the change in profit associated with the cost or benefit of the next, or marginal unit?
A: Marginal analysis
Q: Changes in consumer preferences, tax laws, interest rates, levels of risk, exchange rates, demand for employees and their expertise, etc. are all conditions a company regularly faces. Predicting and addressing these changing conditions requires what kind of analytics?
A: Prescriptive
Q: Which prescriptive analytics technique predicts how changing one input will affect an outcome variable?
A: Sensitivity analysis
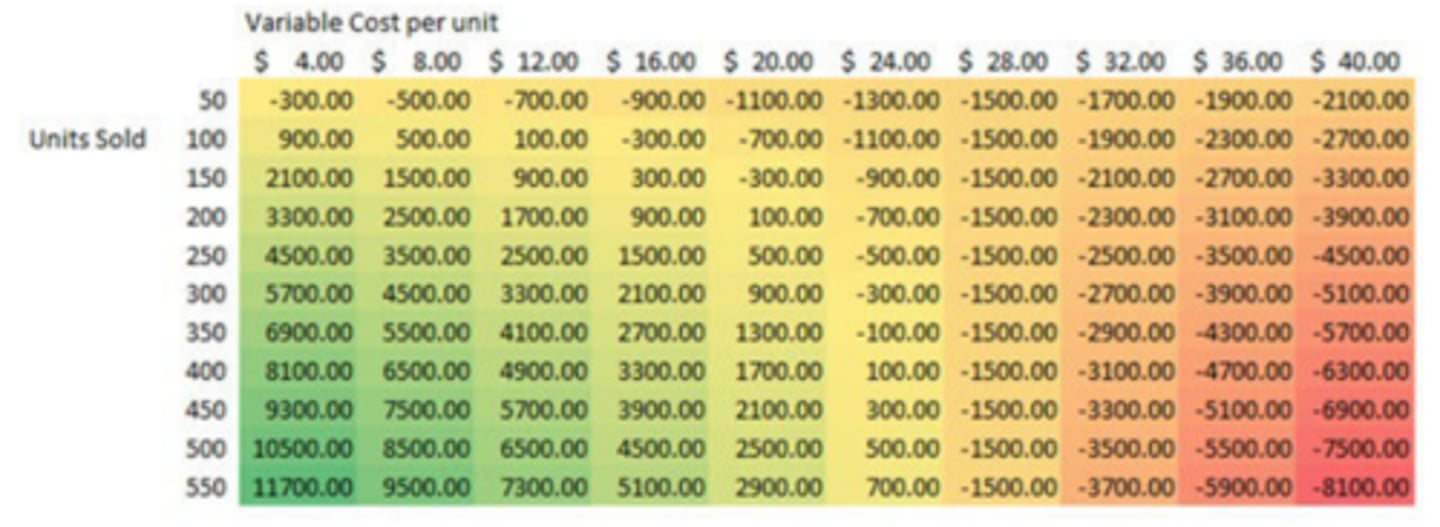
Q: This exhibit provides an example of a sensitivity analysis that might be performed by management accountants, evaluating the changing profitability based on two important inputs, the variable cost per unit and the number of units sold. To perform sensitivity analysis, the analysis varies the variable cost per unit from $4 to $40 (as shown in the columns) and the number of units sold from 50 to 550 (as shown in the rows). The colored columns are the total profits based on the changing input parameters. When combined with conditional formatting, the estimated profitability can be evaluated. All other things equal, as variable cost increases, what happens to the estimated profitability?
A: Estimated profitability decreases.
Q: This exhibit provides an example of a sensitivity analysis that might be performed by management accountants, evaluating the changing profitability based on two important inputs, the level of total fixed costs, and the sales price. To perform sensitivity analysis, the analysis varies the sales price from $35 to $53 (as shown in the columns) and the fixed costs from $500 to $3,000 (as shown in the rows). The colored columns are the total profits based on the changing input parameters. When combined with conditional formatting, the estimated profitability can be evaluated. All other things equal, as fixed costs decrease, what happens to the estimated profitability?
A: Estimated profitability increases.

Q: This exhibit provides an example of a sensitivity analysis that might be performed by management accountants, evaluating the changing profitability based on two important inputs, the level of total fixed costs, and the sales price. To perform sensitivity analysis, the analysis varies the sales price from $35 to $53 (as shown in the columns) and the fixed costs from $500 to $3,000 (as shown in the rows). The colored columns are the total profits based on the changing input parameters. When combined with conditional formatting, the estimated profitability can be evaluated. Which is more impactful on profitability, a $4 increase in sales price per unit or a $500 decrease in total fixed costs?
A: A $4 increase in sales price per unit
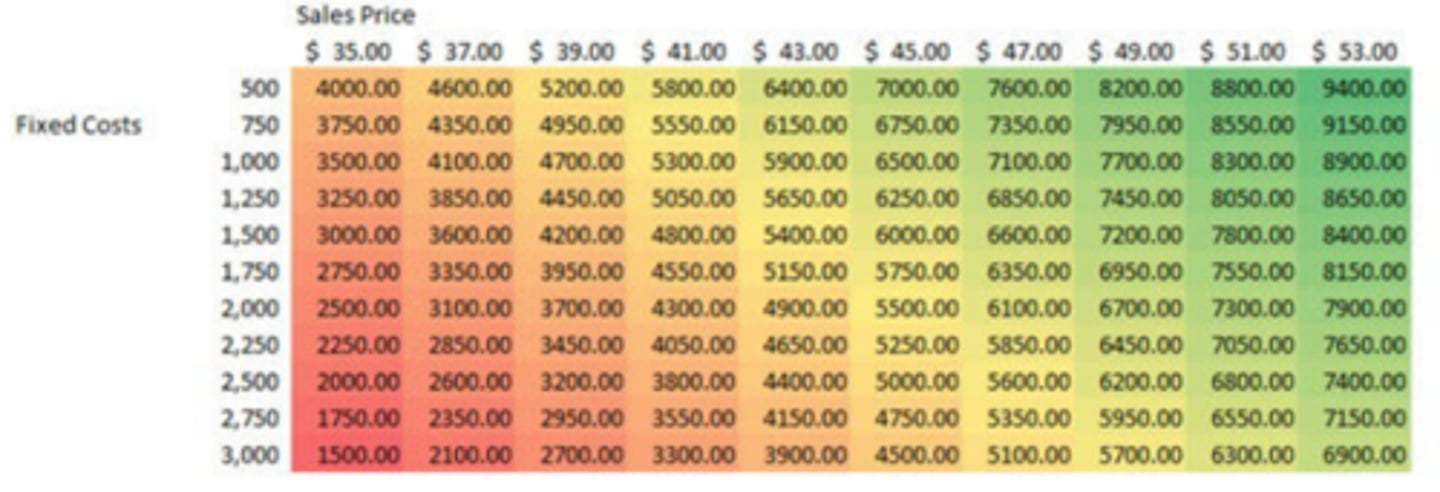
Q: This exhibit provides an example of a sensitivity analysis that might be performed by management accountants, evaluating the changing profitability based on two important inputs, the level of total fixed costs, and the sales price. To perform sensitivity analysis, the analysis varies the sales price from $35 to $53 (as shown in the columns) and the fixed costs from $500 to $3,000 (as shown in the rows). The colored columns are the total profits based on the changing input parameters. When combined with conditional formatting, the estimated profitability can be evaluated. All other things equal, a $6 increase in sales price per unit is associated with how big of a change in estimated profitability?
A: An $1,800 increase in estimated profitability

Q: This exhibit provides an example of a sensitivity analysis that might be performed by management accountants, evaluating the changing profitability based on two important inputs, the level of total fixed costs, and the sales price. To perform sensitivity analysis, the analysis varies the sales price from $35 to $53 (as shown in the columns) and the fixed costs from $500 to $3,000 (as shown in the rows). The colored columns are the total profits based on the changing input parameters. When combined with conditional formatting, the estimated profitability can be evaluated. What would you call this type of visualization?
A: Heat Map

Q: What is used as the record-keeping system to summarize individual transactions and journal entries to form the basis of financial statements?
A: General ledger
Q: Common-size financial statements are most similar to what type of descriptive analytics?
A: Vertical analysis
Q: Which accountant role evaluates if generally accepted accounting principles (GAAP) is applied correctly?
A: External auditor
Q: Which diagnostic analytics technique is used by management accounting to assess why amount spent on factory labor is different than the amount expected (or budgeted)?
A: Variance analysis
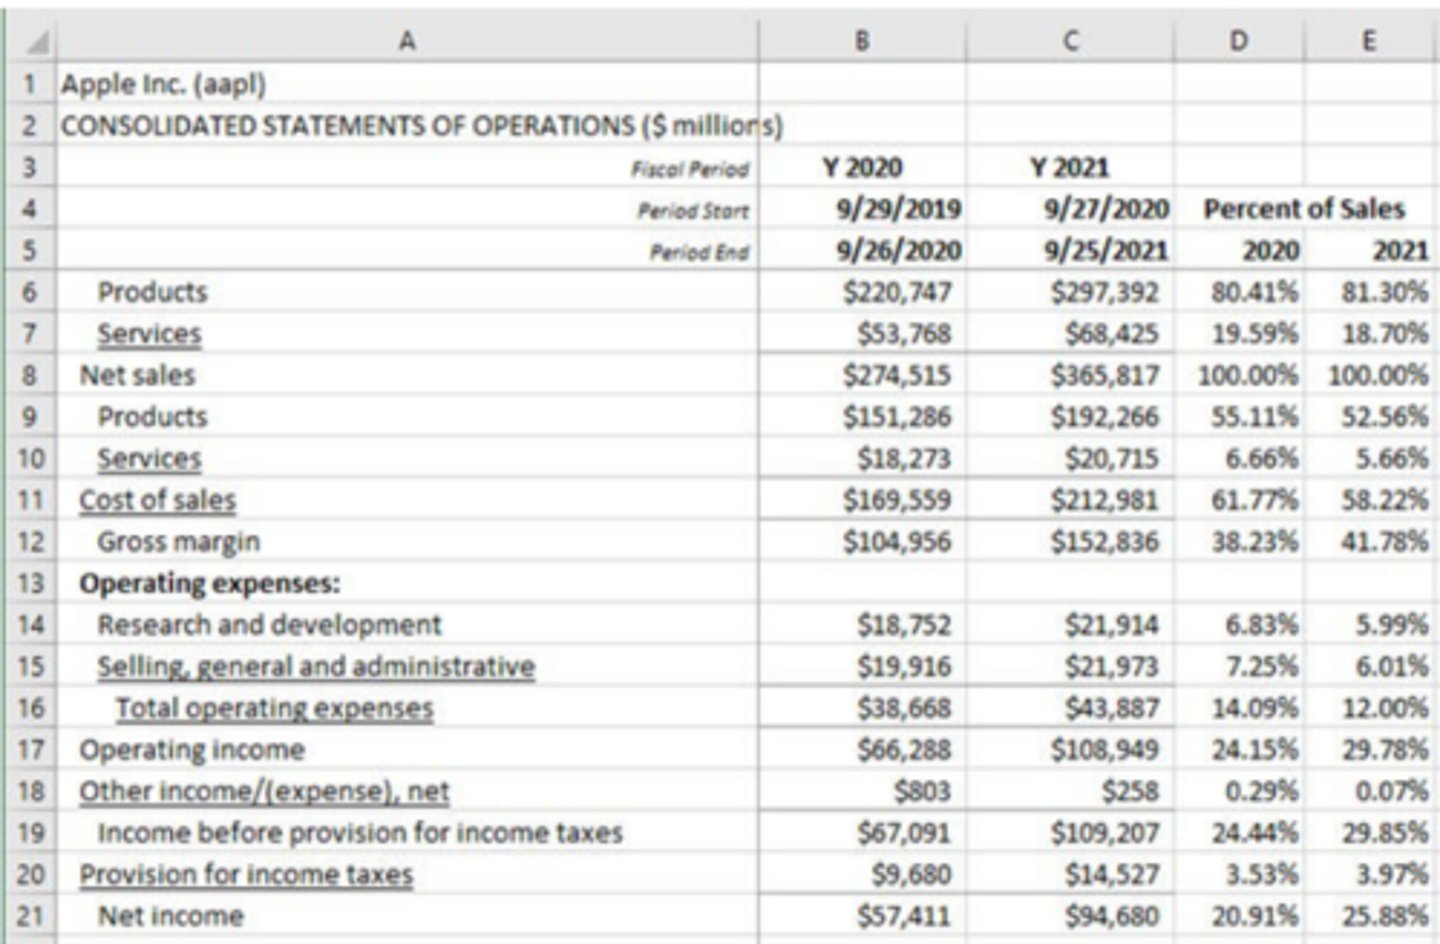
Q: Based on Lab 8.1 Excel, Descriptive Analytics: Using Horizontal Analysis to Assess the Financial Performance of Apple and Google. What is the Excel formula to determine the 34.7% percentage change in product sales from 2020 to 2021?
A: =D6÷B6
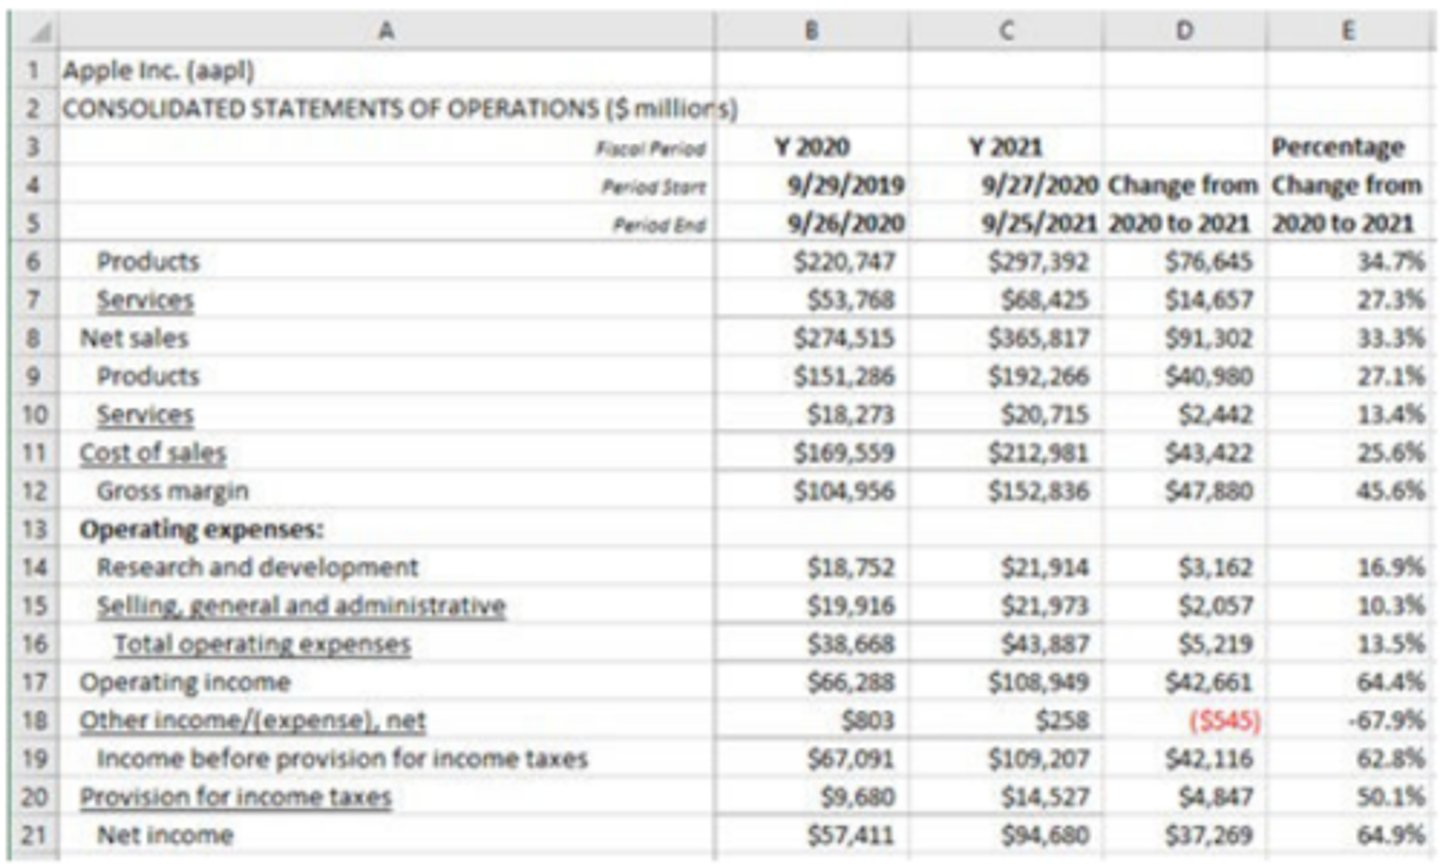
Q: Based on Lab 8.2 Excel Descriptive Analytics: Applying Vertical Analysis to Assess the Financial Performance of Apple and Google. What is the Excel formula to determine the 5.66% cost of services as a percent of net sales in 2021?
A: =C10÷C8
Q: Based on Lab 8.3 Excel, Diagnostic Analytics: Using Fuzzy Matching to Look for Fraud. In fuzzy matching, if the tolerance for a match is set to 100%, what is the likely consequence for finding potential matches?
A: Only exact matches, no potential matches
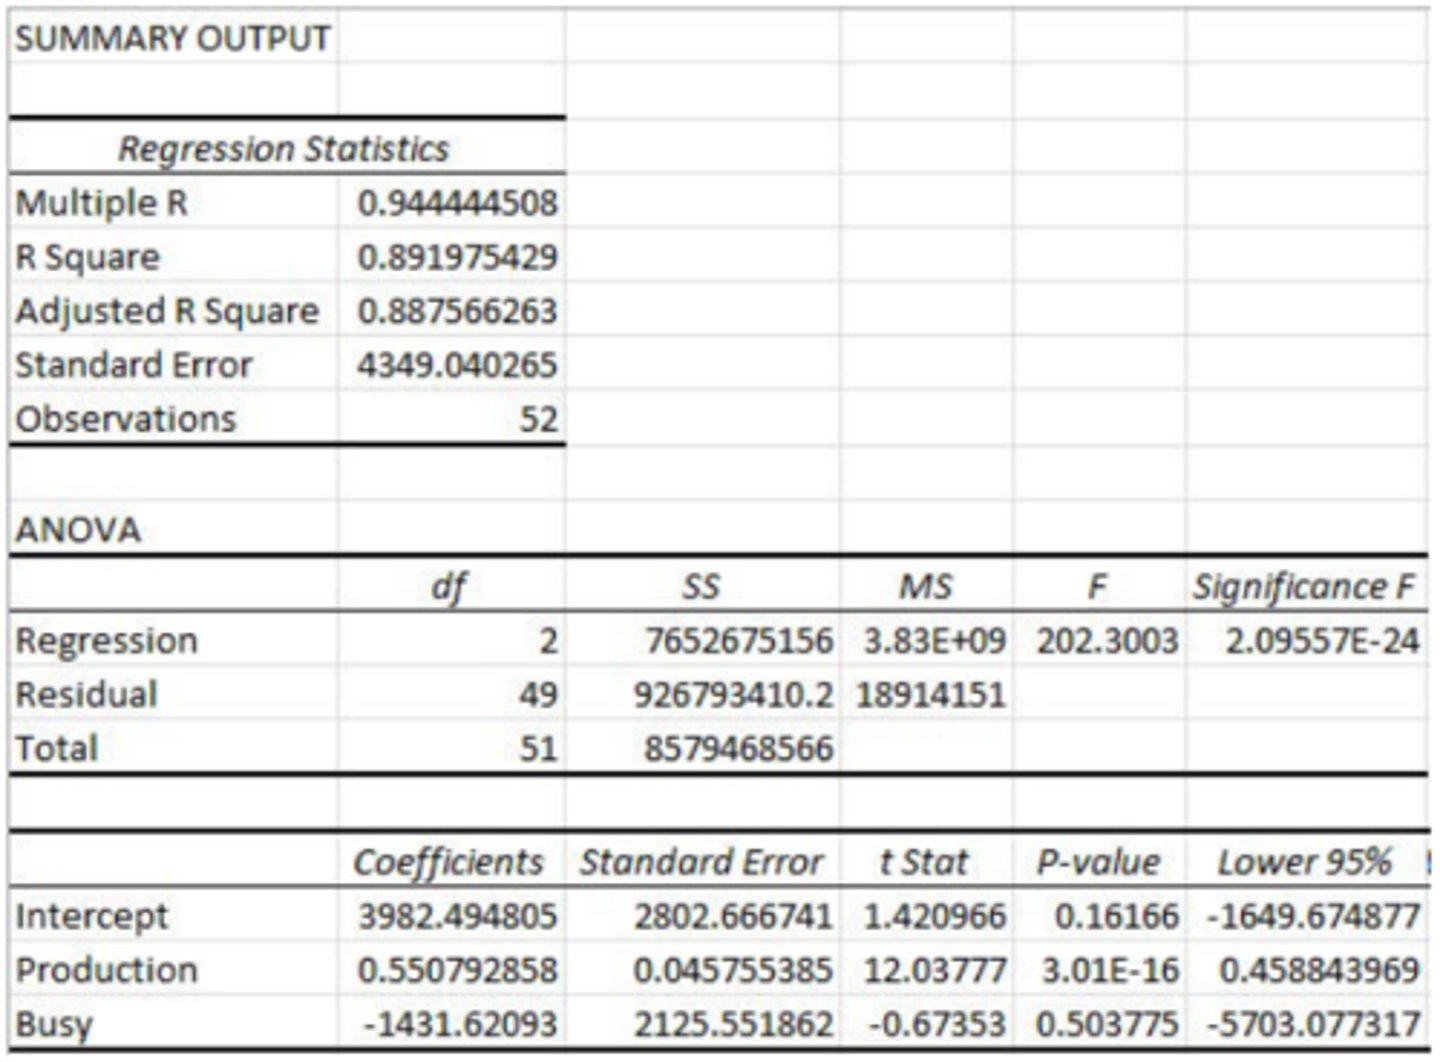
Q: Based on Lab 8.4 Excel, Diagnostic Analytics: Estimating Fixed and Variable Costs, given the regression results, which variables would be considered to be significant predictors of total costs.
A: Production
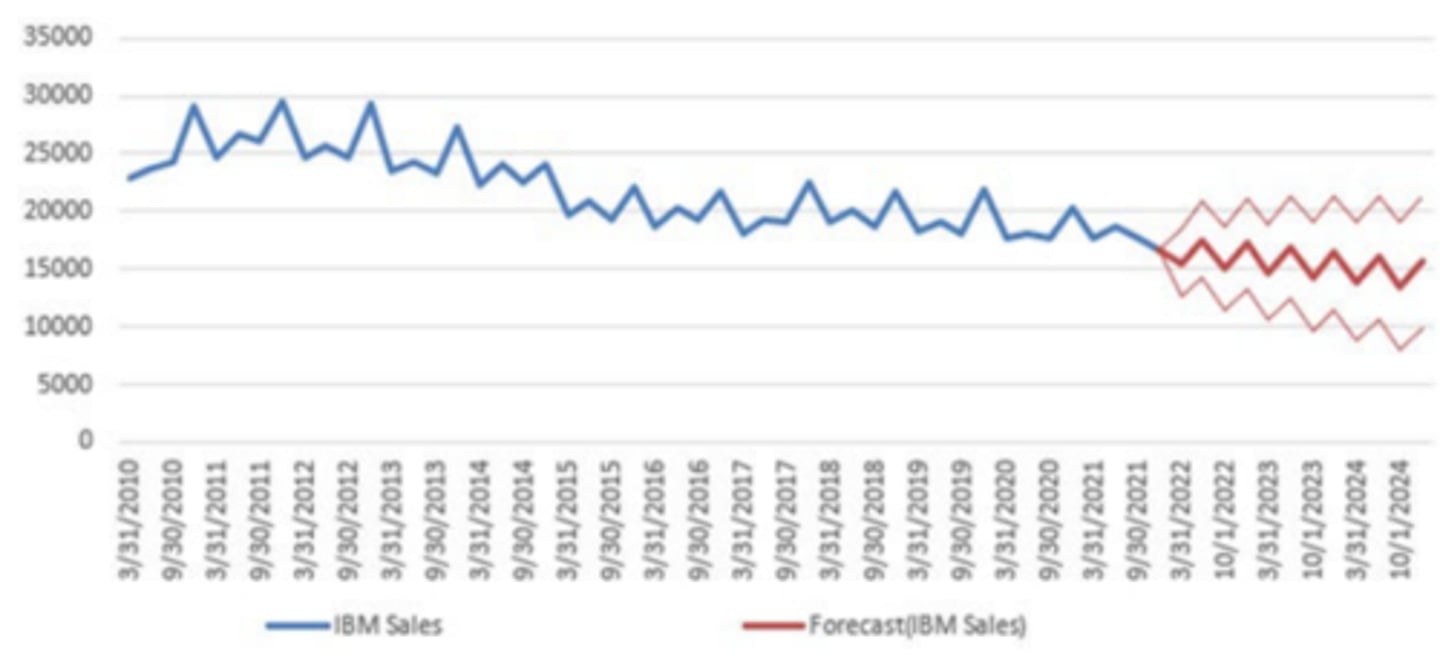
Q: Based on Lab 8.5 Excel, Predictive Analytics: Forecasting Future Performance of IBM, what is the red line above the forecast of IBM sales called?
A: Upper Confidence Bound
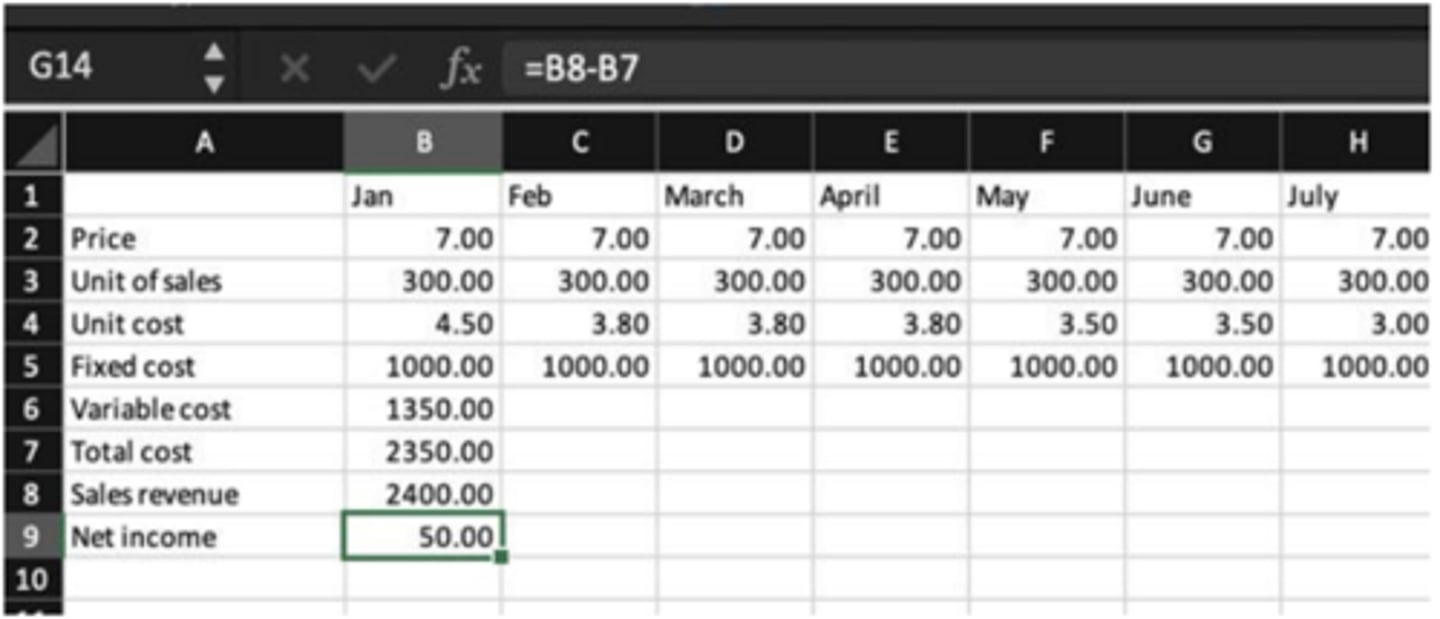
Q: Based on Lab 8.8 Excel, Using Goal-Seek Analysis to Determine the Break-even Point, for January which cell will be changed to get a value of zero net income (or breakeven)?
A: Cell B3