Bioinformatics and Statistics Quiz 1
1/18
There's no tags or description
Looks like no tags are added yet.
Name | Mastery | Learn | Test | Matching | Spaced | Call with Kai | Chat |
|---|
No analytics yet
Send a link to your students to track their progress
19 Terms
Statistics
branch of mathematics that involves collecting, analyzing, interpreting, presenting, and organizing data
tool for understanding and communicating info in datasets
for data driven decision making, variability understanding, id trends & patterns, ensure reliability
Statistics Purpose
summarize and meaningfully describe data
infer insights & make prediction on populations from sample data
guide decision making from evidence
Descriptive Stats
summarize data and describe main features, central tendency & variation, histograms, box plots
purpose: simplify large datasets into understandable metrics, id trends, patterns, variability
Inferential Stats
use sample data to make generalizations about a population
Data Types
Nominal - qualitative, non-hierarchical (blood type)
Ordinal - qualitative, hierarchical (pain on 1-10 scale)
Discrete - quantitative, discontinuous numbers (heart rate)
Continuous - quantitative, numerical, can be measured infinitely (weight)
Measures of Central Tendency
mean, median, mode
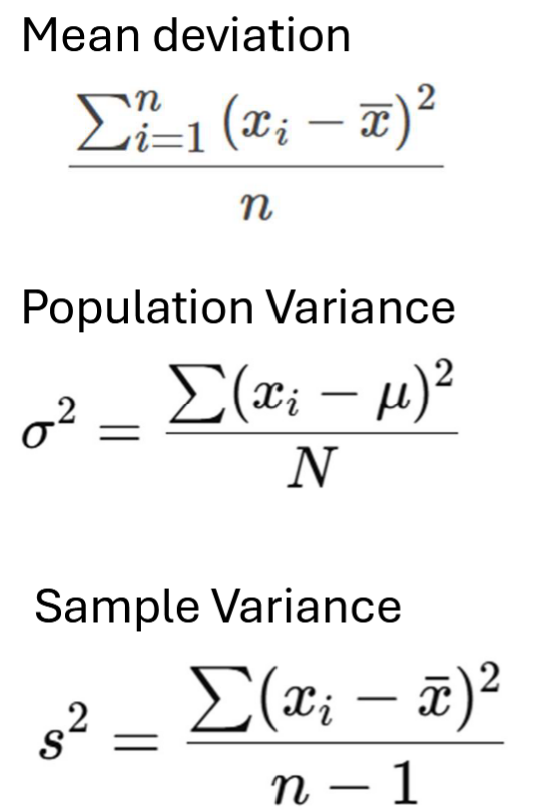
Measures of Dispersion
range, variance, standard deviation, quantiles, coefficient of variation
Biostatistics
application of stat principles to biology, specifically in medical and health studies. essential for experiment design, data analysis, drawing valid conclusions
roles: quantify & interpret variability in data; ensure reliable, reproducible, scientifically valid findings; guide decision making in clinical trials, epidemiology, & public health
Biostats Answering Scientific Questions
Formulate Question - define problem/hypothesis
Design Study - study type, sample size and randomization
Collect data - accurate & reliable data
Interpret Results - determine implications of findings
Communicate Findings - present results, graphs, tables, reports
Stats Ethical Considerations
Integrity & Accuracy: remove bias
Transparency: clearly report methods and limits
Informed Consent: ensure participants are fully informed and agree to data collection
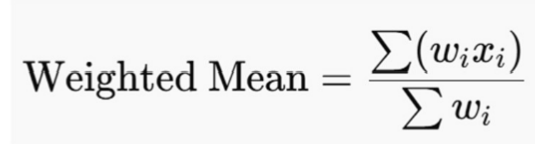
Weighted Mean
assigns dif weights to dif values, applicable when some data points contribute more than others
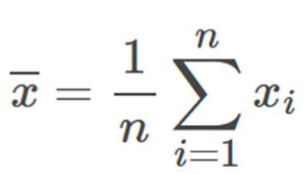
Mean
used for normally distributed continuous data, comparing overall trends
Adv. easy to calculate & understand uses all data and best for symmetrical
Disadv. sensitive to outliers, not useful for skewed
Median
used for skewed or ordinal data, income/housing prices
Adv. not effected by outliers, more representative for skewed distributions, good for ordinal
Disadv. ignores exact values, less useful for normal distributions
Mode
used for categorical data, id common values, multimodal data
adv. categorical data, simple and easy to understand, multimodal
disadv. may not exist or be unique, not useful for continuous
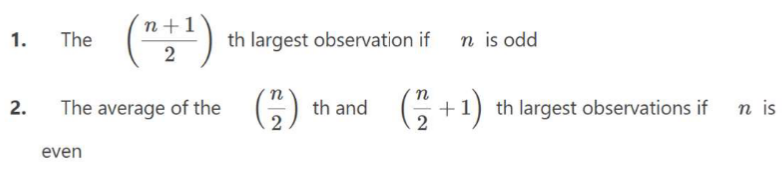
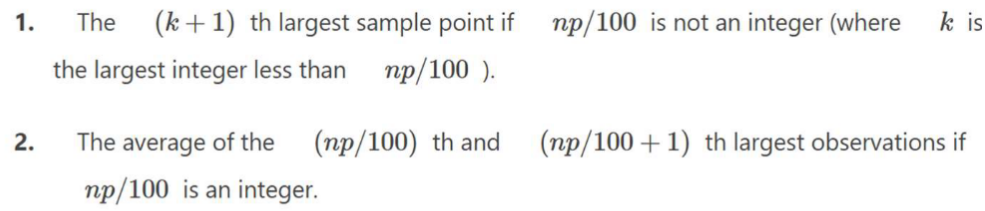
Quantiles
the pth percentile is the value Vp such that p percent of the sample points are less than or equal to Vp
req ordered data sets
Coefficient of Variation
CV = standard deviation / mean * 100%
comparing variability of several different samples with different means
Visualization Tools
Box/Whisker plots - range, median, IQR, highlights outliers
Scatter plots - displays relationship btwn two cont. variables
Bar charts - rep categorical data with rectangular bars proportional to their frequency
Histogram - graphical rep of the frequency distribution of a dataset
Descriptive Stats Applications
Clinical Trials: demographics, data analysis
Epidemiology: analyze disease incidence rates
Public Health: assess impact of health interventions
Medical Device Testing: ensure reliability through variance measurements
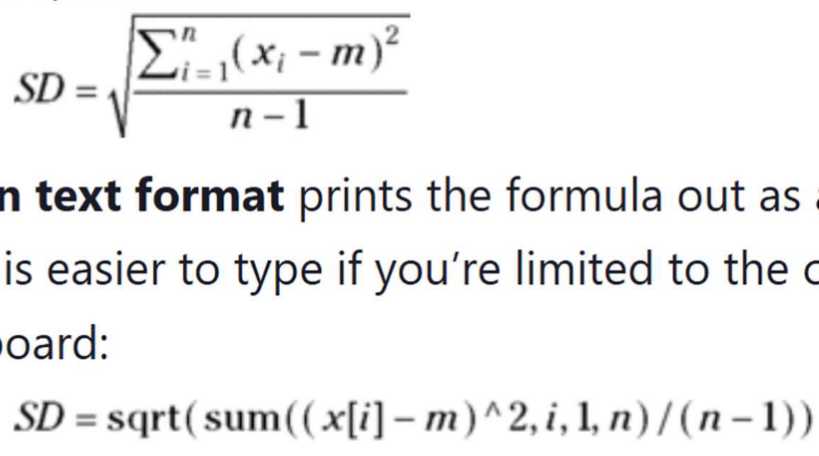
Type Set vs. Plain Text
typeset - uses special symbols, 2D structure, what you would write
plain text - single line, typed characters only