FINC Stmt Analysis Unit 4
1/48
Earn XP
Description and Tags
Liquidity and Efficiency Analysis
Name | Mastery | Learn | Test | Matching | Spaced | Call with Kai |
|---|
No analytics yet
Send a link to your students to track their progress
49 Terms
What is liquidity analysis?
The ability of a company to convert resources into cash to fulfill its short-term payments
What kind of relationship is there between profitability and liquidity?
inverse
What is the most liquid asset?
cash
If you want to maximize your liquidity you should have:
total assets = cash and equivalents
If you want to maximize profitability you need
to invest in fixed assets and a higher proportion of non-current assets which = lower liquidity
Working capital formula
Current Assets - Current Liabilities
What does a positive working capital mean?
The company has enough to fulfill its short-term obligations
Current Ratio formula
Current Assets/Current Liabilities
What does current ratio measure?
Whether the company has enough short-term assets to cover short-term debt
Do you want a high current ratio?
Yes
Why might current ratio lead to the wrong decisions/analysis over liquidity?
Some assets classified as ‘current’ are not easily transferred into cash (inventories)
What is the acid-test or quick ratio used for?
measuring whether the company can pay short-term debt without selling inventory
Acid-test/quick ratio formula
(Current Assets-Inventory)/Current Liabilities
Cash ratio interpretation
Expresses how many times a company can repay short-term creditors/current liabilities with its total cash
Cash ratio formula
Cash and cash equivalents/current liabilities
Cash to Current Assets or Liquidity Ratio interpretation
Which portion of the current assets is cash/available immediately
Cash to current assets ratio formula
Cash and cash equivalents/Current assets
What do efficiency ratios measure?
how well the company is using and managing its assets and liabilities internally
When efficiency increases how does profitability change?
it increases as well
Asset turnover ratio interpretation
measures the company’s efficiency in managing assets to generate sales
Asset Turnover formula
Total net sales/Total Assets
What could a high Asset Turnover Ratio mean?
The company has a high efficiency regarding asset use or the company is close to its total production capacity
What is the ROA formula that uses Asset Turnover ratio
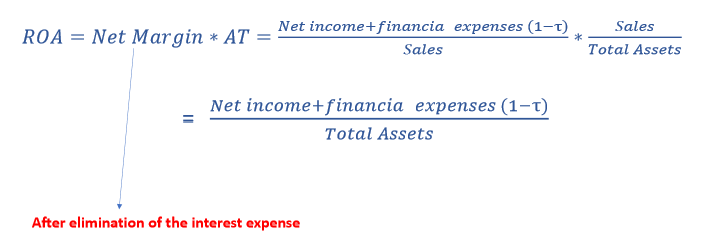
Should you compare ROA of firms from different sectors?
no
Inventory turnover ratio interpretation
How many times the inventory have been replaced between t and t-1
*measures how efficiently a firm manages inventory
Inventory turnover formula
Salest/Average Inventory
Collection period interpretation
Average credit period offered to customers
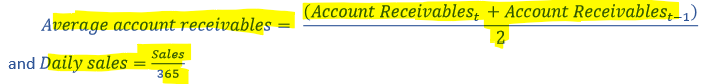
Collection period formula
Average account receivables/daily sales
Average accounts receivables and daily sales formulas
Creditors turnover ratio interpretation
average credit period enjoyed from the creditors (# of days suppliers give us to repay them); high value = better credit conditions
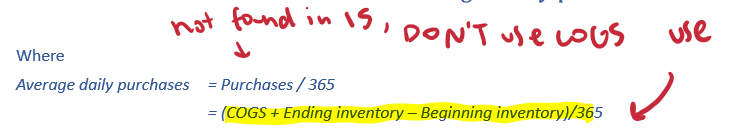
Average credit (payment) period formula
average accounts payables/average daily purchases
Average daily purchases formula
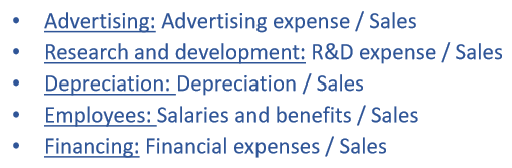
Cost structure ratios interpretation
gives an overview of the necessary costs to achieve sales
Are cost structure ratios industry-specific?
Yes
What are the five ratios and their formulas?
Statement of Cash flow reports what?
cash generated and spent during a specific period of time
What are the three different sources of cash-flows?
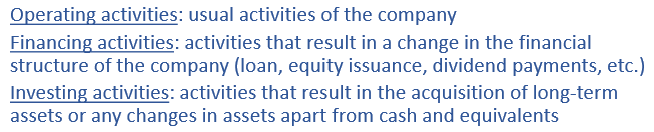
What are the two ways to present and calculate operating cash-flow
Direct method: each category (operating, financing, investing) is presented individually and summed up
Indirect method: Starting from the net income, reconciliation is provided between profit and operating cash flow
Using the 2023 Airbus data (Annex), determine the exact value of Working Capital
Current assets - current liabilities
Negative (~ -6B to -8B)
A negative Cash Conversion Cycle (CCC) is most sustainable for which type of business model?
A negative Cash Conversion Cycle (CCC) is most sustainable for which type of business model?
A retailer/manufacturer with high bargaining power over suppliers and fast inventory turnover
Why might the Current Ratio rise while the company's liquidity position actually deteriorates?
Inventory is building up due to obsolescence (numerator increases but liquidity drops)
The 'Defensive Interval Ratio' measures:
How many days the company can operate using only its liquid assets without new revenue
If Days Sales Outstanding (DSO) increases significantly while Sales are flat, what is the most likely operational root cause?
Credit terms have been relaxed or customers are struggling to pay
Calculate the 'Days Sales Outstanding' (DSO) for 2023.
Approx 35-40 days
Calculate the 'Days Payable Outstanding' (DPO) for 2023 using Cost of Sales
Average AP/Average Daily Purchases
Average Daily Purchases = (COGS + EI - BI)/365
DPO = ((14,323+13,261)/2) / ((55,402+33,741-32,202)/365) = 88.41 days
Approx 85-95 days
Calculate the 'Inventory Days' (DIO) for 2023
Average Inventory/Average Daily Purchases
Average Daily Purchases = (COGS + EI - BI)/365
DIO = ((33,741+32,202)/2) / ((55,402+33,741-32,202)/365) = 211.35 days
Approx 200-220 days
Combine the previous results to estimate the Cash Conversion Cycle
(DIO + DSO - DPO)
Approx 160-170 days
Calculate the difference between the Current Ratio and the Quick Ratio in 2023. What does this gap represent?
The illiquid portion of current assets (Inventory)