SRAS and Phillips curve
1/14
There's no tags or description
Looks like no tags are added yet.
Name | Mastery | Learn | Test | Matching | Spaced | Call with Kai |
|---|
No analytics yet
Send a link to your students to track their progress
15 Terms
Sticky price firms/model and upward sloping SRAS
Firms don’t adjust prices INSTANTLY when demand changes, because of e.g. long-term contracts between firms/customers, desire to avoid annoying customers with frequent price changes, expense of changing price lists, labels etc.
Announce prices in advance based on expectations - can often influence flexible-price firms so often what they do will ACTUALLY happen regardless of how many firms are sticky
Model implies that actual price level depends on expected price level and the level of output relative to its natural level - and higher than expected prices are associated with higher output in the S.R. → upward sloping
Flexible price firms
Can adjust prices whenever conditions change, set prices based on ACTUAL price level and CURRENT level of national income
Imperfect information model and upward sloping SRAS
Suppliers sometimes misunderstand what a price change means and adjust output in response - suppliers can confuse changes in overall price level with changes in the relative price of their own good and these misperceptions create a positive relationship between the overall price level and output in the short run - when overall price level rise unexpectedly suppliers observe a higher price for their own product but mistakenly infer the relative price of their good has increased so work harder and increase output - but the relative price of their goods has ACTUALLY NOT changed.
SRAS line
Y = Y bar + \alpha (P - Pe)
where Y bar is the natural rate of output and Pe is the expected price level
Curve drawn for a given Pe so a change in Pe would shift the curve.
Phillips curve equation
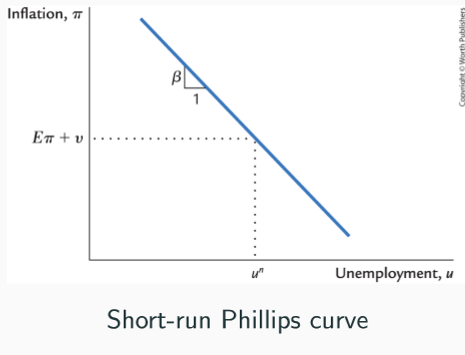
π = πe − β(u − un) + ν
Inflation = expected inflation - β(cyclical unemployment) + (supply shock)
Unemployment is related to unexpected movements in the inflation rate
Minus sign in front of cyclical unemployment term means other things equal, higher unemployment is associated with lower inflation
Phillips curve
Short-run trade off between inflation and unemployment
When unemployment is at its natural rate inflation depends on expected inflation and the supply shock
Non-accelerating inflation rate of unemployment
Used to determine the lowest rate of unemployment that can be sustained without causing wages growth and inflation to rise
e.g. if level of unemployment falls below NAIRU then inflation likely to occur as higher employment = higher incomes = higher demand for G/S - higher output/GDP - inflation
Adaptive expectations
People form expectations based on recently observed inflation, so Phillips curve would be written as: π = π-1 − β(u − un) + ν
The term π-1 implies inflation exhibits inertia
Inflation - intertia
Inflation keeps going unless something acts to STOP it.
Because past inflation influences expected future inflation AND expected inflation influences wages and prices people set
Cyclical unemployment - inflation
Low unemployment pulls inflation rate up - DEMAND PULL inflation, because high AD is typically responsible
Supply shocks - inflation
Adverse supply shock implies a +ve value of v and causes inflation to rise - COST PUSH inflation because it will push up production costs e.g. natural disaster destroying crops producers need
Sacrifice ratio
Measures the cost of higher unemployment and lower output that typically needs to occur in order to reduce inflation
Ratio approx. 5: to cut inflation by 1 percentage point about 5% of one year’s real GDP is lost
Using Okun’s law this implies about 2.5 percentage points of cyclical unemployment for each 1 percentage point fall in inflation
Example: reducing inflation by 4% points costs either 20% of one year’s GDP or 10% points of cyclical unemployment
Painless disinflation
Possible if disinflation plan announced before expectations are formed and the announcement is believed - credibility and expectations do actually influence inflation
Anchored expectations
Inflation expectations depend on policy environment as well NOT just recent inflation so e.g. if central bank consistently delivers inflation targets and it’s stable inflation πe becomes πA and inflation is no longer inertial but this requires credibility and confidence in the central bank
π = πA − β(u − un) + ν
Hysteresis
Event that persists into the future even after factors that caused it have been removed
e.g. AD may affect output and employment even in the long run, as recessions can leave permanent scars, e.g. unemployed workers may lose skills/change attitudes to work.