AP Statistics Exam Review
1/113
There's no tags or description
Looks like no tags are added yet.
Name | Mastery | Learn | Test | Matching | Spaced |
|---|
No study sessions yet.
114 Terms
What is a dotplot?
A graphical display which shows "dots" for each point. It's good for categorical data- ie data classified into categories.
What's the difference between categorical and quantitative data?
Categorical data fits into various categories; whereas, quantitative data has numerical values associated with it.
What is a bar chart?
A display for categorical data which indicates frequencies or percents for each category.
What are histograms?
Histograms are good for large quantitative data sets- either having numbers at the left/right of a bar to show the amount of data in-between each value or in the center of a bar to show the amount of data at a certain value. Sometimes, the axis will just be the frequency, but often, it can be the relative frequency (ie. amount/total).
What do relative areas in histograms mean?
Relative areas correspond to relative frequencies (ie. if 10% of the area for a histogram is between 25-26, that means that 10% of the data falls between 25 and 26.
What's a stemplot/stem and leaf plot?
It has stems which are some digit and leaves which are the other part of the number (for example depending on context 5|7 could be 57, 5.7, or some other variant- that's why a key must always be included). It's good for looking at individual data in small data sets.
What is important in analyzing visual data displays?
SOCS (Shape, Outlier, Center, Spread):
Shape-How is the data shaped (skewed left/right, symmetric, bimodal, etc.)? Are there any clusters (subgroups which the data falls into)? Are there any gaps in the data set?
Outliers: Are there any outliers within the data set?
Center: Give the mean/median- the value which is the approximate midpoint of the data
Spread- What is the range OR IQR (if it's easy to find) of the data set?
What is a mode? How do modes relate to unimodal/bimodal data sets?
A mode is a major peak in the data (most repeated value). A unimodal data set has just one mode; whereas, a bimodal data set has two modes.
What are some possible descriptions of shapes within distributions?
Symmetric- There is a vertical line of symmetry, splitting the graph into two equal parts.
Skewed Right- Data decreases for higher values/has less area for higher values
Skewed Left- Data slopes upwards from the left (less area for lower values).
Bell shaped- symmetric with a center mound and tails going to the left/right.
Uniform- Straight line across/data distribution stays constant.
What is a cumulative relative frequency plot (or ogive), and how does it relate to skewness?
A CRF plot shows the percentage of data accumulated along the y axis by each value of the data along the x. For instance, (10,0.15) would mean that 15% of the data is less than or equal to 10.
A distribution skewed to the left has a frequency plot which rises slowly at first and steeply later; whereas, a distributions skewed to the right has a relative frequency plot rising quickly at first and then slowing down later.
What's the difference between descriptive statistics and statistical analysis?
Descriptive statistics means summarizing averages, shape of a distribution, etc. while statistical analysis means drawing inferences from limited data.
What are the two main ways of measuring center?
The median (the middle number of a set when arranged in order).
The mean (summing the values in a set and dividing by the number of quantities in that set)
When does it make more sense to use the median over the mean?
When there are outliers which we want to minimize. We say the median is RESISTANT to outliers (which means it's not affected).
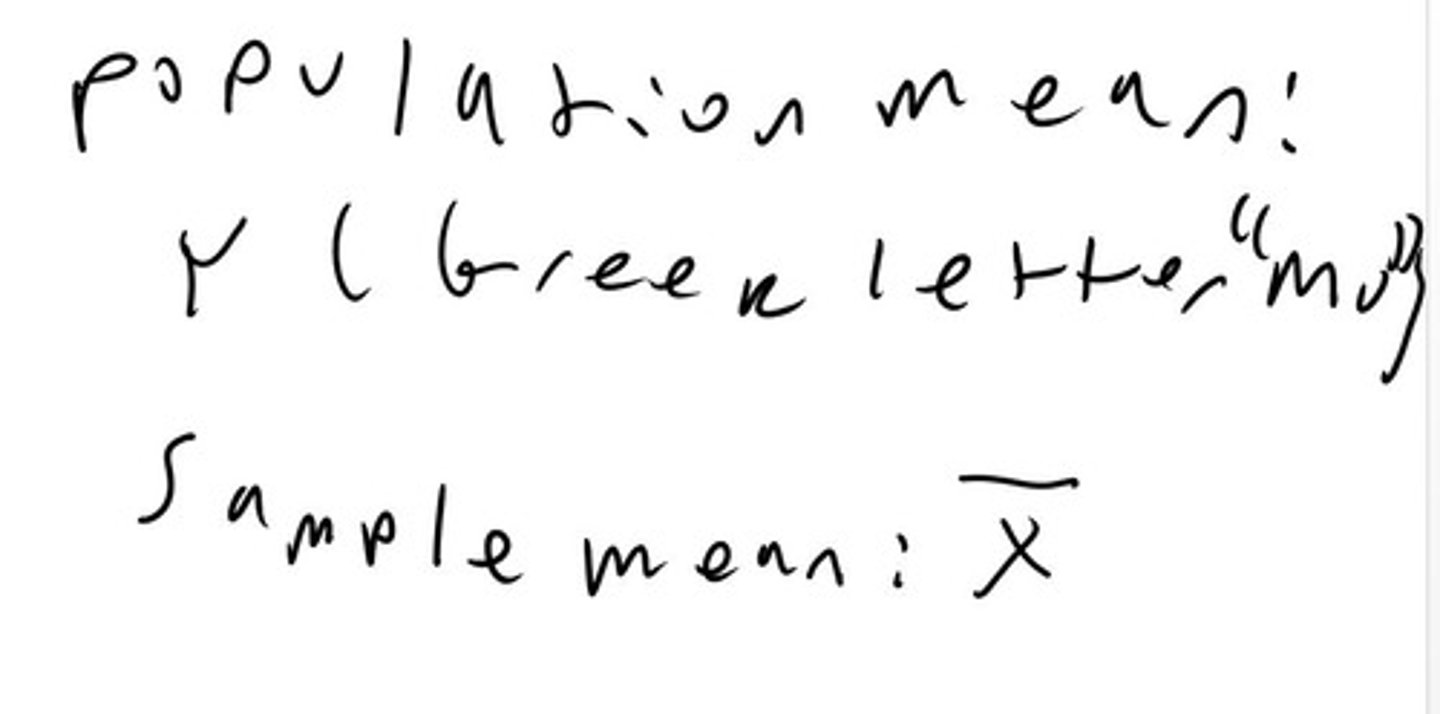
What are the notations for mean of a population and mean of a sample?
The sample mean usually assumes a simple random sample. The mean is computed by ∑x/n.
What are the ways of describing variability/dispersion of the measurements?
1) Range - difference between largest and smallest values.
2) IQR- difference between largest and smallest values after removing lower and upper quarters.
There are two ways of computing this : way 1) simply take out upper and lower quarters of the data and subtract.
2) Find Q1 by taking the median of the lower half and Q3 by the median of the upper half (median itself must be included if there are an odd number of points). Then do Q3-Q1 to get the IQR. These should be equivalent if there are many data points.
3) Variance- an average of squared distances from the mean
4) Standard deviation- square root of the variance
What is the rule for designating outliers?
Outliers are considered to be any value above Q3+1.5IQR
OR
any value below Q1-1.5IQR
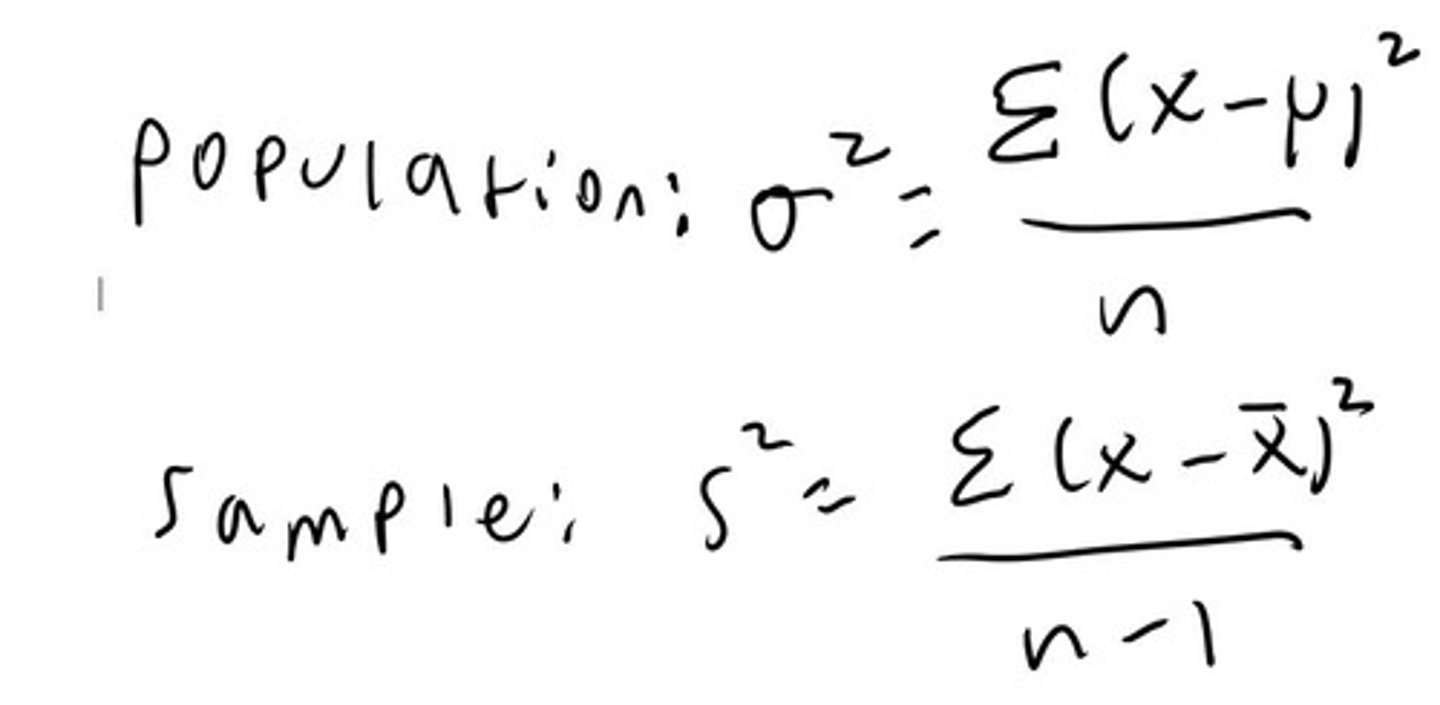
How is the variance calculated for a population?How is it calculated for a sample?
So for a population you sum up all of the squares of the deviations from the mean and divide by the number of terms. You do the same thing for a sample but divide by number of terms-1 due to degrees of freedom.
How do you calculate the standard deviation?
Take the square root of the variance. The standard deviation shows how far values vary from the mean on average.
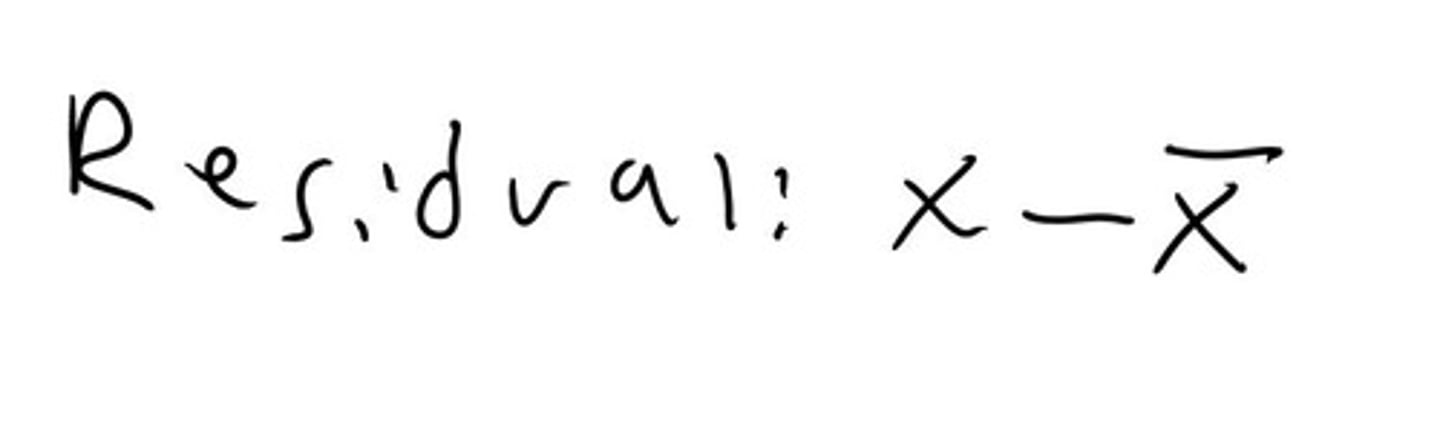
What is a residual?
It is simply each value-the mean.
What are the three main ways of measuring position?
1) Simple ranking- arrange the elements and note where each value falls in that order.
2) Percentile ranking- the percentage of values falling below yours (ie. number below your value/total).
3)z-score- how many standard deviations a value is away from the mean.
Where do the quartiles and deciles lie in terms of percentile ranking?
Q1 has a percentile rank of 25% and Q3 has a percentile rank of 75%.
The deciles have ranks of 10% and 90%.
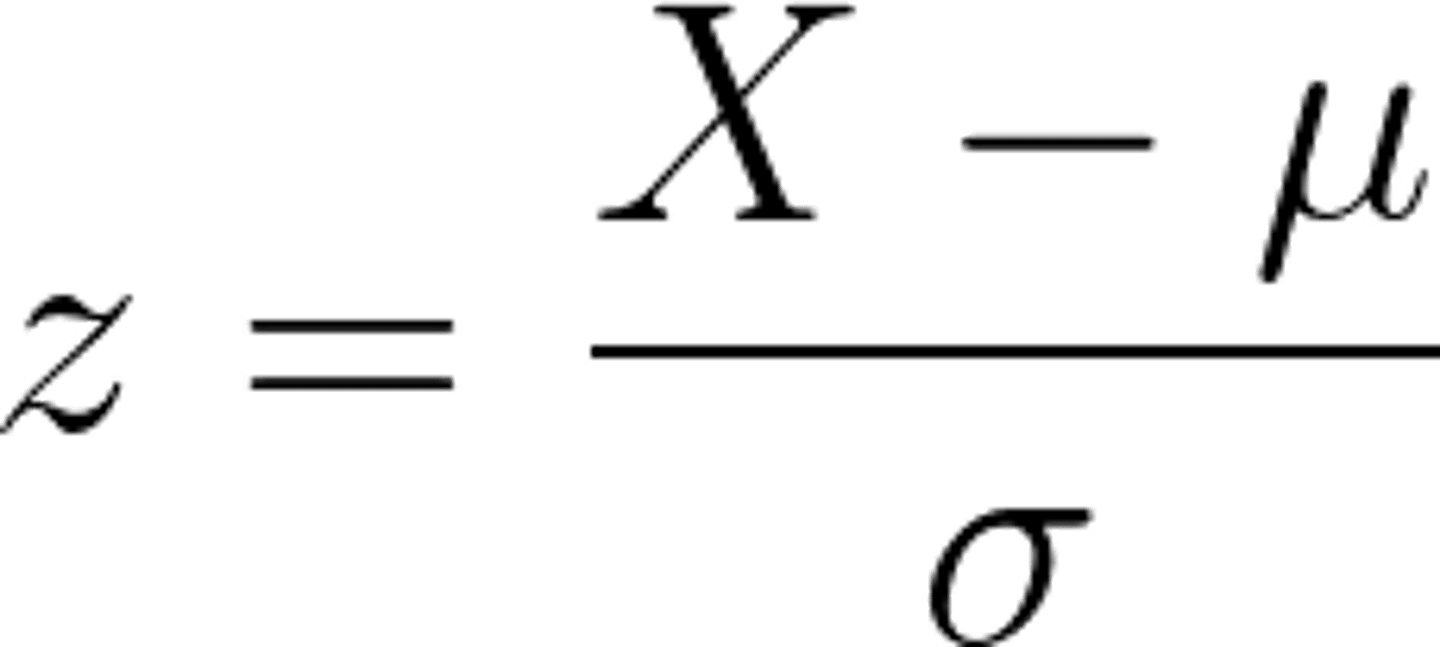
What is the formula for a z score?
This shows the number of standard deviations away from the mean. Also, if you're given a z score, the mean, and the standard deviation, you can solve for an x value.
What is the empirical rule?
The empirical rule says that for symmetric, bell-shaped data, 68% of the data lies within one standard deviation of the mean, 95% lies within 2 standard deviations of the mean, and 99.7% of the data lies within 3 standard deviations of the mean.
How is the empirical rule related to range?
The empirical rule can indicate arithmetic errors as the range should be somewhere between 4 times the standard deviation and 6 times the standard deviation.
How does skewed data affect how the mean compares to the median?
If data is skewed to the left, the mean is usually lower than the median.
If data is skewed to the right, the mean is usually higher than the median.
What is a boxplot?
It gives a 5 number summary with a whisker out to the highest value, a line at Q3, a line for the median, a line at Q1, and a line out to the lowest value.
Alternatively, outliers can be depicted as dots on the boxplot, and the lines just go to the highest/lowest values not considered to be outliers.
What is the effect on mean, median, range, and standard deviation of adding a certain amount or multiplying by a certain amount to every value in the data set?
Adding: Changes the mean & median by that amount but doesn't change the range or standard deviation.
Multiplying: Changes mean, median, range, and standard deviation all by that same factor.
What are some graphical methods of comparing distributions?
1) Dotplots either above or next to each other for each distribution.
2)Double barcharts with bars next to each other to make the comparison.
3) Back to back stemplots with leaves going out to either side
4) Parallel boxplots with boxplots stacked on top of or next to one another
5) Cumulative frequency plots with both plots running next to one another.
What is bivariate data?
Data that explores the relationship between two variables (x & y)
What is a scatterplot?
A scatterplot shows (x,y) ordered pairs and helps to give a visual indication of the relationship between the two variables. One can see whether the variables are positively or negatively associated. Also, sometimes scatterplots might be labeled with some markings to show one category and some to show another (dots for men, x's for women, etc.). Clusters and outliers ought to be noed in scatterplot analysis.
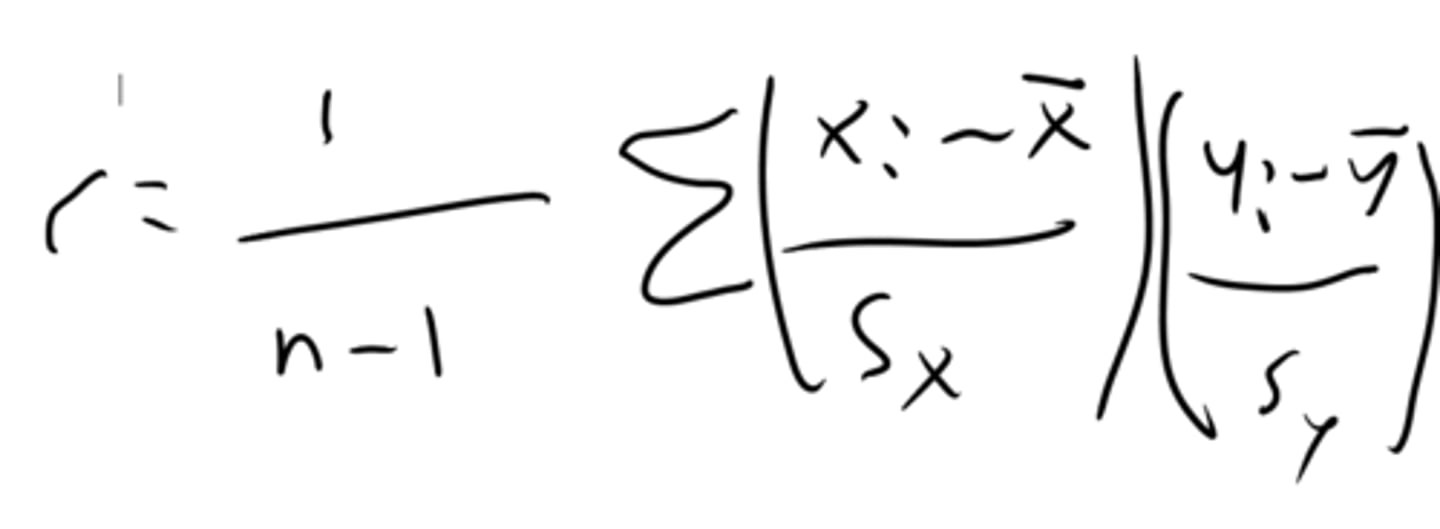
What is the correlation coefficient r?
It describes how well the data fits a linear trend. A positive r means a positive association, a negative r means a negative association and r's with higher absolute values indicate stronger relationships. r is not affected by which variable is called x or called y, and an r of 0 doesn't necessarily indicate no relationship (it could be a strong nonlinear relationship). The formula is the sum of the product of all x and y z scores divided by the sample size-1.
What is r²?
r² is called the coefficient of determination and gives the percentage of variation in y explained by x. One must be careful when finding r from r² in terms of assigning positive/negative values.
What is the least squares regression line?
It's the line that is the best fitting as it minimizes the squares of the residuals. It's equation can be determined as it goes through the mean of x (x bar) and the mean of y (y bar). The slope is determined by b1=r *(sy/sx) where sy is the standard deviation of y, and sx is the standard deviation of x.
What is the equation for the line comparing z scores of y to z scores of x?
zy=rzx
What's the difference between interpolation and extrapolation?
Interpolation is inside the scope of your data range which is good.
Extrapolation is outside your data set and is risky as you don't know whether the linear trend will continue.
What does y hat really indicate?
The mean prediction for each x value (there could be a variety of y values, so it simply gives the mean)
What is a residual plot?
Observed-expected value gives the residuals. A residual plot gives the residuals on the y axis and the x values on the x.
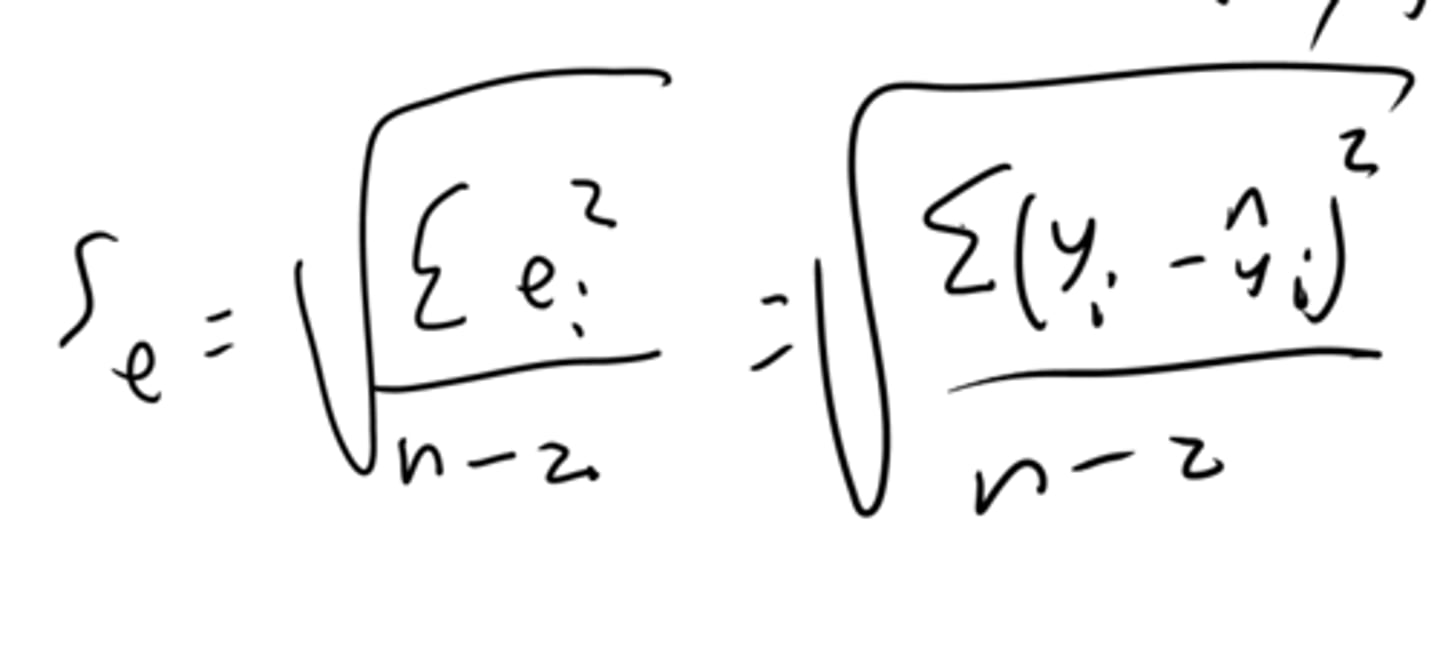
What is the mean and standard deviations of residuals?
The mean of the residuals is always 0.
The standard deviation of residuals is given by the following formula:
The standard deviation of residuals indicates a typical residual value. In computer output, it's given by S.
What are you looking for in a residual plot?
Small, balanced residuals which don't show any kind of curve/pattern.
What are outliers and influential points in regression?
Outliers deviate from the overall pattern. Influential points sharply change the slope of the regression line.
How do you transform data to make it linear?
Sometimes a line isn't the best model, so you can apply a transformation to improve the trend. The most common transformations are either taking the log of all y values (resulting in an exponential model) or taking the log of all y and all x values (resulting in a power model).
What can the correlation coefficient tell you about causation?
Absolutely nothing! You only know correlation not causation.
In a computer output when the slope value is next to one of the variables, is that variable independent or dependent?
It's the independent variable!
What are two way contingency tables?
They are tables which group data into different categories. For instance, you might want to compare severity of heart attacks to cholesterol level (so you might have severity of heart attacks as the row variable and cholesterol level as the column variable).
What are marginal frequencies?
Marginal frequencies are the totals along the "margins" in two way contingency tables (ie. sum up each row and each column).
What is the marginal distribution?
It's each marginal frequency divided by the total (and you can do this for each type- for instance you could get a marginal distribution for cholesterol level and another marginal distribution for heart attack severity).
This information can be displayed in a bar chart.
What are conditional relative frequencies?
Dividing each value by the marginal frequency of that row or column. So you could divide the number of non fatal heart attacks with low cholesterol by the total number of non fatal heart attacks.
This information can be displayed in side by side bars in bar charts or alternatively by segmented bar charts in order to gauge association.
What is perfect independence in two way contingency tables?
Perfect independence is when the conditional relative frequencies all match up. However, even if two variables are completely independent, they may not necessarily show perfect indepndence.
What is Simpson's paradox?
Simpson's paradox is when the results from a combined grouping contradict the results for an individual group (due to lurking variables).
Ie. if there are two doctors and you're comparing survival rates, you may initially conclude that one doctor is better than the other (based on combined survival rate). However, if you split these groups into good & bad condition of the patients that they're treating, you may come to the opposite conclusion.
What is a census? What are the advantages/disadvantages of a census?
A census is a complete enumeration of the population.
It's ideal because you manage to capture everybody.
However, it can be very time consuming/costly. Also, it would be far better to take a sample and do it well then to conduct a poorly run census.
What is a sample survey?
A sample survey just takes a part of the whole population to survey.
What's necessary for a good sample survey?
Avoiding bias which is frequently achieved by randomization. Also, a large sample size gives more validity to the results (NOTE: It's the actual size not percentage- a group of 500 in a population of 100,000 is just as good as a group of 500 in a population of 1,000,000).
What is an experiment
The researchers divide subjects into appropriate groups. Most often there is a treatment group which receives the treatment and a control group which does not (often receiving a placebo).
What are the facets of a well designed experiment?
Double blindness which means that neither researchers nor subjects know what group the subjects are in.
Control- conditions as similar as possible for all subjects other than their placed group
Blocking- division into representative groups in order to make comparisons
Randomization- randomize the group to minimize lurking variables
Replication- repetition on a sufficient number of subjects
Generalizability- ability to repeat in a variety of settings
What is an observational study?
There isn't a decision about who goes to treatment or control groups (for instance you can't ask people to smoke more/less, so you simply ask people who already smoke that amount). Sample surveys are one example of observational study.
However, experiments show cause/effect while observational studies do not as variables can become confounded with other variables.
What is a simple random sample? What are some ways to get a simple random sample?
In a simple random sample, every participant has an equal chance of being selected.
The best ways to generate a simple random sample are via random digit tables or having a computer generate random samples.
One thing you have to be careful of is that you might not have a complete listing of the population in which case randomness is not ensured.
Are other sampling techniques (stratified, cluster, etc.) just subsets of simple random sampling?
NO!!! In these techniques, every participant does not have equal chance of being selected.
What is sampling error?
No matter how well designed a survey is, it still gives a sample statistic for a population parameter, so we're always bound to have some error. Generally, the chance of an error occurring is less when the sample size is larger unless the survey was badly conducted.
What are some common types of biases?
Bias is defined as a tendency to favor certain members of a population. The following are the main types of bias:
Household bias- only one member of a households responds, so large households are underrepresented.
Nonresponse bias- people don't respond to surveys or are too difficult to contact, thus creating a source of bias.
Quota sampling bias- interviewers are at liberty to pick people (ie. a specific percentage Catholic, a specific percentage African-American, etc.).
Response bias- People may lie/be untruthful when responding, especially when they're not anonymous if their views are unsavory.
Selection bias- for example a newspaper interviewed just people with cars and telephones in a presidential election and predicted a landslide victory for the wrong person due to the fact that the people owning cars and telephones were wealthy and tended to vote Republican.
Size bias- For instance if you have a student pick a coin out of a bag to estimate the monetary value, throw a dart at a map, etc. This benefits large states, large coins, etc.
Undercoverage bias- Inadequate representation- for instance there were phone surveys to landlines which left out people who only had cell phones. Another instance of this is convenience samples, like interviews at shopping malls which just target easy to reach people.
Voluntary response bias- samples where individuals can volunteer or call in often benefit people who have strong opinons.
Wording bias- if leading questions are used, then they may lead to biased answers.
What are other sampling methods in addition to the simple random sample?
Systematic sampling- list the population in order, start at a random point and pick every tenth, hundredth, kth person from the list. This just result in a good sample as long as the list isn't ordered in any way related to the variables under consideration.
Stratified sampling- the population is divided into homogeneous groups called strata, and random samples from all strata are chosen (ie. you could stratify by age, income level, race, etc.). You could also do proportional sampling by choosing the sample sizes from each strata in accordance to the proportion of the total population.
Cluster sampling- the population is split into heterogeneous groups called clusters, and then, you take a random sample of clusters. For instance, you could randomly pick several high school classes to survey.
Multistage sampling- there are two or more steps, each of which involves any of the other sampling techniques. For instance, some organizations randomly select nationwide locations, then randomly pick neighborhoods in each of these locations, then randomly pick households in each of these neighborhoods.
What is an experiment vs. an observational study vs. a survey?
An experiment is when a treatment or change is assigned.
An observational study is when we observe or measure something which is occurring.
A sample survey is a particular type of observational study when we look at a sample.
What are explanatory and response variables? What are treatments?
Explanatory variables (called factors) are what is being changed/tested and is believed to have an effect on the response variable (which is being measured).
Treatments consist of factor-level combinations (for instance, you could have two factors and 3 levels of each factor for a total of 6 treatments).
What is confounding? What are lurking variables? How can both of these effects be overcome?
Confounding is when there's uncertainty with regard to which variable is causing a given set of results (for instance if two or more variables are being altered).
A lurking variable is a variable driving two other variables (for instance, those with higher shoe sizes have higher reading levels not because of their shoe size but because of the lurking variable of age). This can also be described as a common response in that the lurking variable and the measured variable seem to be producing the same response.
What is a control group? What is the placebo effect? How can the placebo effect be minimized?
A control group is one which doesn't receive the treatment, and the treatment group receives the treatment. People can randomly be assigned to control & treatment groups in order to minimize confounding/lurking variables.
The placebo effect is when people respond to any treatment (for instance, they might report that a sugar pill makes them feel much better). This can be overcome by either single-blinding in which the subjects don't know what they're receiving or double-blinding in which neither subjects nor researchers know what treatment they're receiving.
What is randomized paired comparison design?
When you have one person who receives two different treatments or twins, one of whom receives one treatment, the other of whom receives the other.
What are replication and blocking?
Replication is repeating the experiment sufficiently in order to decide whether the results are statistically significant or not.
Blocking is basically the experimental version of stratification. It's dividing subjects up into representative groups called blocks with some characteristic. In that case, you're able to make more comparisons. Note: the paired comparison design is an example of blocking in which each pair is considered to be a block.
What is probability?
The likelihood a particular event will occur. It is always between 0 and 1.
What is relative frequency? How does it relate to probability?
Relative frequencies are the number of occurrences over the number of trials (for instance 12 rainy days out of 30=12/30).
The more trials that are done, the more the relative frequency approaches a certain number. This is called the Law of Large Numbers.
What is the probability an event will not occur/the probability of the complement?
What does it mean for two events to be mutually exclusive? How do you find the probability of A or B occurring?
Two events being mutually exclusive means that both cannot occur.
The probability of one or the other occurring for mutually exclusive events is simply P(A) + P(B)
What is the rule for A or B occurring for two events which aren't mutually exclusive?
P(A∪B)=P(A)+P(B)-P(A∩B) where P(A∩B) denotes the probability of both events occurring.
What does it mean for two events to be independent? What is the probability of two independent events occurring?
Independent events mean that one doesn't impact the other. To find the probability of two independent events occurring, you simply take the product of their separate probabilities. This can be extended to more than two independent events.
What is conditional probability? What is its formula?
Conditional probability is the probability of something occurring given that something else has already occurred.
Thus we have P(A|B)=P(A∩B)/P(B) where P(A|B) represents the probability of A given that B has occurred.
How do you check for independence with conditional probabilities? When can events be both independent and mutually exclusive?
A and B are independent if P(A|B)=P(A∩B)/P(B) = P(A)*P(B)/P(B)=P(A). This can be used to check independence with probabilities.
Mutually exclusive events are NOT independent except in one very special case. This is because mutually exclusive means that P(A∩B)=0, and independence means that P(A∩B)=P(A)*P(B). Thus, the only way that both can be true is if P(A)=0 or P(B)=0.
What is a good way to find probabilities (especially conditional probabilities)?
Via drawing tree diagrams
What is a random variable? What is the concept of a discrete random variable? What is the concept of a continuous random variable?
A random variable is different numbers which take on different probabilities (for instance there might be a 0.5 chance of winning no prizes, a 0.25 chance of winning one prize, a 0.2 chance of winning two prizes, and a 0.05 chance of winning three prizes).
A discrete random variable can only take on a countable number of values. A continuous random variable can take on all values in a given interval.
What is a probability distribution for a random variable? What is a binomial random variable?
The probability distribution of a random variable is the chance that each outcome will occur.
Binomial probabilities are situations where there are two outcomes, repeated a certain number of times. The probability must stay constant from occurrence to occurrence (ie. you could have lightbulbs with a probability of 0.1 of being defective and find out the probability a certain numbe are defective).
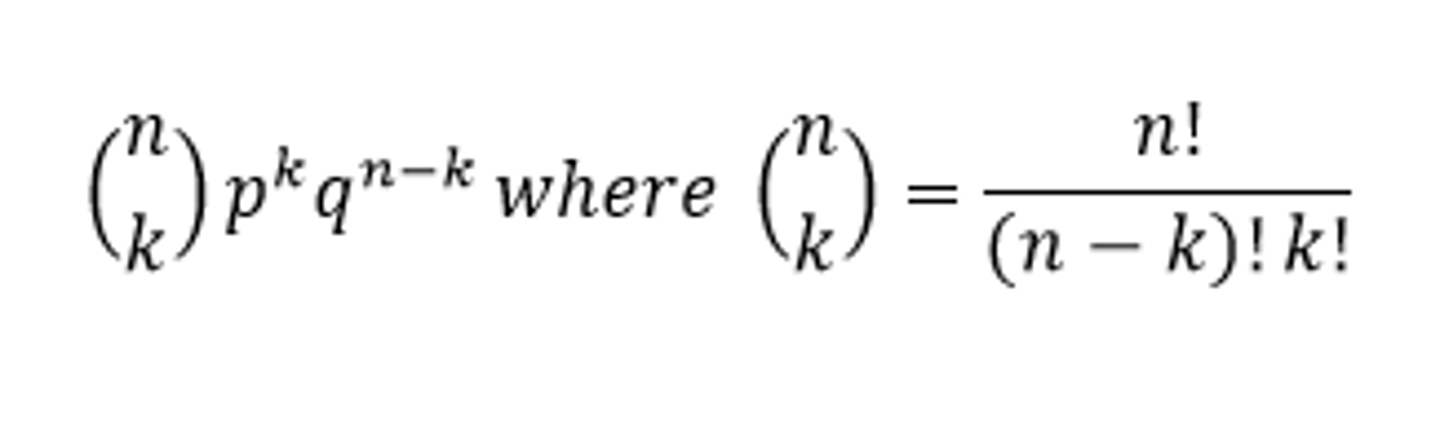
What is the generic formula for a binomial probability? How do you find the probability of there being less than or more than a certain number of occurrences?
To find the probability of less than or more than a certain number of occurrences, you have to add together the probabilities of each occurrence happening.
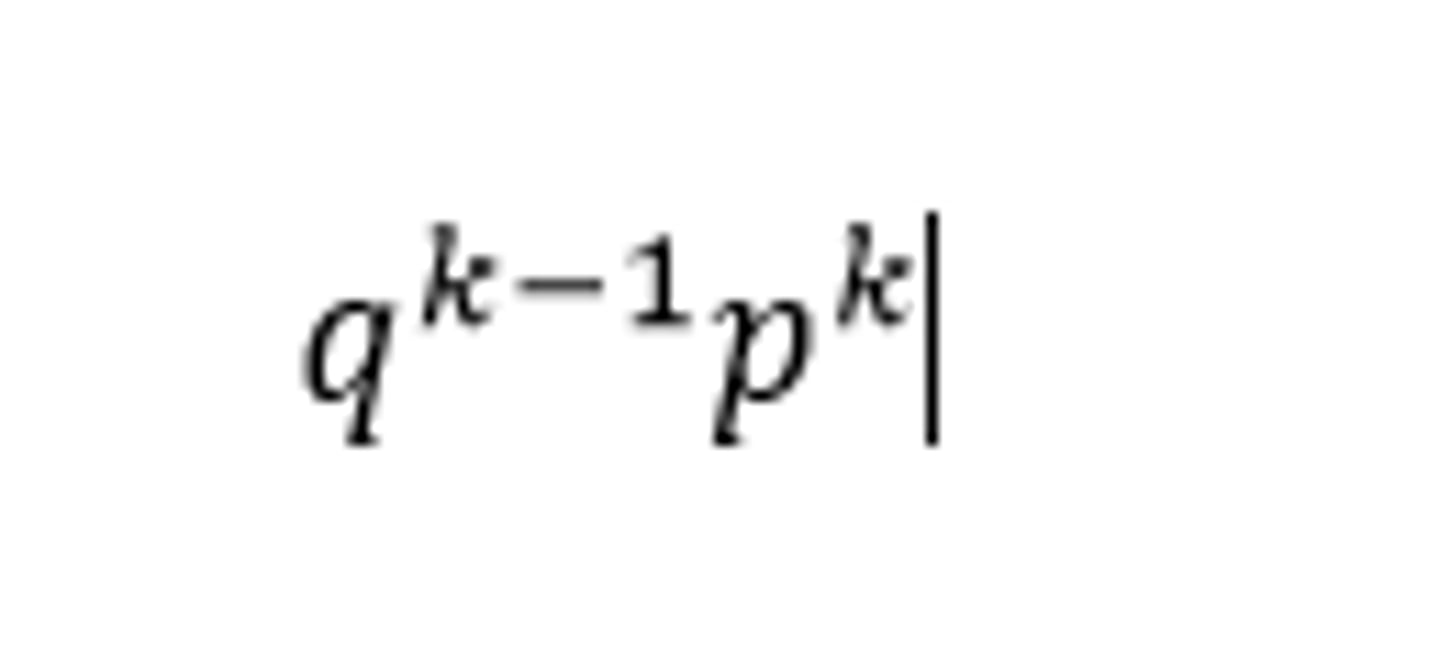
What is a geometric probability? How is it calculated?
A geometric probability is like a binomial probability except without a fixed number of trials. You want to find the probability that the first success is on x=K.
The formula is as follows:
What is the notation for something being in a binomial or geometric distribution?
Binomial: X∼B(n,p) where n is the number of trials and p is the probability of success.
Geometric: X∼G(p) where p is the probability of success
How do you simulate probabilities using a random digit table?
1) Set up a correspondence between outcomes and random numbers.
2) Give a procedure for choosing the random numbers.
3) Give a stopping rule
4) Note what is to be counted
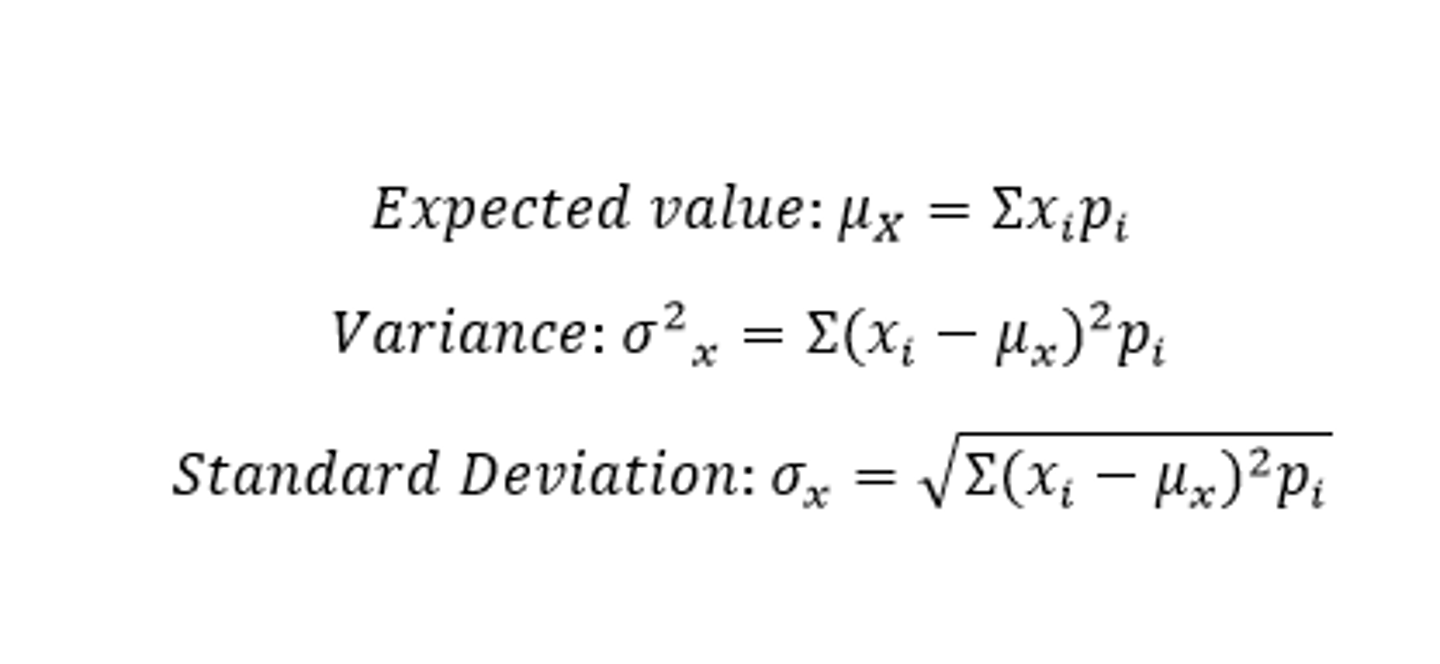
What is the generic formula for expected value, variance, and standard deviation of a given random variable?
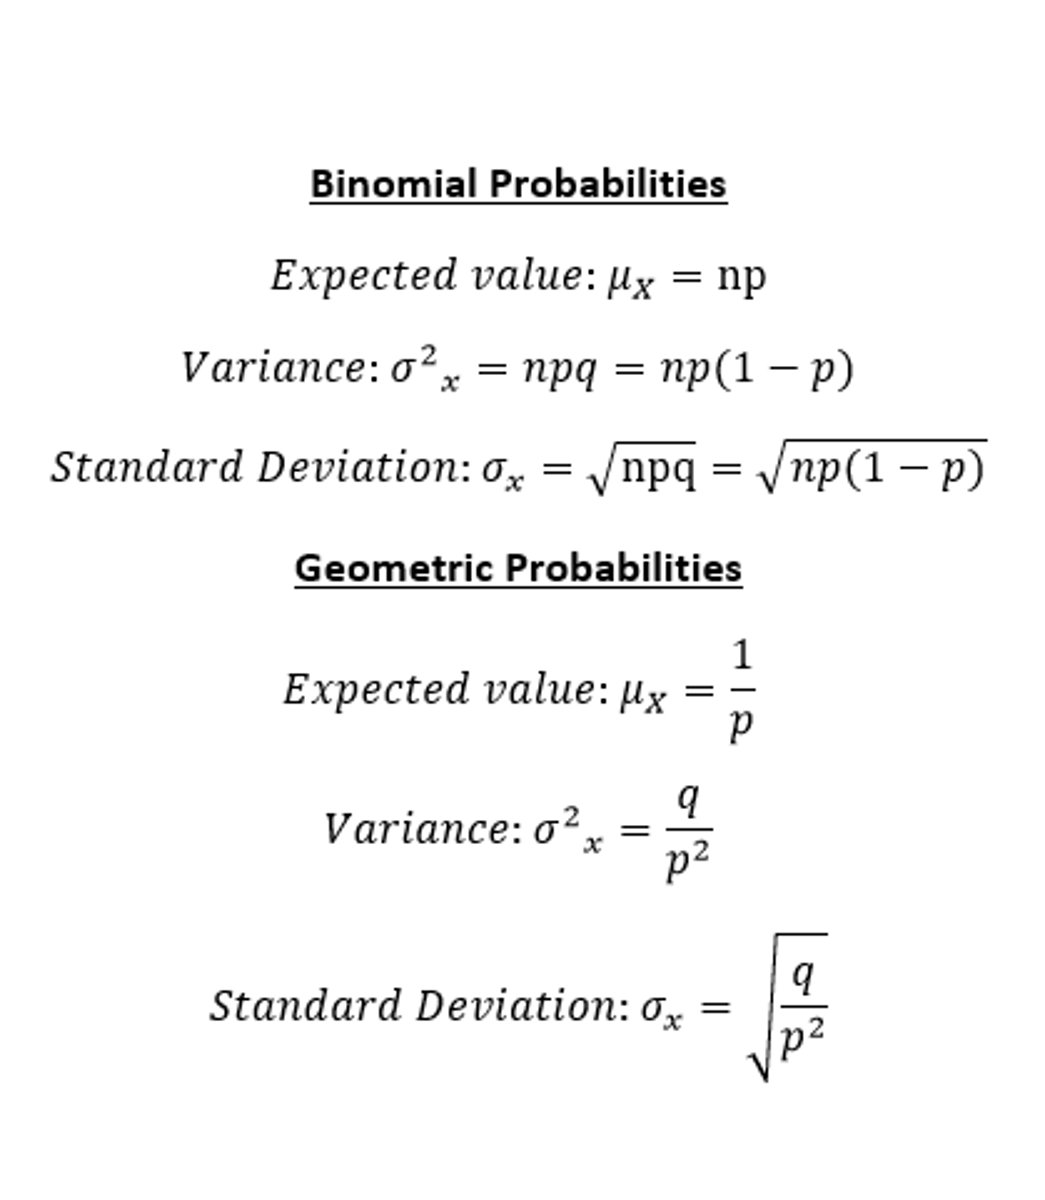
What are the formulas for expected value, variance, and standard deviation of binomial and geometric random variables?
How do you perform a chi square goodness of fit test?
Ho: Distribution is as stated
Ha: At least one value differs
Degrees of freedom k-1
Test statistic
chi square=Σ(observed-expected)²/expected
Conditions:
SRS
All ≥1
≤20% of expected values<5
How do you perform a chi square independence or homogeneity test?
For independence:
Ho: No relationship
Ha: there is a relationship
Conditions:
SRS
All ≥1
≤20% of expected values<5
chi squared=(observed-expected)²/expected
Expected counts: (column total)*(row total)/n
dfs=(row-1)*(column-1)
Chi Square homogeneity:
Same as above except you're testing sameness instead of association/relationship
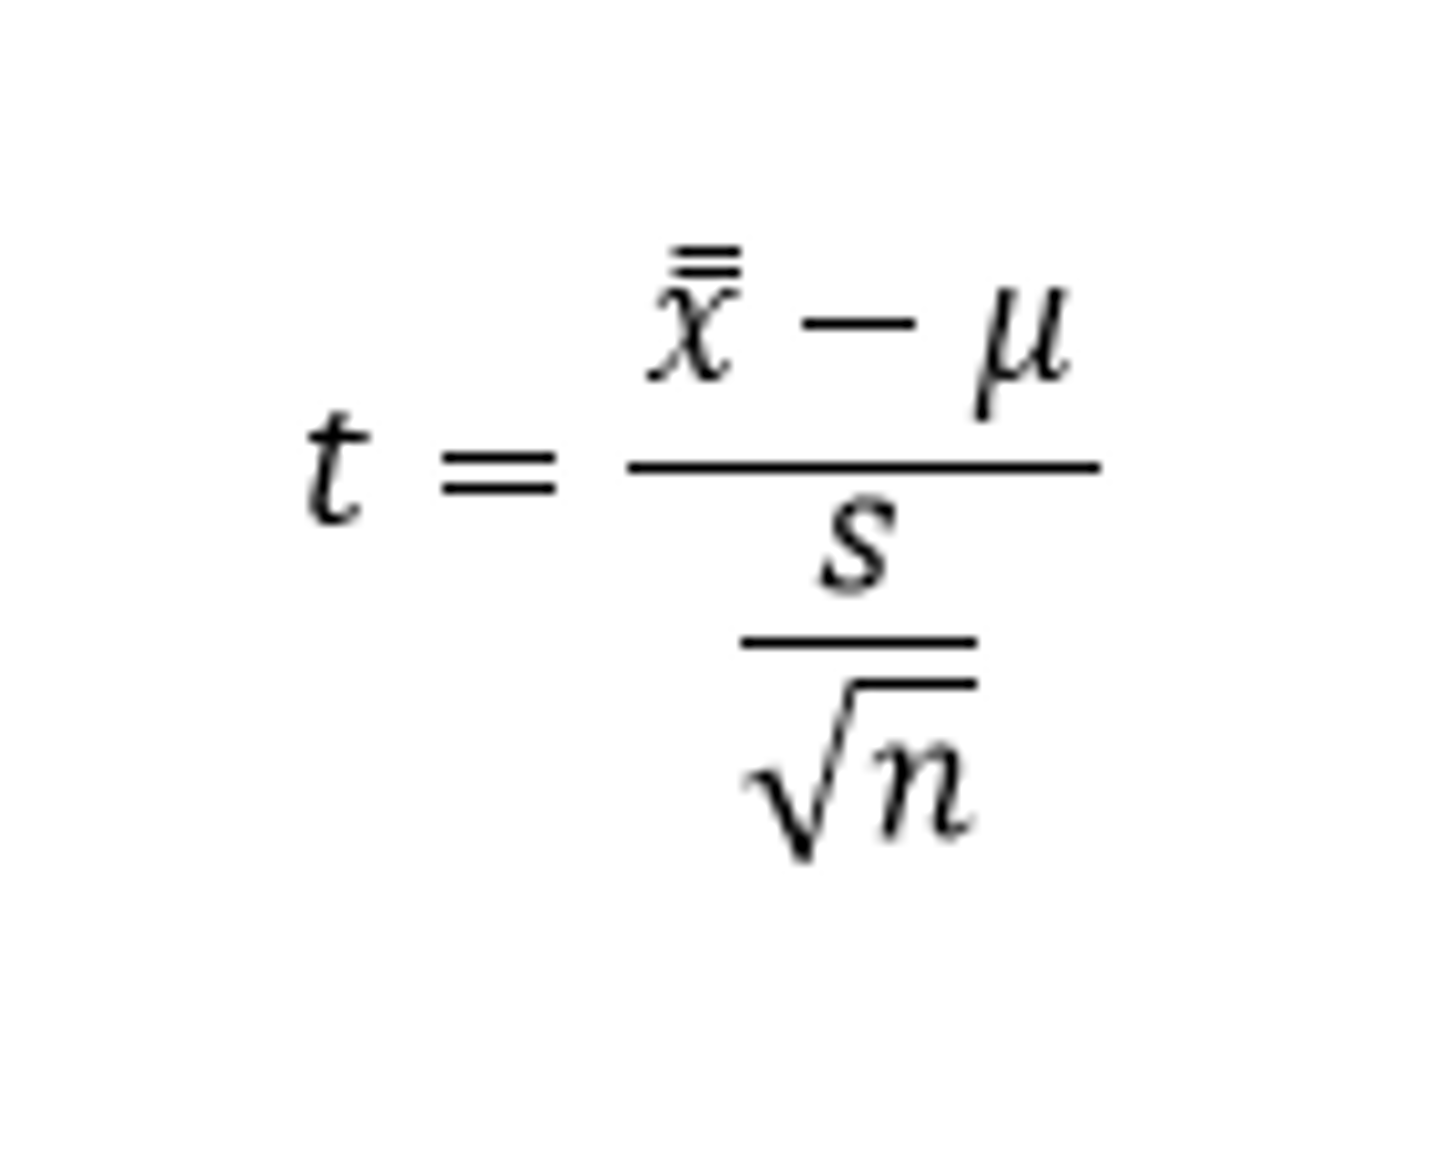
How do you perform a 1 sample mean t or z test?
Ho: µ=a #
Ha: µ≠a #, u>#,µ<#
degrees of freedom: n-1
Conditions:
1)Representative data
2) Central Limit Theorem applies (sample size≥30 or distribution has normal boxplots).
Test statistic:
1 sample mean z test is the exact same except we know σ and thus, the t becomes a z
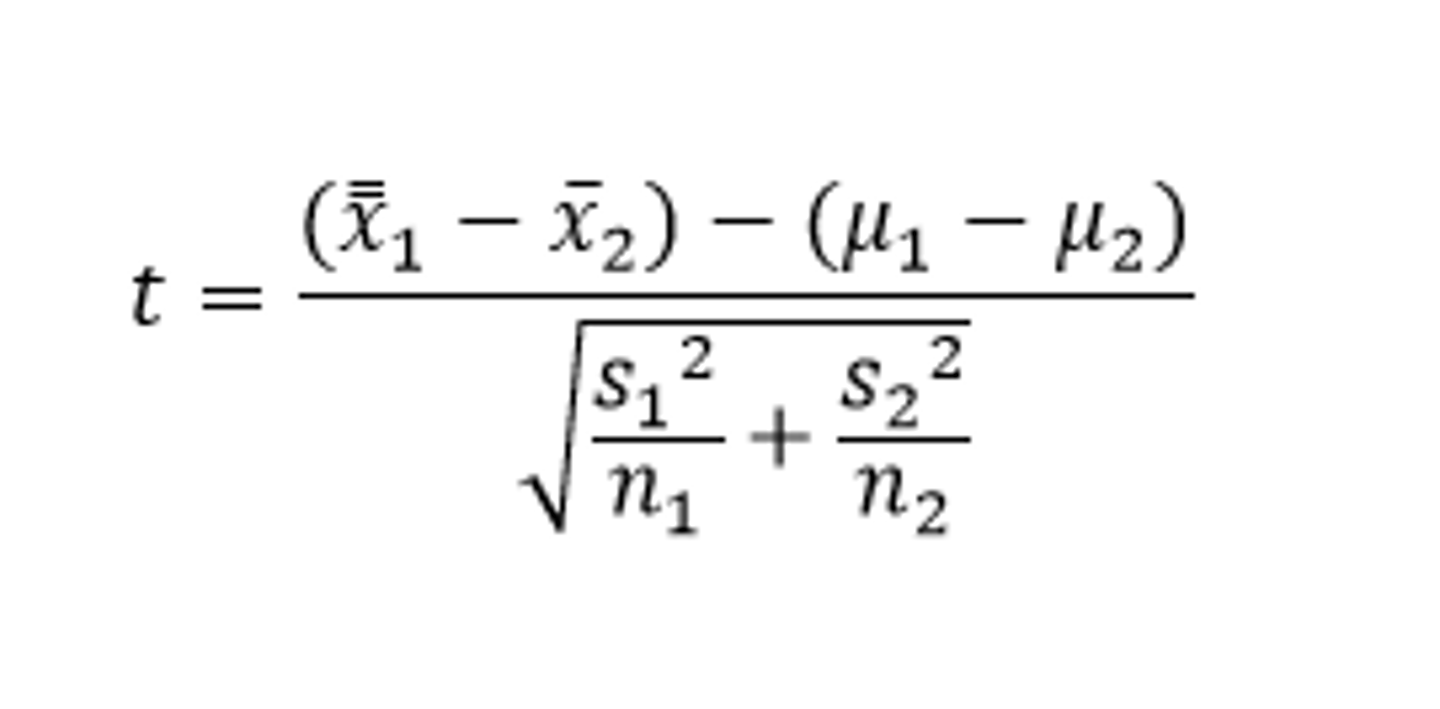
How do you perform a 2 sample mean t test?
Ho: µ1=µ2, Ha:µ1≠µ2, µ1>µ2,µ1<µ2
Conditions:
1)Representative data
2) Central Limit Theorem applies (sample size≥30 or distribution has normal boxplots).
3) Both groups are independent
Find dfs on calculator
Test statistic:
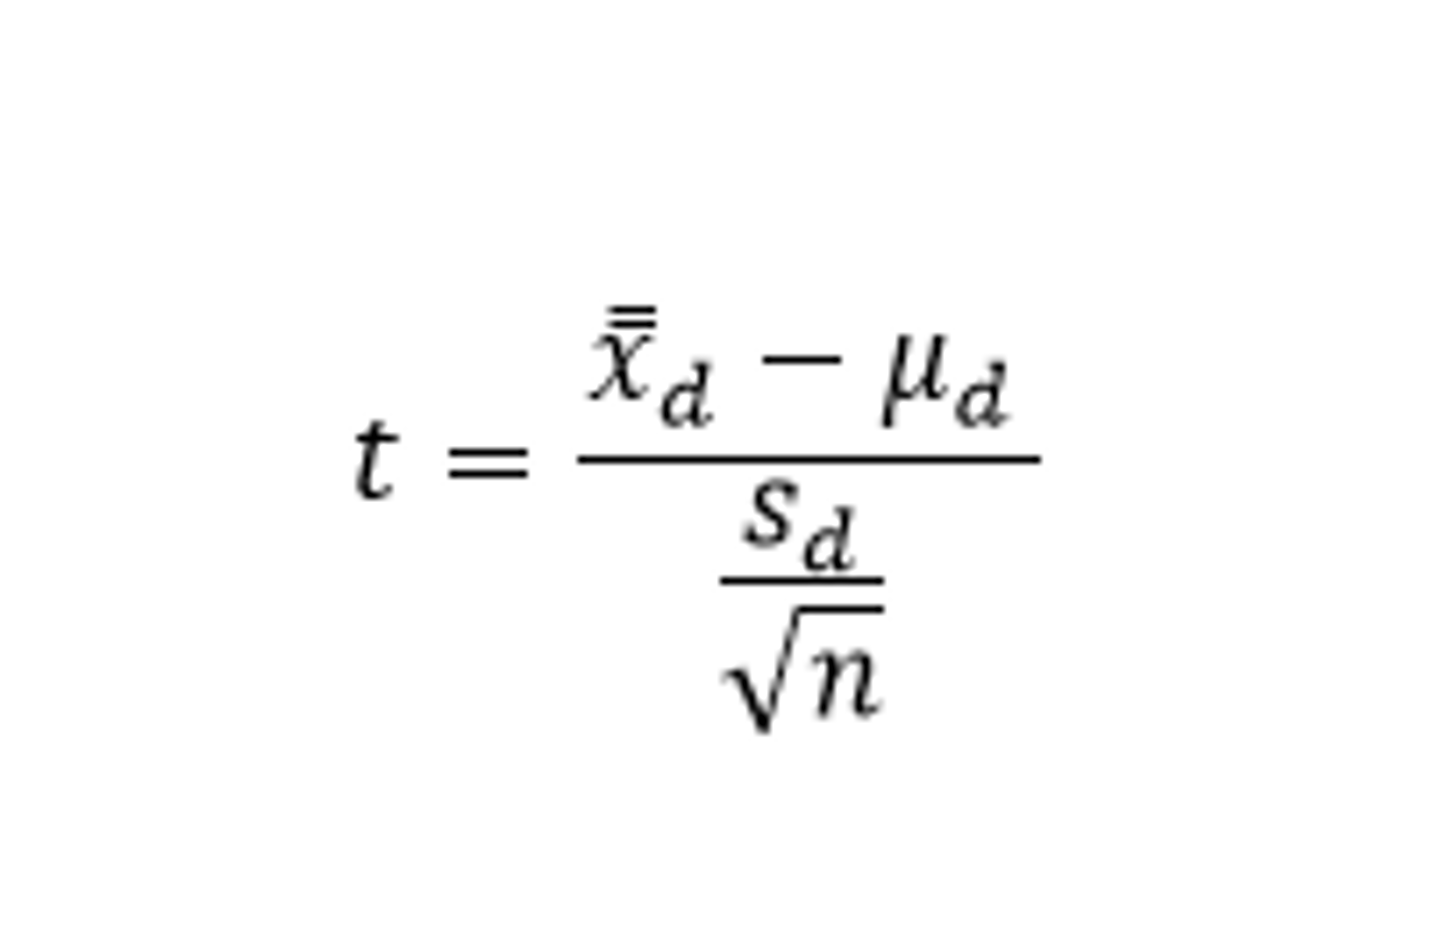
How do you do a matched pairs t test?
dfs=pairs-1
Conditions:
1)Representative data
2) Central Limit Theorem applies (sample size≥30 or distribution has normal boxplots).
3) All pairs are independent
Test statistic:
where n represents the number of pairs
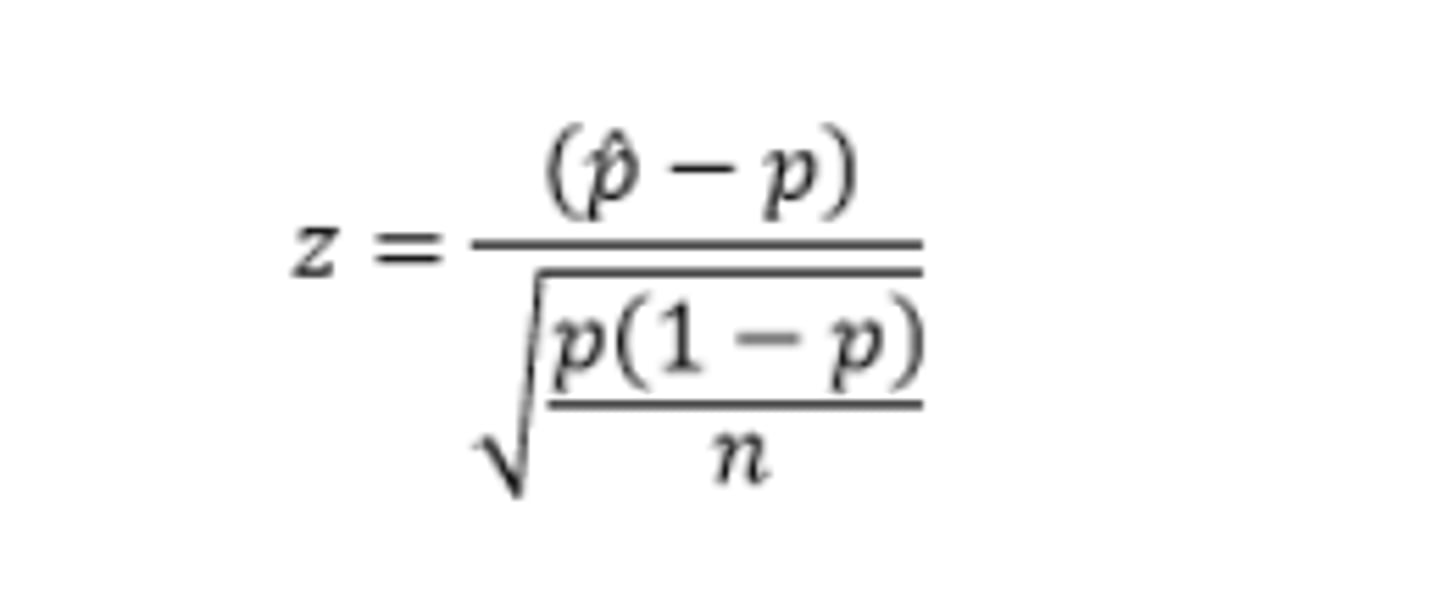
How do you perform a 1 sample proportion z test?
Ho: p=a #, Ha: p≠a# OR p>a# OR p
test statistic:
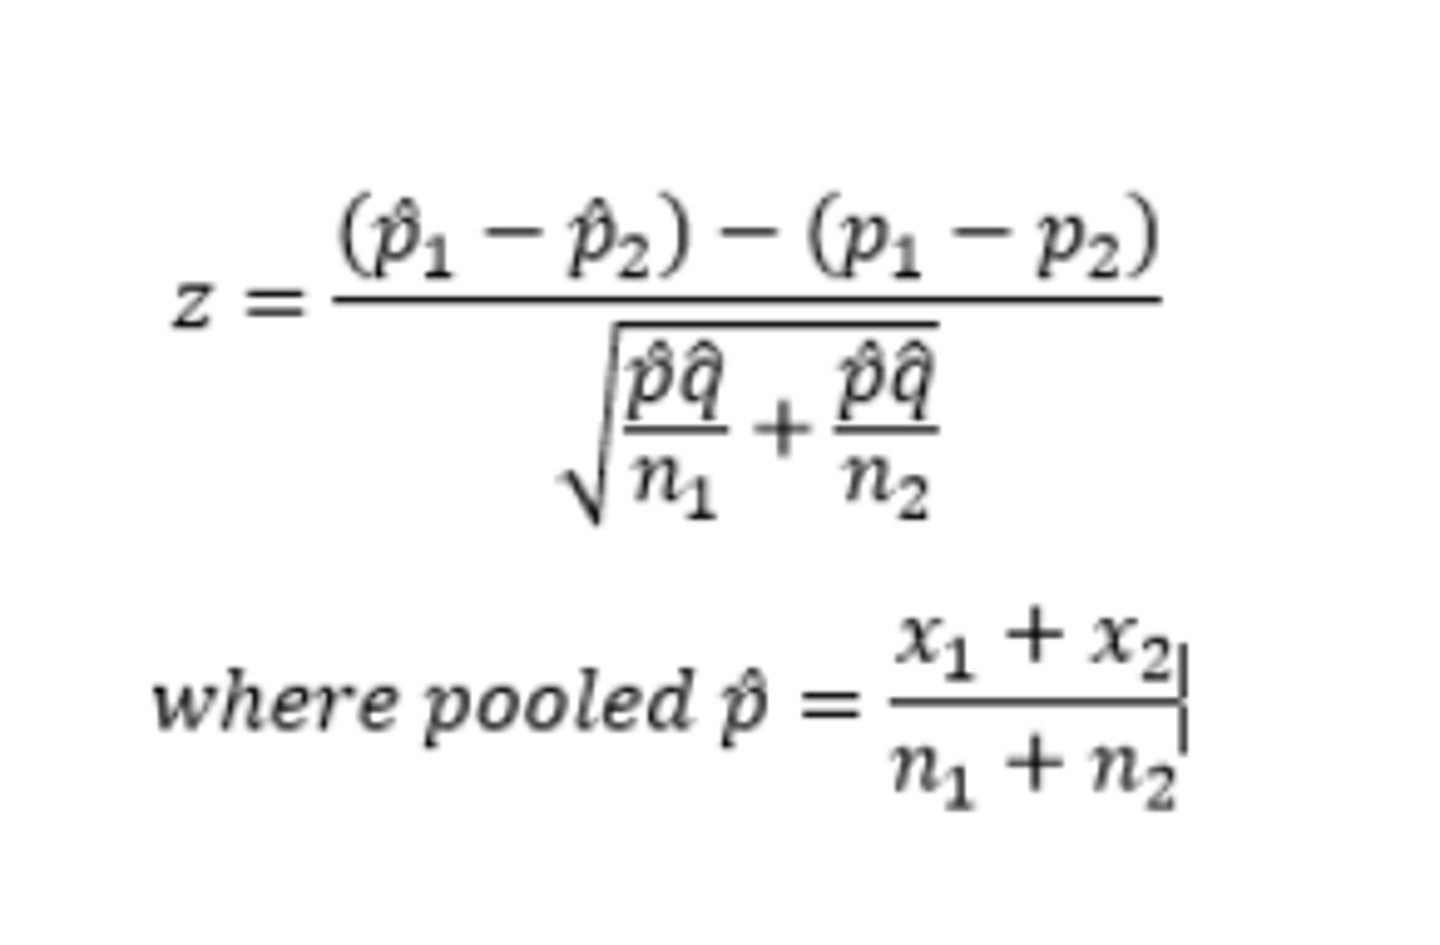
How do you perform a 2 sample proportion z test?
Ho: p1=p2
Ha: p1≠p2,p1>p2,p1
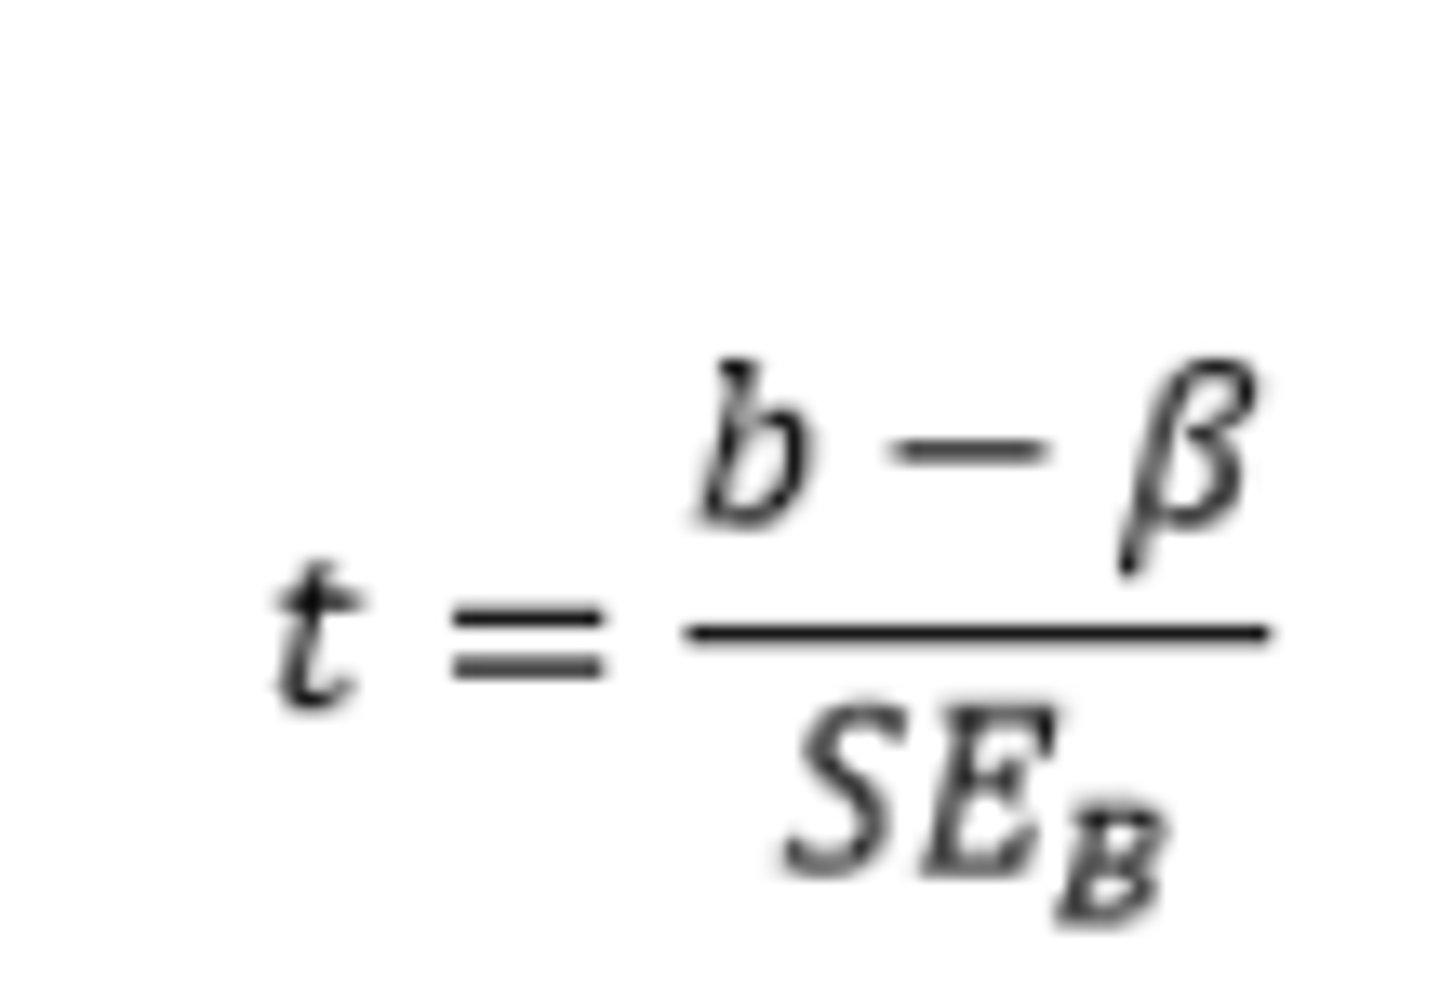
How do you perform a t test for slope?
Ho: B=0, Ha: B≠0, degrees of freedom #ordered pairs-2
Conditions:
1)SRS
2) Linear scatterplot
3) Residual plot indicating linear trend
4) Normally distributed residuals
What is the meaning/form of a confidence interval?
A confidence interval is formed by an estimate±margin of error.
The confidence level is the success rate for the method- the proportion of times repeated application of the method would capture the true population parameter.
How do you find the required number of people for a given confidence level for an interval?
Set your t* or z* times the standard error equal to the margin of error required and solve for n. Note: assume the same number for 2 sample intervals and assume p hat and q hat are both 0.5 for proportions.
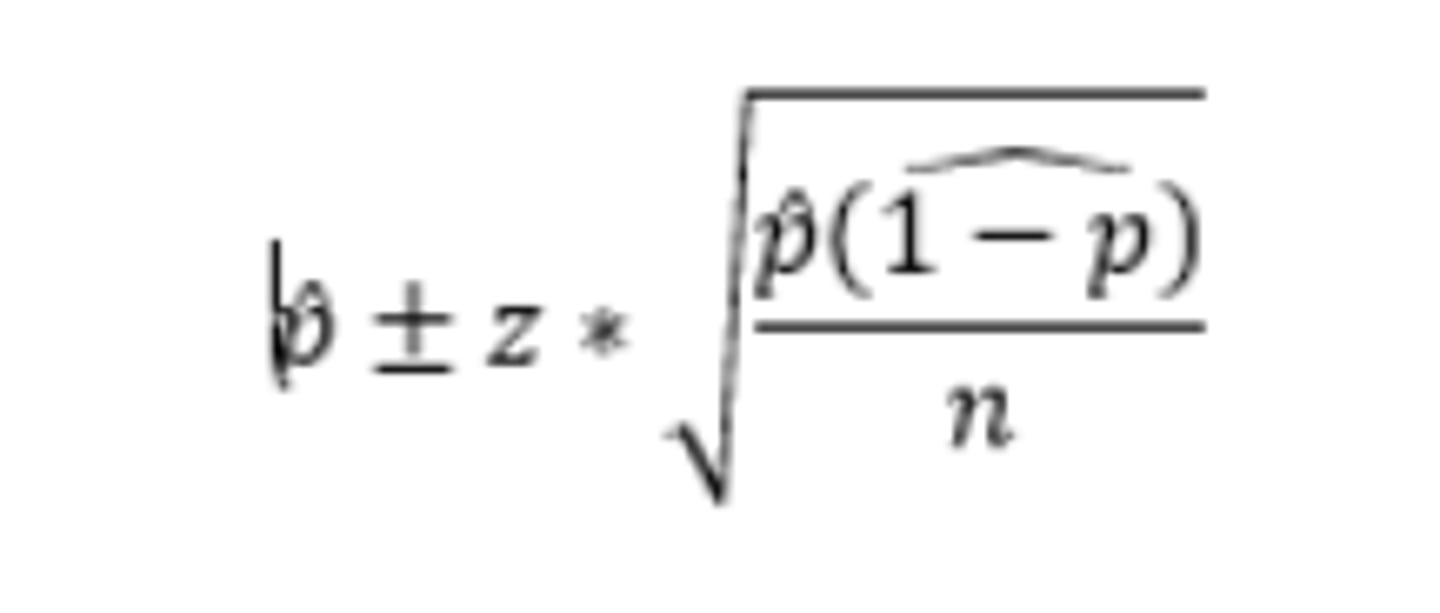
How do you construct a 1 sample proportion z interval?
Conditions:
Conditions: 1)SRS, 2) Normality: np≥10, nq≥10, 3)Independence: population>10n
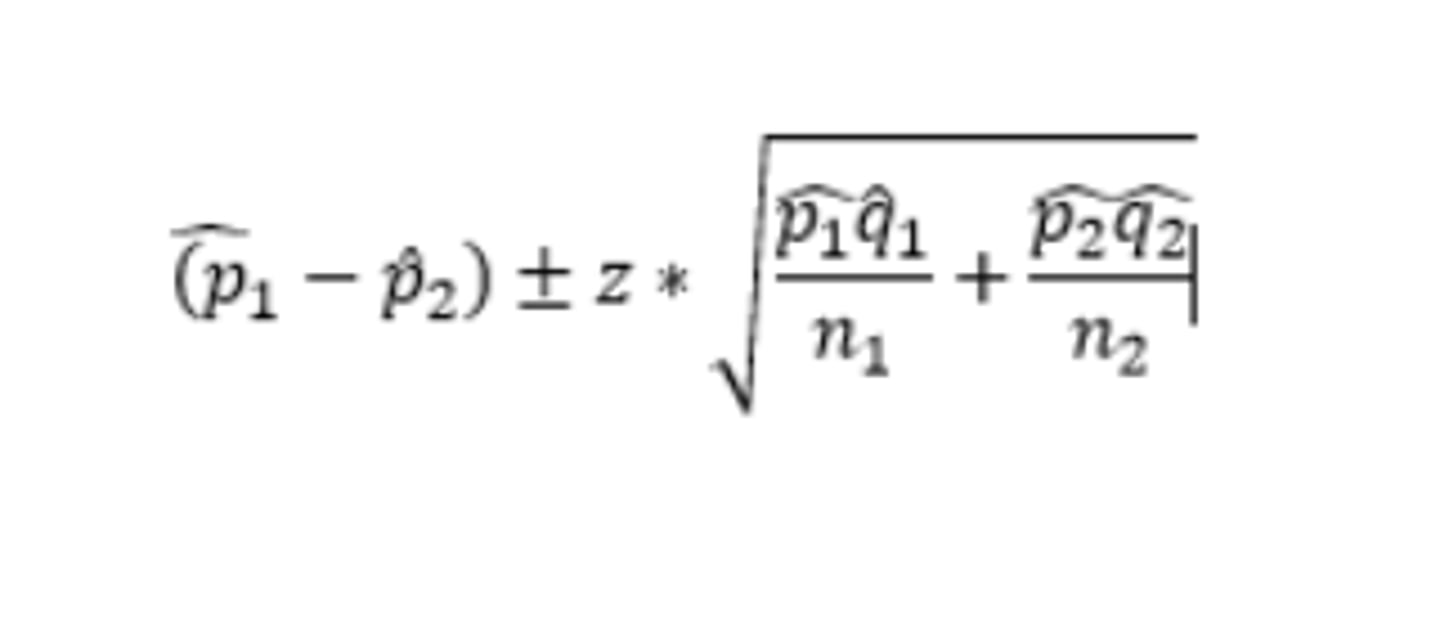
How do you construct a 2 proportion z interval:
Conditions: 1)SRS, 2) Normality: np≥10, nq≥10, 3)Independence: population>10n for both groups + groups independent to 1 another.
If both ends are positive, p1>p2, both negative p1
How do you construct a t-interval for slope
degrees of freedom #ordered pairs-2
Conditions:
1)SRS
2) Linear scatterplot
3) Residual plot indicating linear trend
4) Normally distributed residuals
Interval:
b±t*SEb
What is the formula for Standard Error for a t-interval for slope?
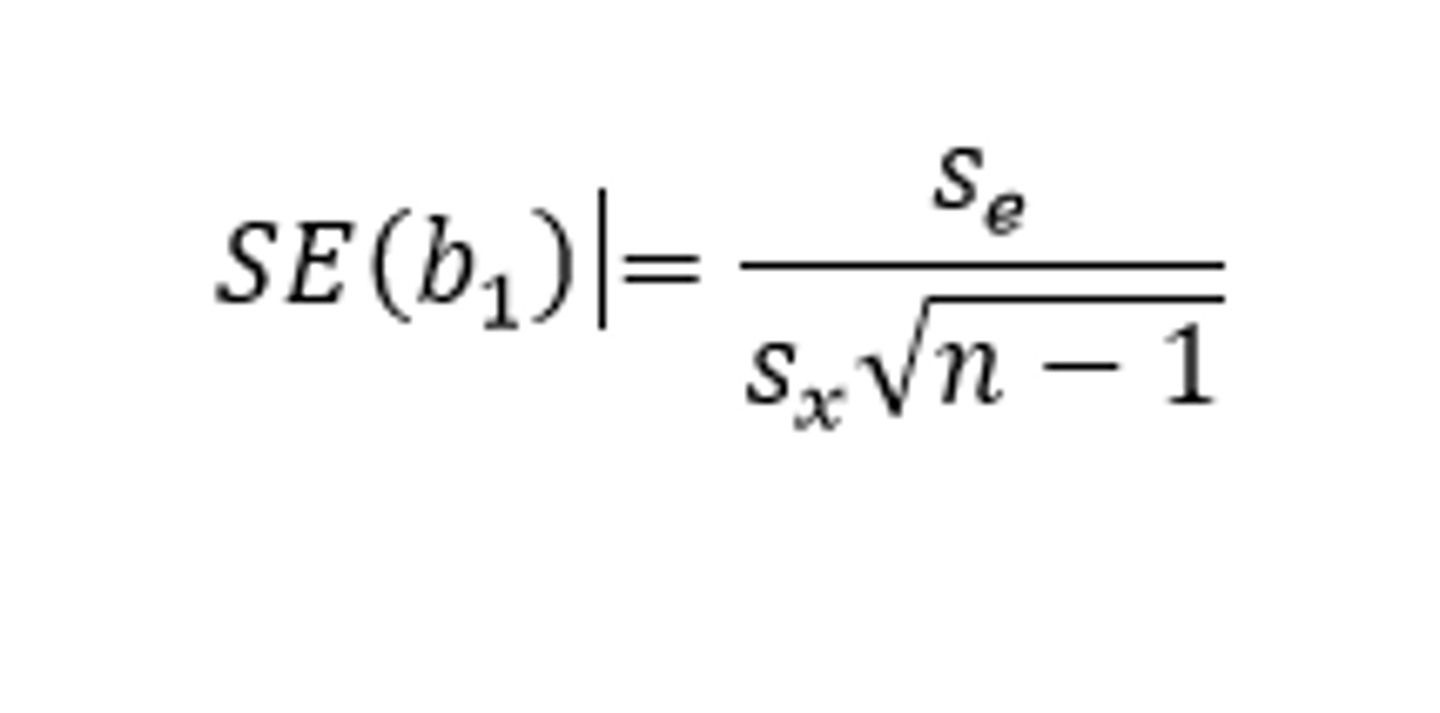
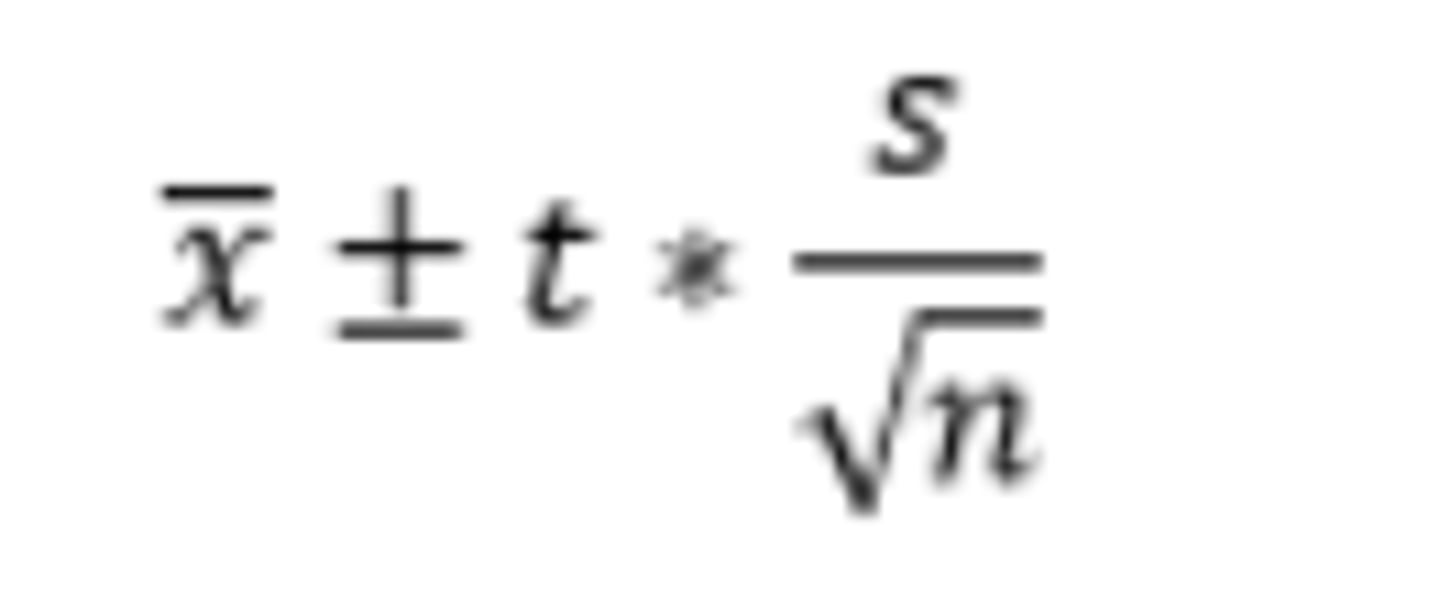
How do you construct a 1 sample mean t or z interval?
degrees of freedom: n-1
Conditions:
1)Representative data
2) Central Limit Theorem applies (sample size≥30 or distribution has normal boxplots).
Test statistic:
1 sample mean z interval is the exact same except we know σ and thus, the t becomes a z
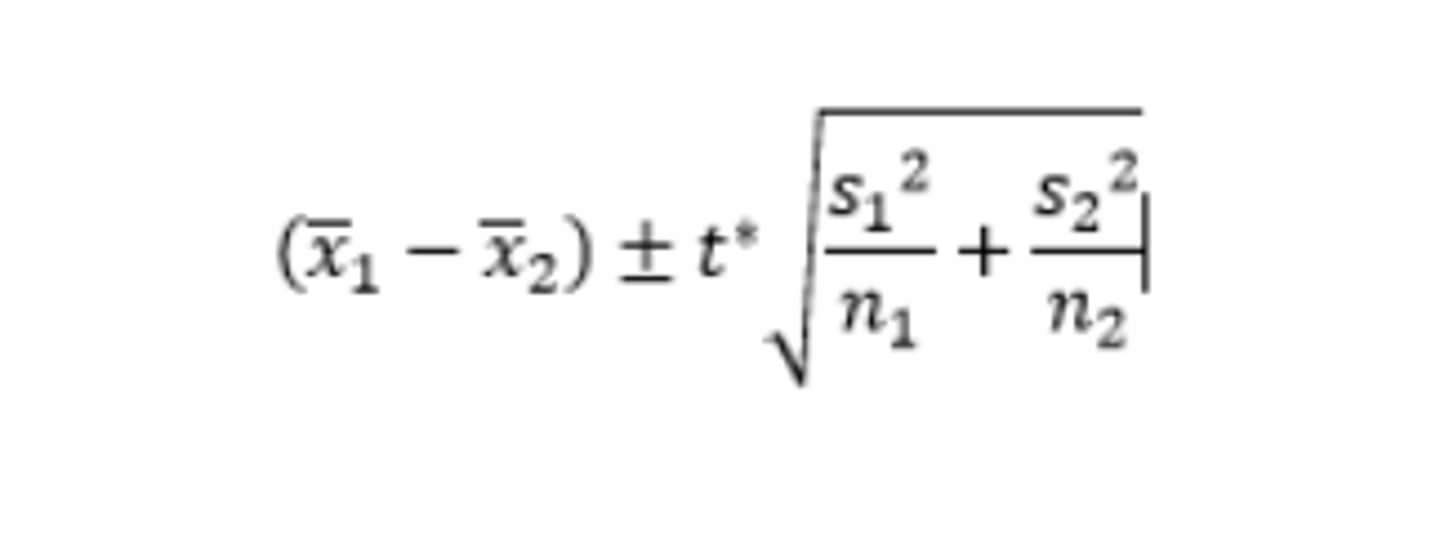
How do you construct a 2 sample mean t interval?
Conditions:
Conditions:
1)Representative data
2) Central Limit Theorem applies (sample size≥30 or distribution has normal boxplots).
3) Both groups are independent
Find dfs on calculator
Make comparison of means to one another in conclusion
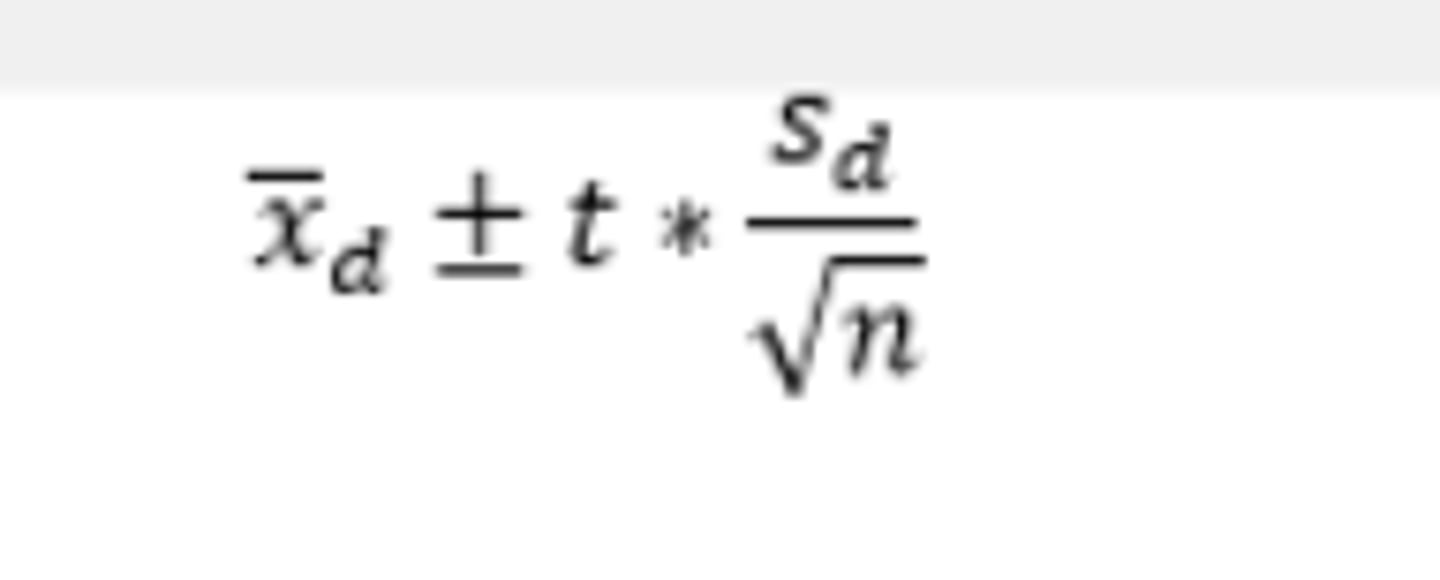
How do you construct a matched pairs t interval?
dfs=pairs-1
Conditions:
1)Representative data
2) Central Limit Theorem applies (sample size≥30 or distribution has normal boxplots).
3) All pairs are independent
Test statistic:
where n represents the number of pairs