data mining exam 2
1/95
Earn XP
Description and Tags
clustering
Name | Mastery | Learn | Test | Matching | Spaced | Call with Kai |
|---|
No analytics yet
Send a link to your students to track their progress
96 Terms
agglomerative hierarchical clustering
where each instance is treated as an individual cluster and then iterated in twos until it creates a single cluster (bottom up approach)
key concepts of k-means clustering
measured as the sum of squared distances from each data point to it’s centroid
what does k-means aim to do?
k-means aims to reduce the total within dispersion at each step
what approach does k-means use?
k-means uses the heuristic approach, providing quick, but not always optimal solutions
advantages of k-means clustering?
speed, high scalability, easy to understand
challenges of using k-means clustering?
number of clusters must be pre-specified, sensitivity to initialization, sensitive to outliers
key issues of k-means?
assumes spherical clusters, sensitivity to cluster size and assumes they all have the same variance, centroid location basis
k-medoids clustering objective
uses actual data points as cluster centers
advantages of k-medoids clustering?
less sensitive to outliers compared to k-means, can better handle arbitrary distance metrics
when is k-medoids best used?
best used for clustering data with outliers and noise
what is the method of k-medoids?
minimize the sum of dissimilarities between points and their closest medoids, uses as more robust method as to the mean based method
k-mode clustering objective
extension of k-means for categorical data
k-mode advantages
handles categorical data by using modes instead of means, efficiently handles data based on the most frequent category
applications of k-mode
used in market segmentation, document classification, other areas involving categorical variables
k-mode method
minimize the mismatch between data points and their cluster mode, uses matching dissimilarity measure for categorical data
divisive hierarchical clustering
where all instances belong to a single cluster and are split into twos clusters iteatively until only one instance remains (top down approach)
single linkage cluster
the minimum distance between the nearest pair of records from two clusters
what are characteristics of single linkage clustering?
clusters distant together at an early stage, creating elongated, sausage like clusters
complete linkage clustering
the maximum distance between the farthest pair of records in two clusters
what are characteristics of complete linkage clusters?
form clusters at early stages where records are within a narrow range of distances, result in roughly spherical shapes
average linkage clustering (UPGMA)
based on the average distance between all possible pairs of records in two clusters
what are some characteristics of average linkage clustering?
average linkage relies on actual distances between the records and not just the order, transformation resilience: results are not affected by linear transformations of distances (as long as the order of distances remains unchanged)
what does average linkage clustering (UPGMA) stand for?
unweighted pair group method using averages
centroid linkage clustering
based on the centroid distance where they are measured by their mean values for each variable (the distance between these two clusters is the distance between the two mean vectors)
average linkage vs centroid linkage
average linkage: all points are computed and the average of those distances is taken. centroid linkage: only one distance is calculated, the mean and the vectors of the two clusters
what is another name for centroid linkage?
(UPGMC) unweighted pair group method using centroids
what is the key feature of centroid linkage?
less computation because only the distance between centroids is calculated rather than all pairs
ward’s method
agglomerative clustering that joins records and clusters to form larger clusters, minimizing the loss of information when clusters are formed
key concept of ward’s method
error sum of squares, measures the loss of information when individual records are replaced by a cluster mean
dendrogram
a tree that shows the order in which clusters are grouped together and the distances between the clusters
what is a clade?
a branch of a dendrogram or a vertical line
what is a link?
a link is a horizontal line that connects two clades, whose height gives the distance between clusters
what is a leaf?
a leaf is the terminal end of each clade in a dendrogram which represents a single instance
single linkage dendrogram
join clusters based on the minimum distance between the records
average linkage
joins clusters based on the average distance between all pairs of records
what happens as the number of clusters decreases?
smaller clusters merge into larger clusters as the number of clusters decreases
what provides a visual representation of the hierarchical clustering process?
dendrograms
what are different ways to measure distances between clusters?
single, average, complete, and centroid linkage
how can the number of clusters be adjusted?
by cutting the dendrogram at different heights
advantages of hierarchical clustering
no need to pre-specify the number of clusters, dendrograms provide clear visual representation of clustering
limitations of hierarchical clustering
memory and computational cost, no reallocation of records, low stability, sensitivity to distance metrics, sensitivity to outliers
K-Means
centroid based clustering, minimizing the squared distances between data points and their respective cluster centroids, sensitive to initial placement of the centroids, assumes clusters are of roughly similar size and have equal variance
when does k-means work best?
when clusters are well separated, roughly spherical, and have similar sizes. may not perform well if the clusters have irregular shapes and densities
DBSCAN
density based clustering, algorithm that identifies clusters as dense regions separated by areas of lower point density, can identify outliers and noise, and can be used for arbitrary shapes varying in sizes
what does not assume a fixed number of clusters?
DBSCAN
core point
specified number of points within EPS
border point
not a core point, but in the neighborhood of a core point
noise point
a point that is neither a core point nor a border point
DBSCAN algorithm
label points, eliminate noise, connect core points, form clusters, assign border points
when does DBSCAN not work well
sensitive to its parameters, varying densities (may merge dense clusters or miss sparse ones if they have different densities), struggles with high dimensional data
directly density reachable
not symmetric
density connected
is symmetric
DBSCAN pros
robust to outliers, only 2 parameters, no predefined cluster numbers, identifies arbitrary shapes, insensitive to point ordering
DBSCAN cons
cannot differentiate varying density clusters, not deterministic, parameter sensitivity
DBSCAN clustering approach
identifies clusters based on regions of high density, identify low density regions as noise
gaussian mixture model
a probabilistic approach to clustering
assumption
data is generated from a mixture of multiple gaussian distributions
clusters
each gaussian distribution corresponds to a cluster and the model computes the probability of each data point belonging to a cluster
soft clustering
assigns probabilities offering a flexible probabilistic distributions for cluster assignment
expectations maximization algorithm
to find optimal parameters (means, covariance, and mixing coefficients) for GMM
what are the steps for the EM algorithim?
E-step (expectation), M-Step (Maximization), iterating between these until the parameters converge
strengths of GMM
handles overlapping clusters, models clusters of various shapes, provides soft clustering
weaknesses of GMM
sensitive to initialization, requires number of clusters to be predefined
k-means strengths
simple and fast, effective for well separated clusters
k-means weaknesses
assumes clusters are spherical and equal in size, requires predefined number of clusters
DBSCAN strengths
detects clusters of arbitrary shapes, identifies noise and outliers effectively, no need to predefine the number of clusters
DBSCAN weaknesses
sensitive to parameter settings, struggles with varying density clusters
hierarchical clustering strengths
builds a hierarchy of clusters, no need to predefine the number of clusters, works well with small datasets
hierarchical clustering weaknesses
computationally expensive for long datasets, assumes the clusters are either merged or split based on linkage method, does not handle noise or outliers as effectively as DBSCAN
what is best for overlapping clusters or clusters with different shapes and densities? suitable for soft clustering
GMM
what is ideal for quick clustering of well separated, spherical clusters when the number of clusters is known
k-means
what is effective for detecting irregular shapes and handling noise but requires parameter tuning?
DBSCAN
what is used for visualizing cluster hierarchy (dendrogram) and works well for small datasets where computation is manageable?
hierarchical
external cluster evaluation
entropy, measures the disorder or impurity within a cluster
low entropy
more homogeneous clusters (more points belonging to the same class)
high entropy
more heterogeneous clusters (points distributed among different classes)
low entropy clusters indicate…?
well grouped data points
internal cluster evaluation
measure clustering quality without eternal information based on the datasets inherent features
intra-cluster compactness (cohesion)
mesures how close data points are to their cluster centroid (sum of squared error SSE)
elbow method
graphical approach to determine optimal clusters by plotting SSE against the number of clusters
elbow curve method
helps balance between complexity and clustering effectiveness by plotting within cluster sum of squares
drawbacks of the elbow method
determining the elbow point can differ between individuals (subjective), assumes spherical and equally sized clusters which may not be suited for more complex data, not suitable for varying density
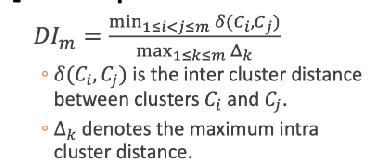
dunn index
evaluated intra-cluster compactness and inter cluster separation
intra cluster distance
how tightly points are clustered around the centroid
inter cluster distance
measures the distance between the centroids of different clusters
what does higher dunn index indicate?
better clustering with compact clusters and well separated clusters
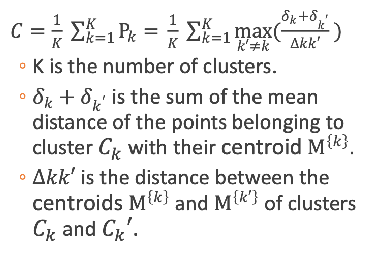
Davies Bouldin index
the summation of the mean value points in a cluster… the mean value of the maximum of the above value among all the clusters
log ss ratio
compares the sum of squared distances between clusters vs within clusters
what does a larger log ss ratio indicate?
better cluster seperation with low intra cluster variance and high inter cluster variance
what does a smaller log ss ratio indicate?
poor seperation with higher variance within clusters than between them
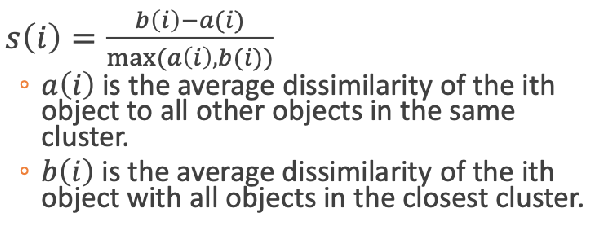
silhouette score coefficient
quantatively evaluates clustering quality
what does the silhouette score consider?
both cohesion (how close the points are within clusters) and separation (how far clusters are from each other), measures the distinctness of clusters and overall clustering validity
silhouette score range
range from -1 to 1; closer to 1 means better defined clusters, negative values suggest overlapping clusters or poor clustering quality
what is the silhouette coefficient for each data point?
(separation - cohesion) / max(separation, cohesion)
what are the steps for silhouette score?
calculate the cohesion and separation for each point, compute the silhouette coefficient, calculate the average silhouette coefficient across all points