Extreme weather and climate
1/412
There's no tags or description
Looks like no tags are added yet.
Name | Mastery | Learn | Test | Matching | Spaced | Call with Kai |
|---|
No analytics yet
Send a link to your students to track their progress
413 Terms
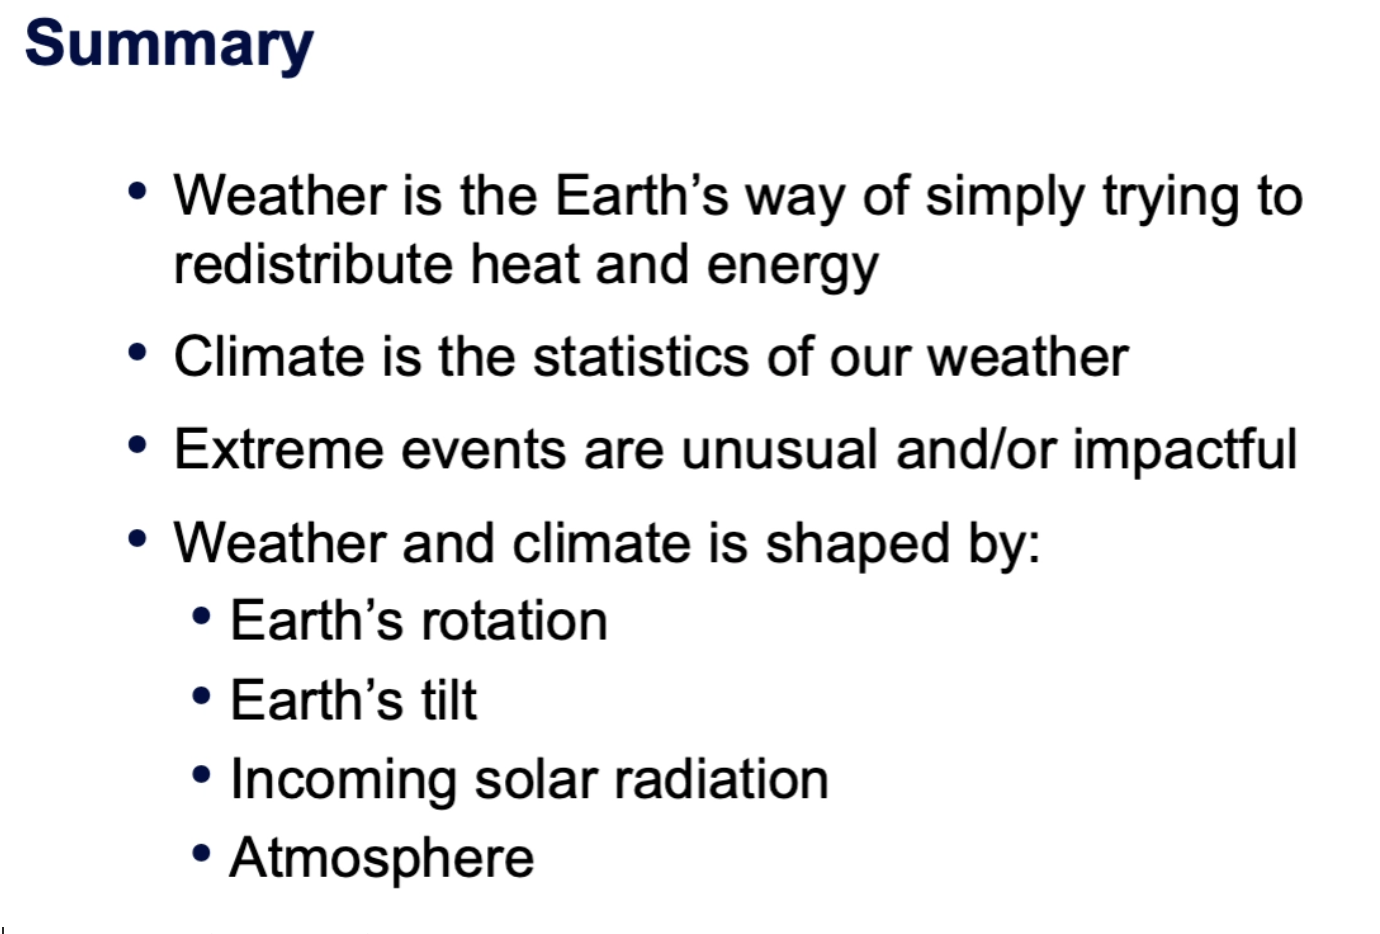
what is an extreme event?
UNUSUAL
IMPACTFUL
We need the sun!
without sun earth’s temp would stabilise around -240 degrees in a few million years
surface of ocean would freeze, plants would die
We need the atmosphere!
without it temp would be -18 degrees
but no protection against earth’s incoming radiation
really cold nights and hot days, heat energy is not trapped
no sound!
no oceans
no blue sky, no red sunsets
we need earth rotation!
what rotates fastest?
or really hot, humid equator and freezing poles (steady decrease)
fun fact equator rotates fastest
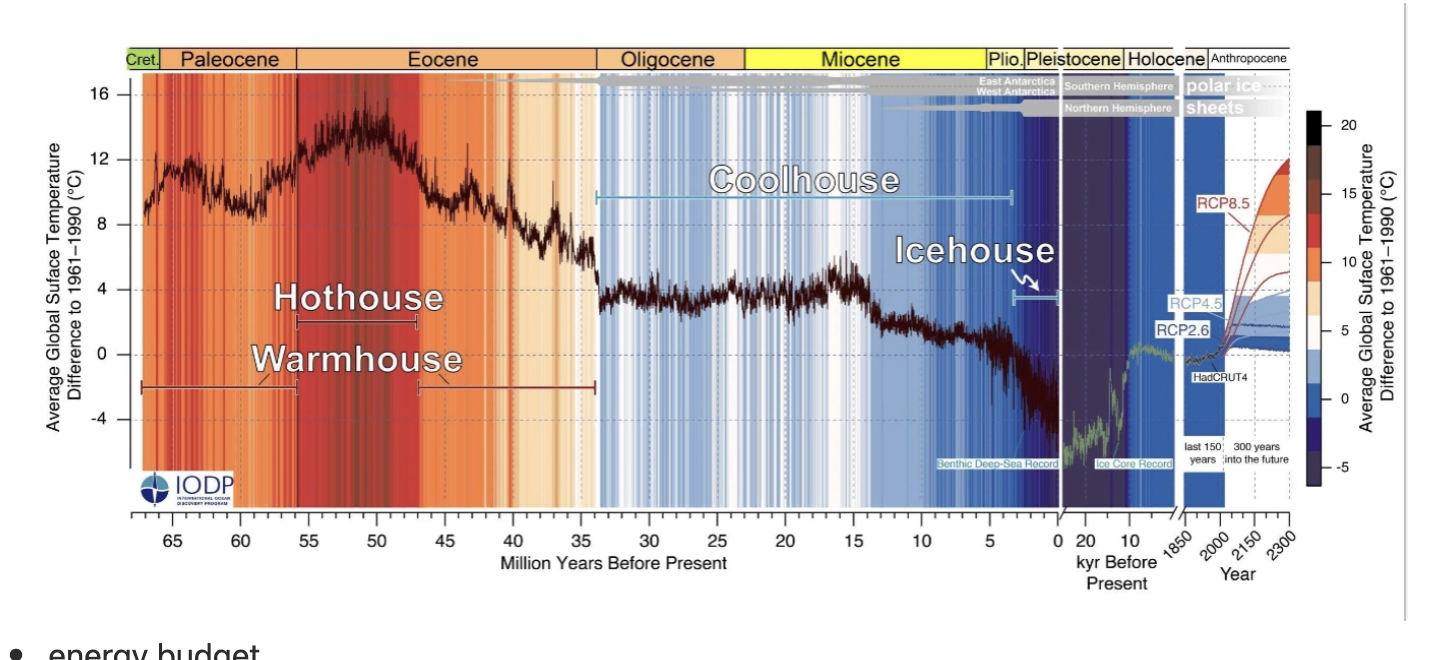
History of the climate and future projections
energy budget
what comes in: the sun (we receive 0.000000045% of the energy emitted by the sun! → still a lot)
annual average solar irradiance (i.e. solar constant) = 1361 Wm-2!
+- 3% variations throughout year because of elliptical orbit
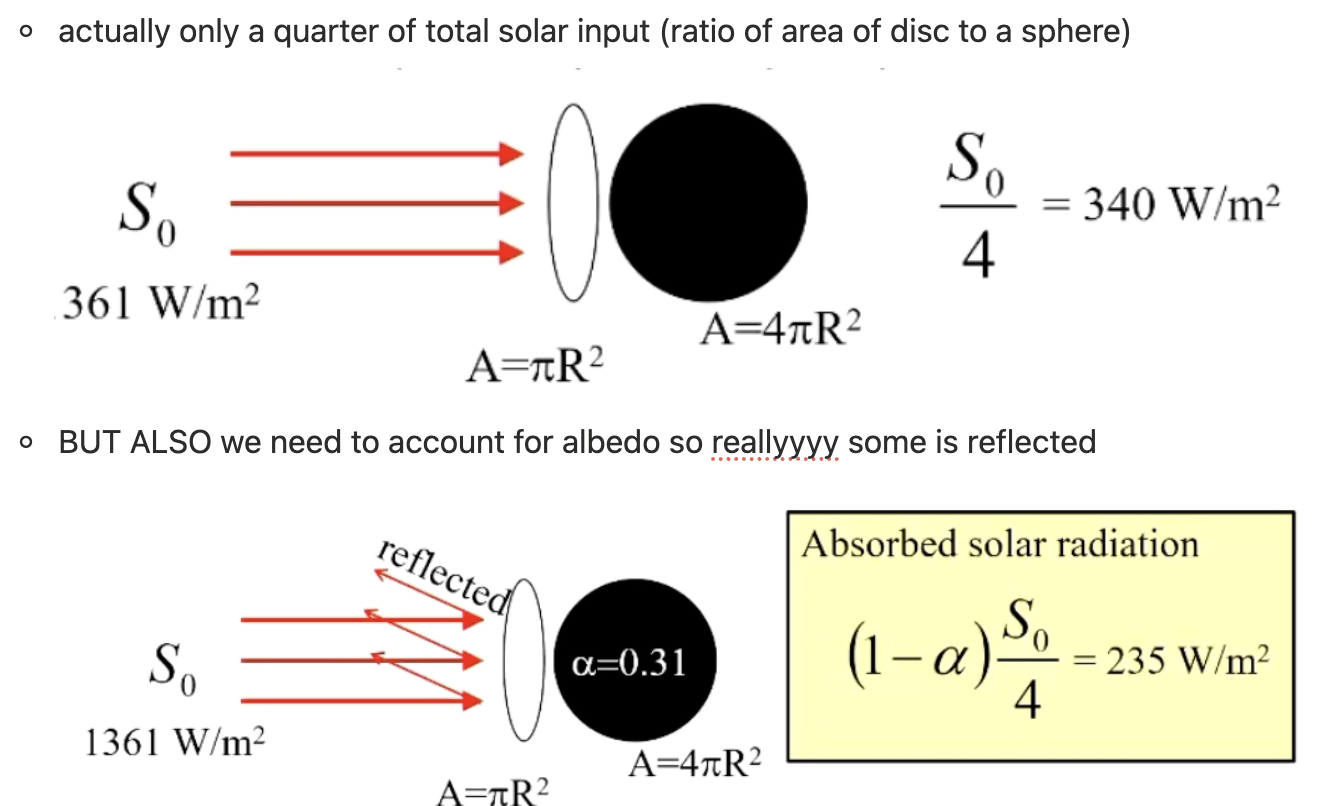
(average) total solar irradiance → maximum amount of energy delivered to earth from the sun BUT
but only half of the earth is lit by the sun at once
and most of the sun’s rays hit earth on an angle
so we divide 1361 Wm-2 by 4
taken from (the area of a disc/the surface area of a sphere)
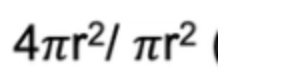
global average is closer to 340 W/m-2
cycles of incoming energy
can lead to small changes in climate that have a flow-on feedback effect
seasonal cycle
our weather and ocean systems do a lot of work moving the energy from the northern to southern hemisphere as needed and vice-versa!
solar activity cycle
11 years
solar flares → hot
sunspots → magnetic interactions cool different spots of the surface of the sun by about 1800 degrees
from 6000 to 4200
increases global temp by like 0.1 degree (hypothesis), so doesn’t really have any effect
we’re currently coming off a solar maximum, high frequency of aurora events
energy budget graphic
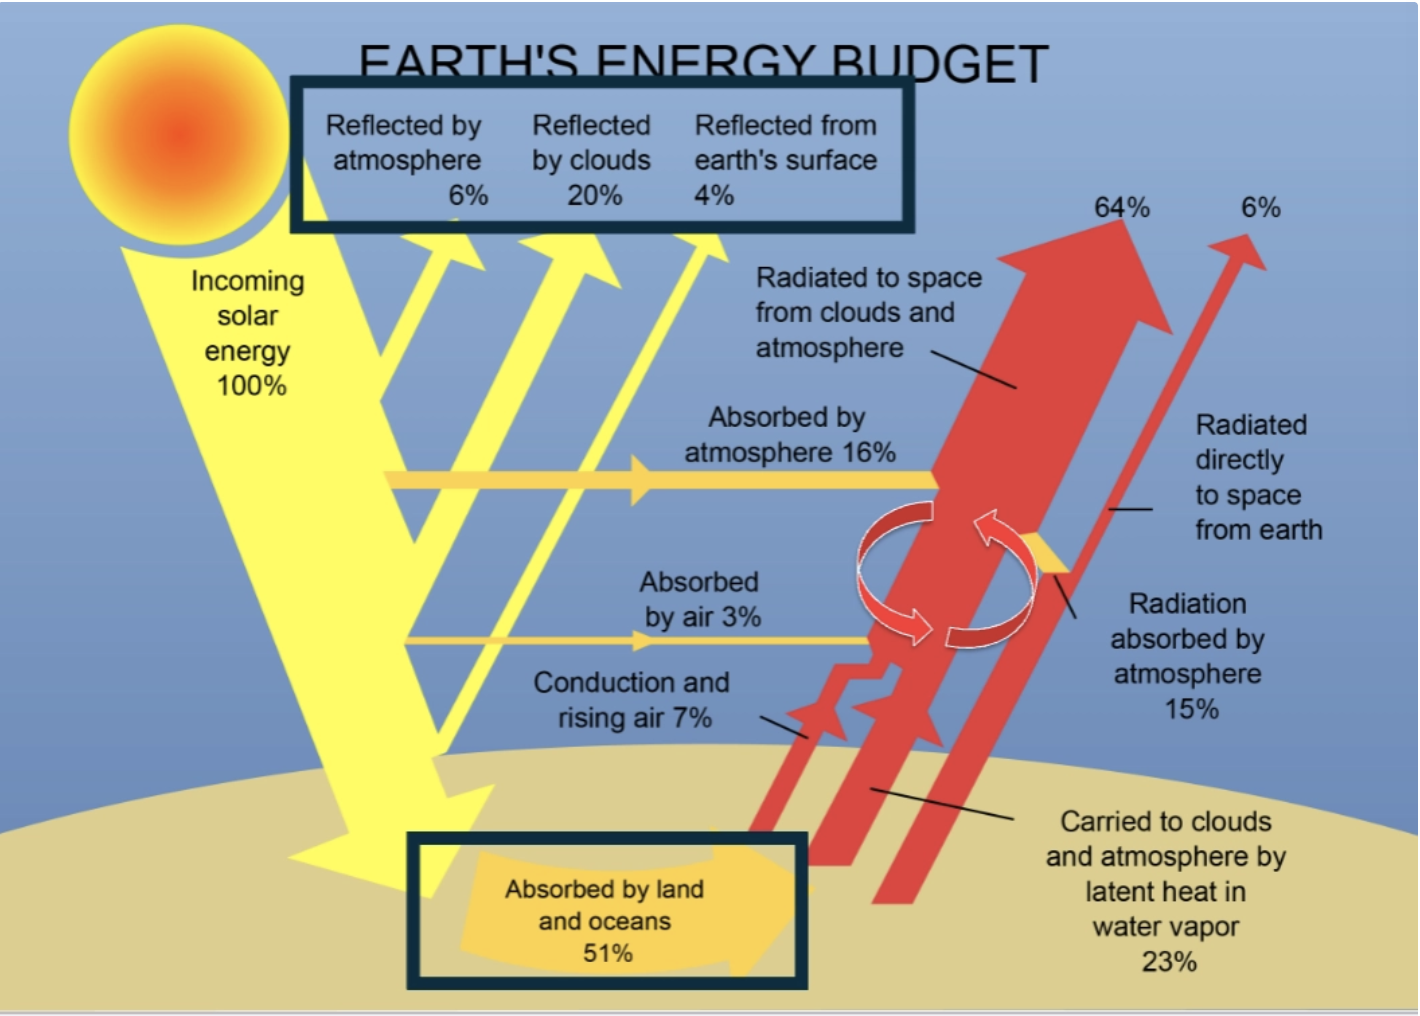
REFLECTED
atmosphere
clouds
surface
ABSORBED
air
atmosphere
then reflected
CARRIED TO CLOUDS
latent heat from surface
then absorbed by atmosphere
or radiated directly
planetary albedo
clouds and aerosols (dust, dirt, ash, pollen, water vapour in volcanic ash, sea salt (big CCN btw!!), soot, etc.)
2023 was hottest year on record, even though a La Nina event
but shipping industry changed regulations to make fuel a lot cleaner → fewer aerosols, less sunlight reflected out into space
global temperature and volcanoes → make things distinctly cooler
aerosols’ effects
directly increase albedo caused by dust (pollution)
indirectly increase the number of CCN making cloud drops smaller for the same amount of water, which increases albedo (but is tricky to calculate)
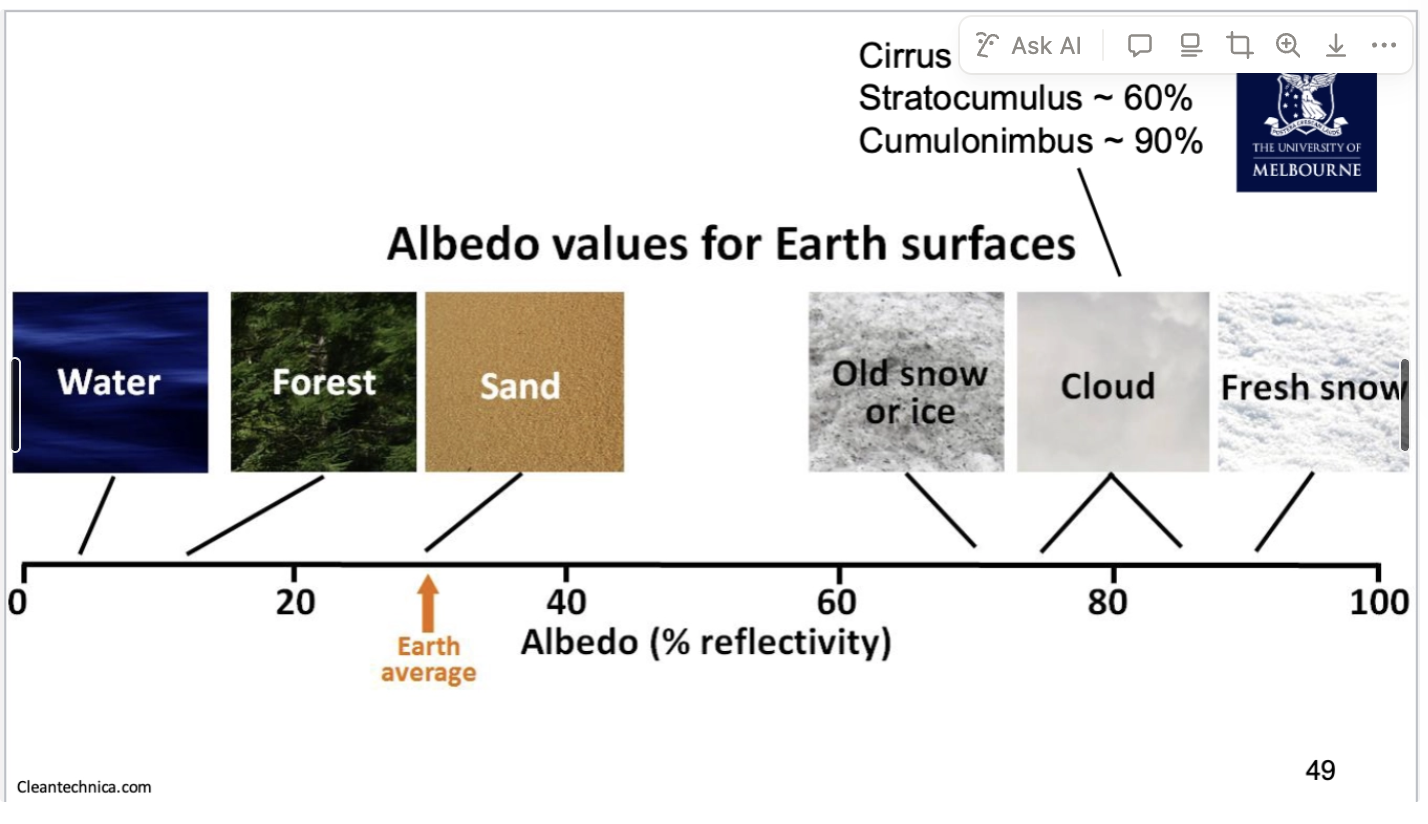
albedo values for different materials
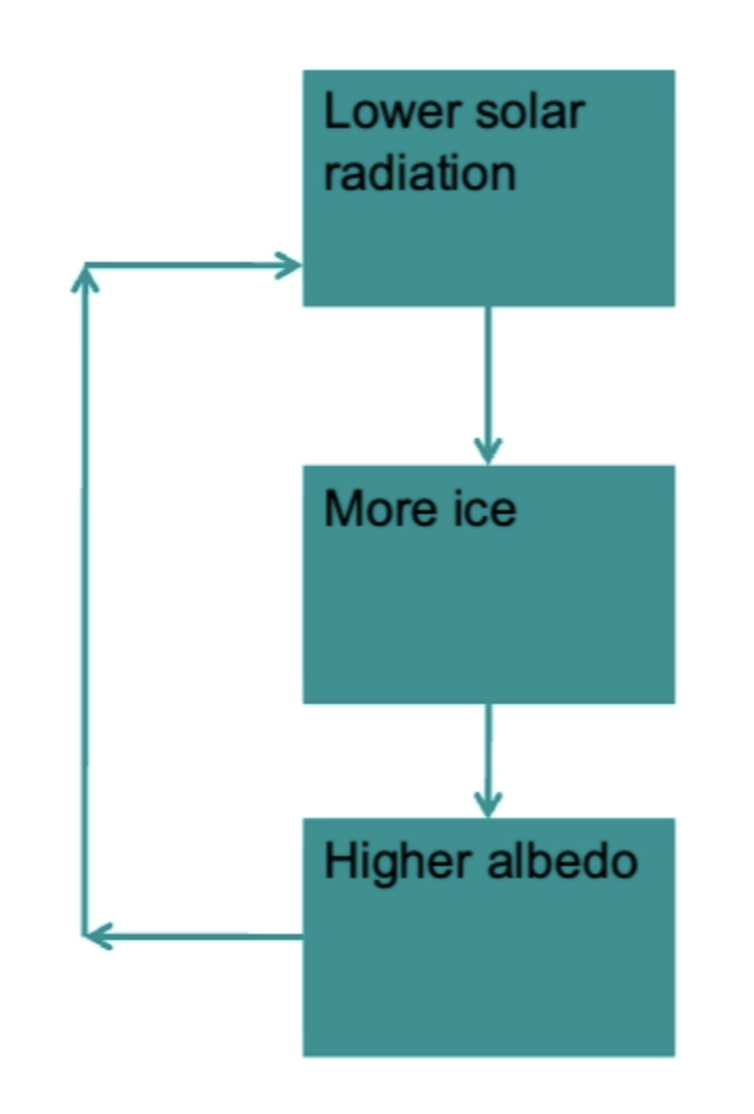
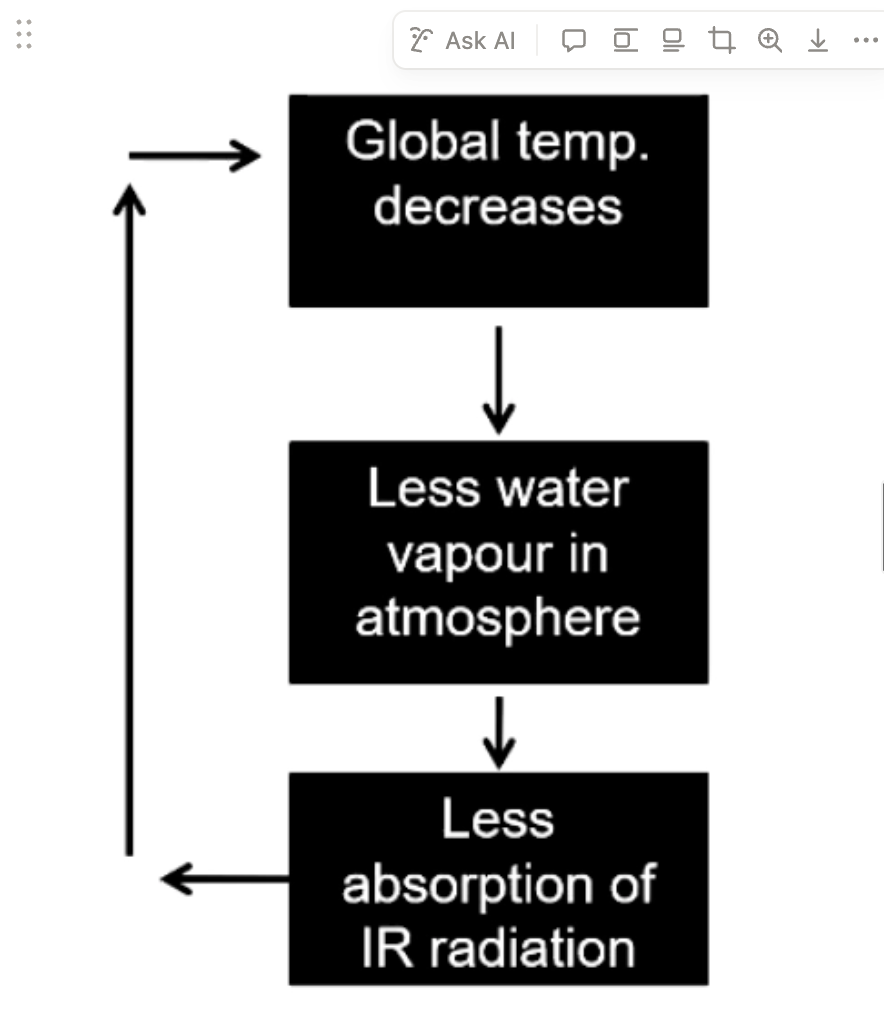
positive feedback loop
UNSTABLE system
like a ball on a hill → if you push it, things will change and change will amplify
e.g. ice-albedo effect
negative feedback loop
→ STABLE system
if you push it things will return to normal
greenhouse duh
things like CFCs and CO2 absorb the longwave radiation re-emmitted by the earth, and break up O3 which protect atmosphere
summary of weather
geostationary
satellites orbit earth once per day so seems like they’re staying still
but doesn’t work over the poles lol
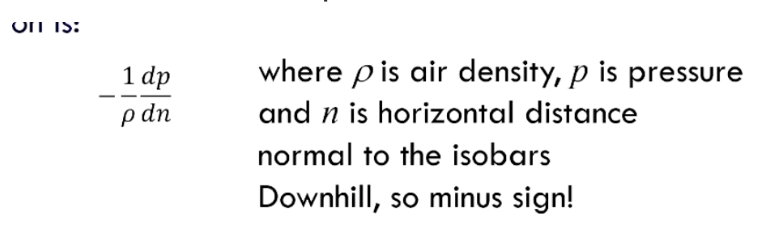
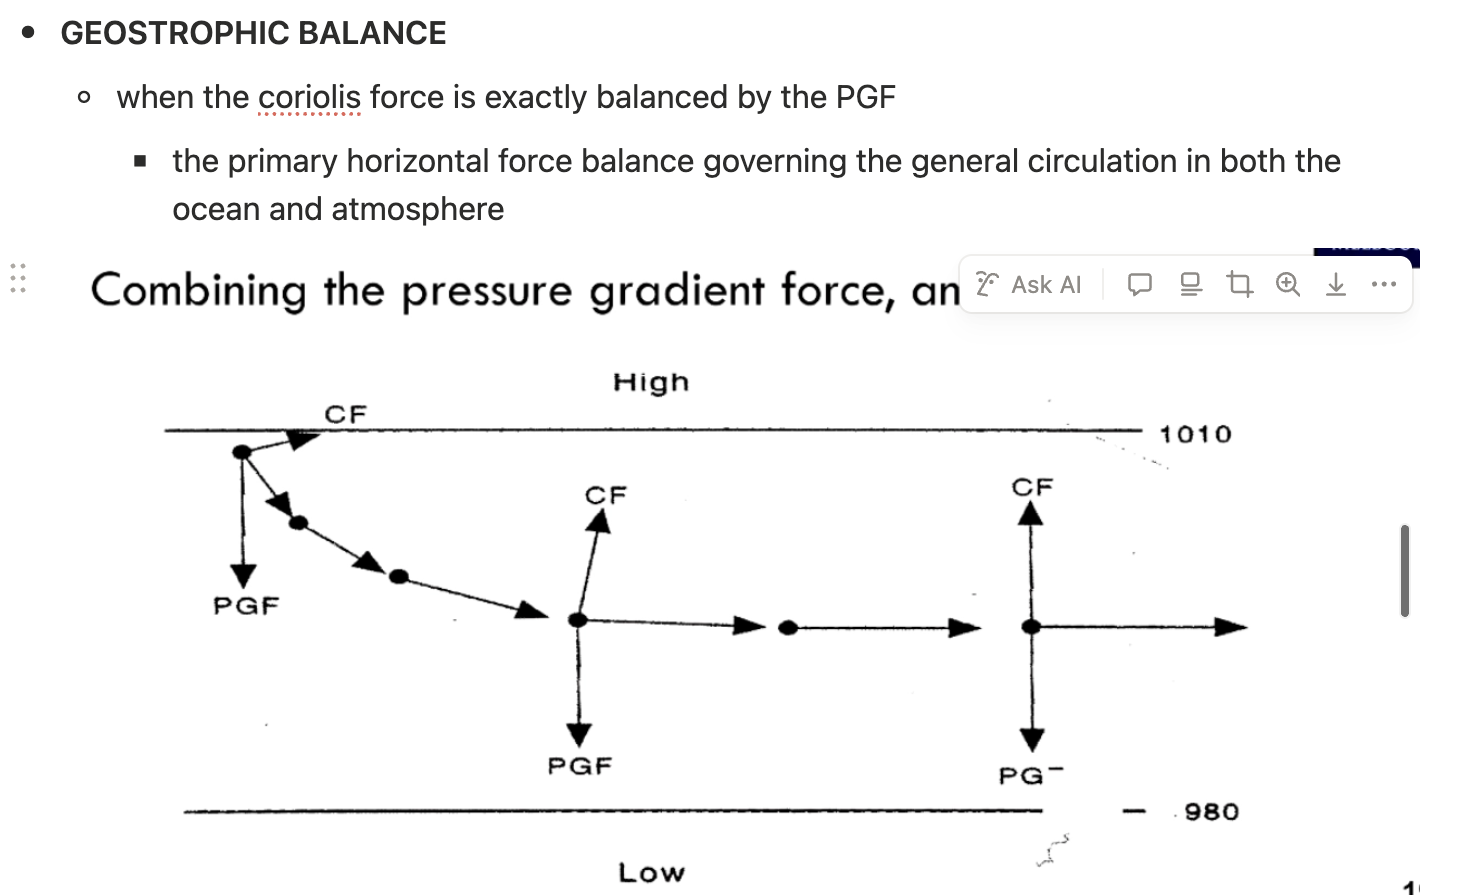
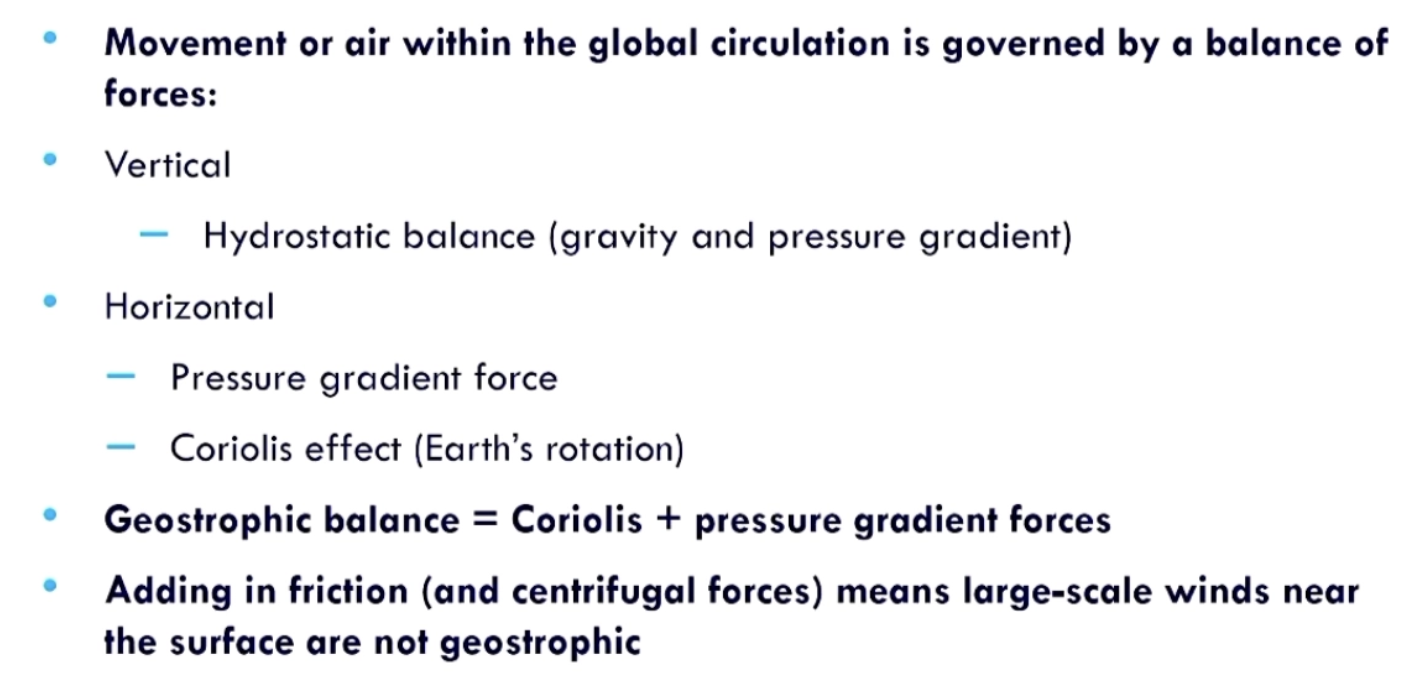
PGF
proportional to the number of isobars per unit distance (gradient)
change in pressure over a particular distance
density w equation
kg/m3 and can be thought of like acceleration → how much would air like to accelerate due to differences in pressure
old mate with rotation
fluid dynamics principles
conservation of mass
amount of air, water, etc.
conservation of energy
temperature, kinetic
conservation of momentum
wind
fluid includes atmosphere
atmospheric structure
tro
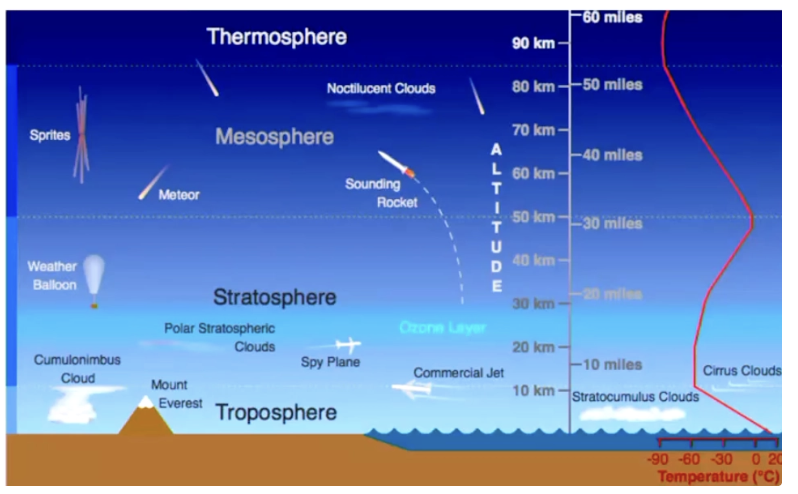
posphere → 80% of the atmosphere’s mass, whole land surface, all water vapour
tropopause → separation line between troposphere and stratosphere
higher in equatorial regions and lower at the poles
due to the convection and surface heating in the tropics thickening the layer where there is air turning
temperature generally decreases with height but very near the surface this isn’t always the case, often due to overnight surface cooling.
inversion → increasing temperature with height
stratosphere → 20% of the atmosphere’s mass
much drier than the troposphere → not much water vapour
WARMER → ozone absorbs shortwave radiation from the sun
as the temperature rises with height this layer is very stable → not a lot of vertical motion, doesn’t move down
stratospheric ozone = good!
in tropical regions, convection can pass through the tropopause (marked by the anvil in cumulonimbus clouds) and into the stratosphere → how moisture gets there
or volcanic eruptions
nacreous clouds form in the stratosphere in polar regions
due to chemical interactions and waves generated in the lower atmosphere which propogate upwards
mesosphere
where meteors burn up
much lower ozone concentrations in this layer compared to the stratosphere → temperatures decline with height again
thermosphere
temperatures rise with height as ions and electrons are excited by solar radiation and there is greater absorption at higher levels
temperature starts to become academic as there are fewer particles (but they are high energy
above about 100km there is no effective mixing. this can be used as a definition of where space begins.
ionosphere → parts of the thermosphere and mesosphere
in this layer atoms are stripped of their electrons so they become charged
this is the consequence of absorption of energy due to cosmic rays and solar winds → aurora borealis and aurora australis
green: excited oxygen between 150 and 200km
red: excited oxygen above 250km
blue/purple: excited nitrogen below 100km
Composition of the earth’s atmosphere
78% nitrogen
21% oxygen
~0.9% argon
trace amounts of water vapour (up to 1%), CO2, and other gasses, methane, ozone, nitrous oxide
aerosols → pollutants and other particulates
molecular weight of atmosphere is pretty close to nitrogen ~ 28.97 (average of all the elements found approximately)
thinking about air pressure
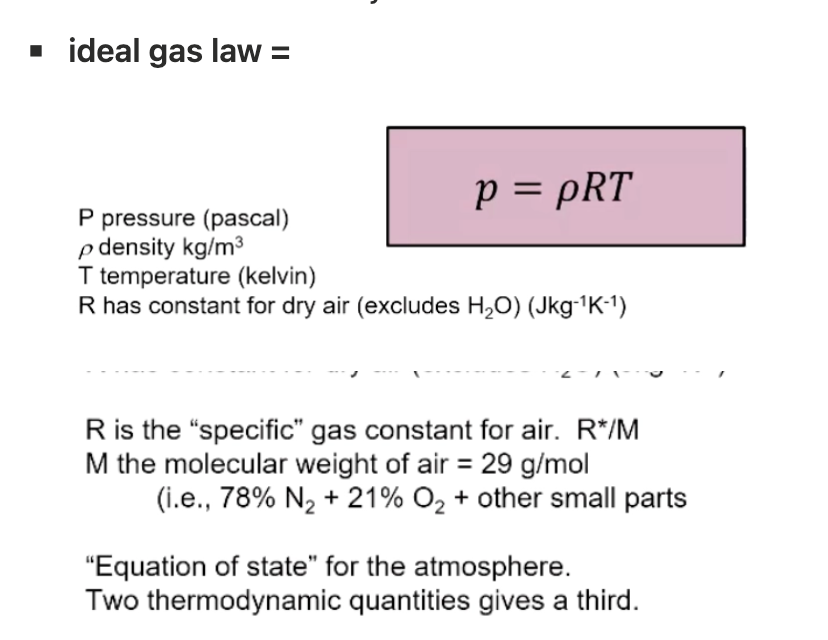
ideal gas law
consider air as an ideal mixture of gas and an ideal gas
molecules don’t really interact
pressure equations
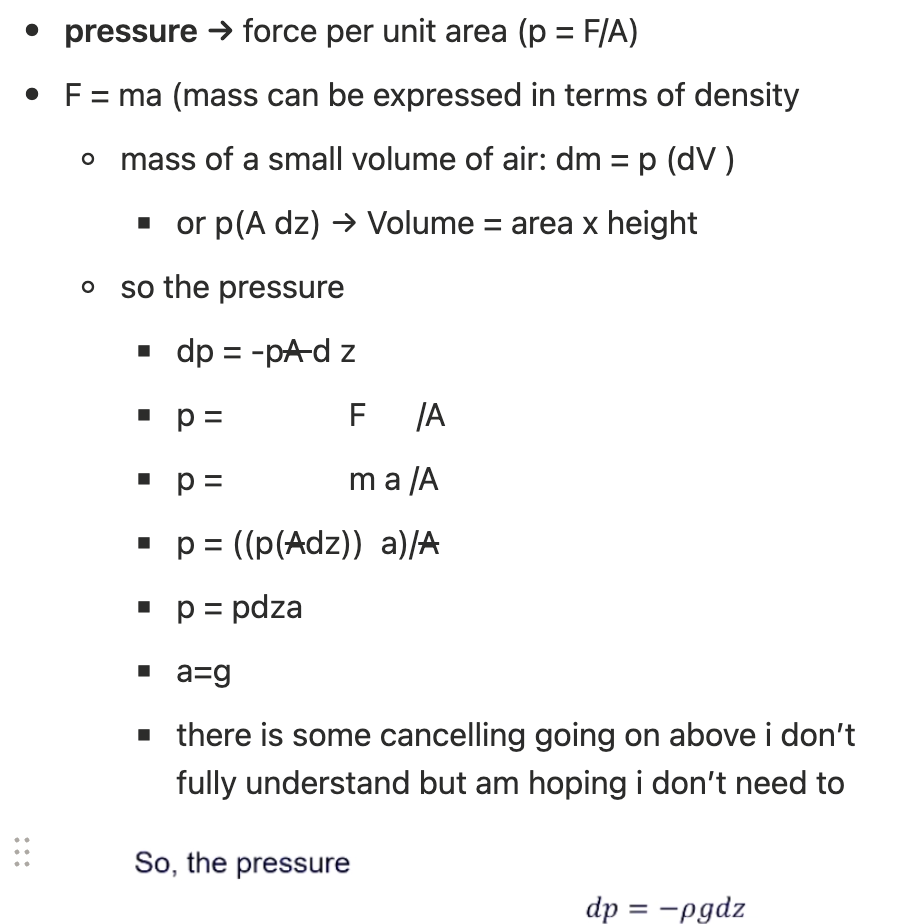
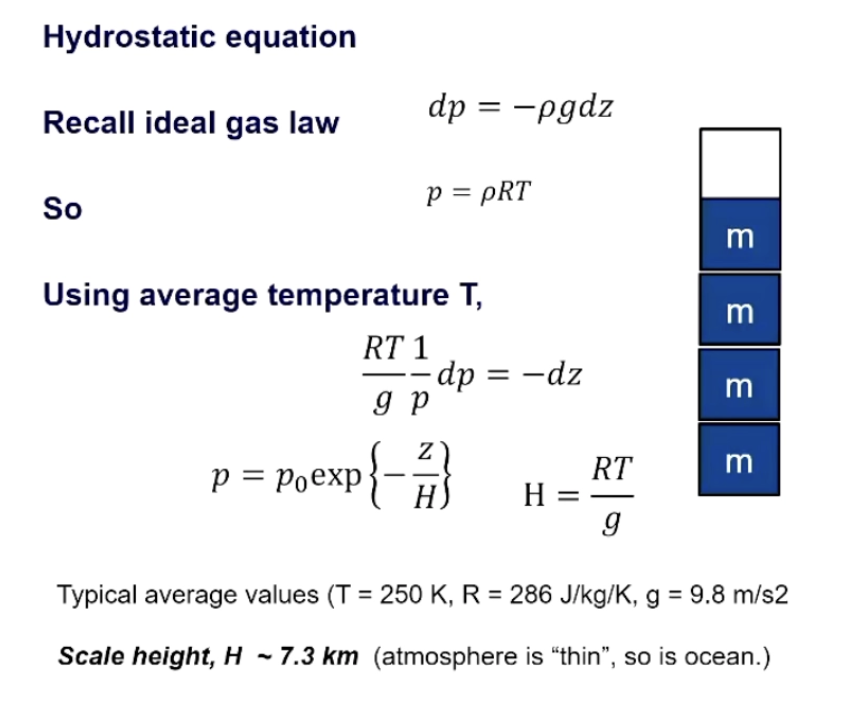
hydrostatic equation
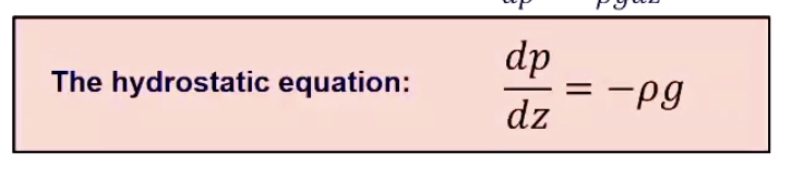
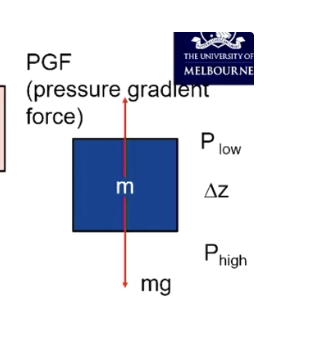
hydrostatic
high pressure and low pressure acting on the air are equal and therefore the air is not being pulled up or down
at a constant temperature, we can
relate pressure changes to changes in height in the atmosphere (exponentially related to height)
can use this to build an altimeter!
combining hydrostatic equation and ideal gas law equation
force balance equation
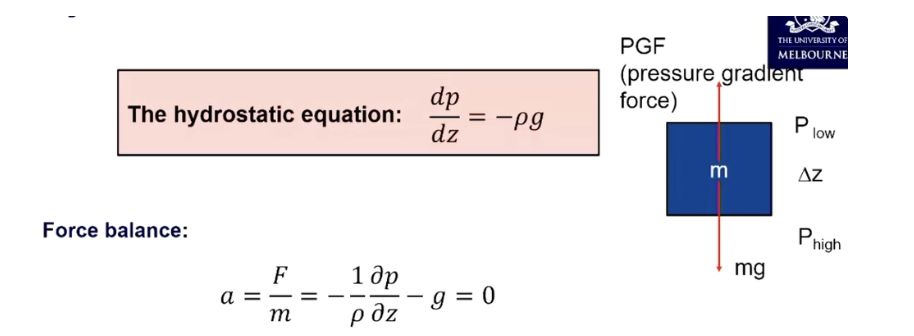
means vertical motion is constant → again, hydroSTATIC
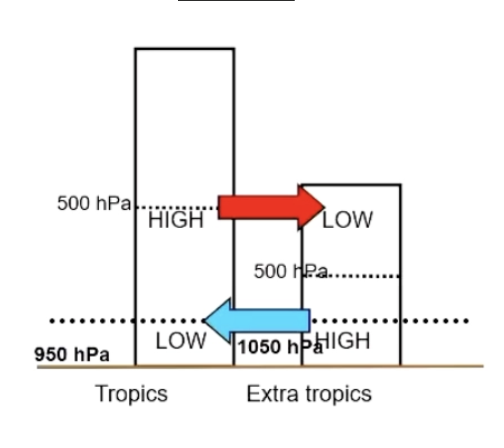
reasons for thermally-driven overturning circulation!
if pressures are fixed in the top and bottom of the atmosphere, the only thing that will determine height of column of air is temperature
(basically, high- and low-pressure systems self-explanatory but just backing it up with some maths)
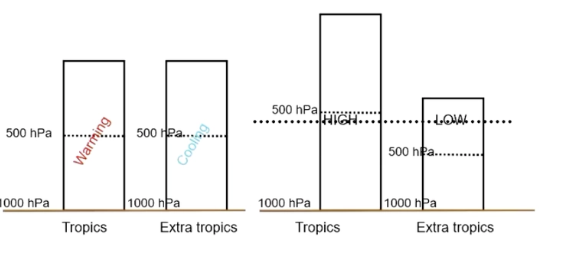
halfway point is still 500 for both!
now there is a difference in pressure for both columns of air at the same height!!
air will move from high to low
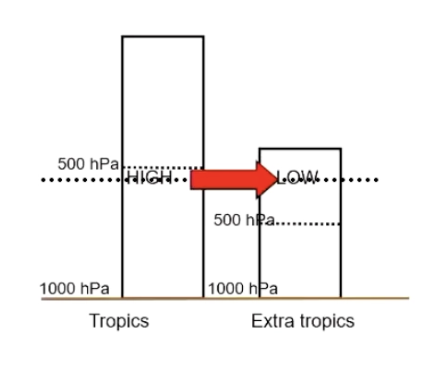
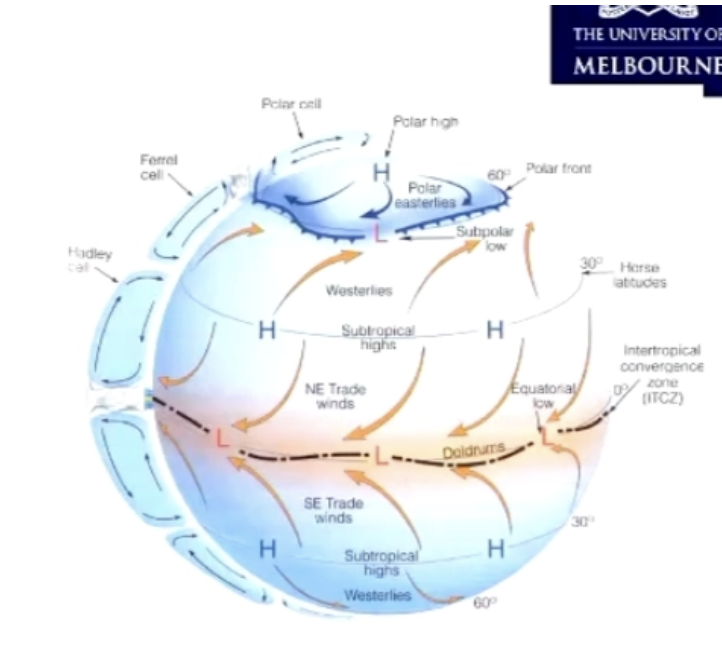
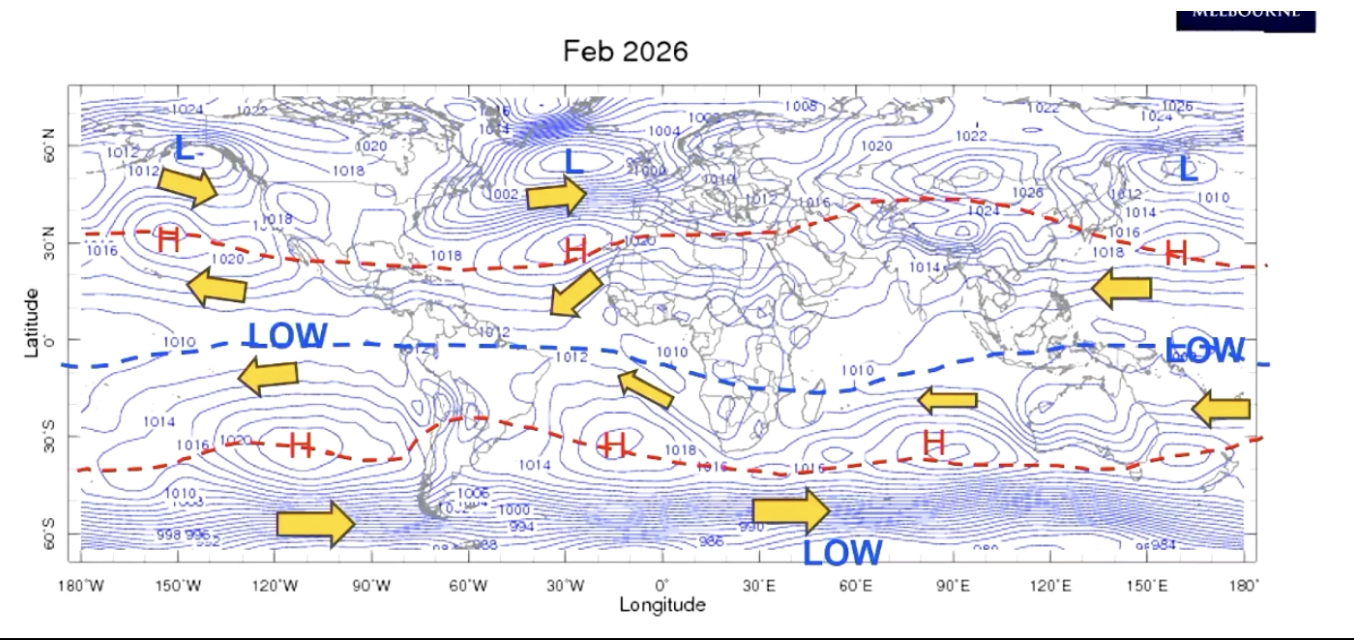
air moves out of the tropics
therefore tropics will have less air → lower pressure
so now there is a DIFFERENT pressure difference at the bottom → air will move back!!!!!
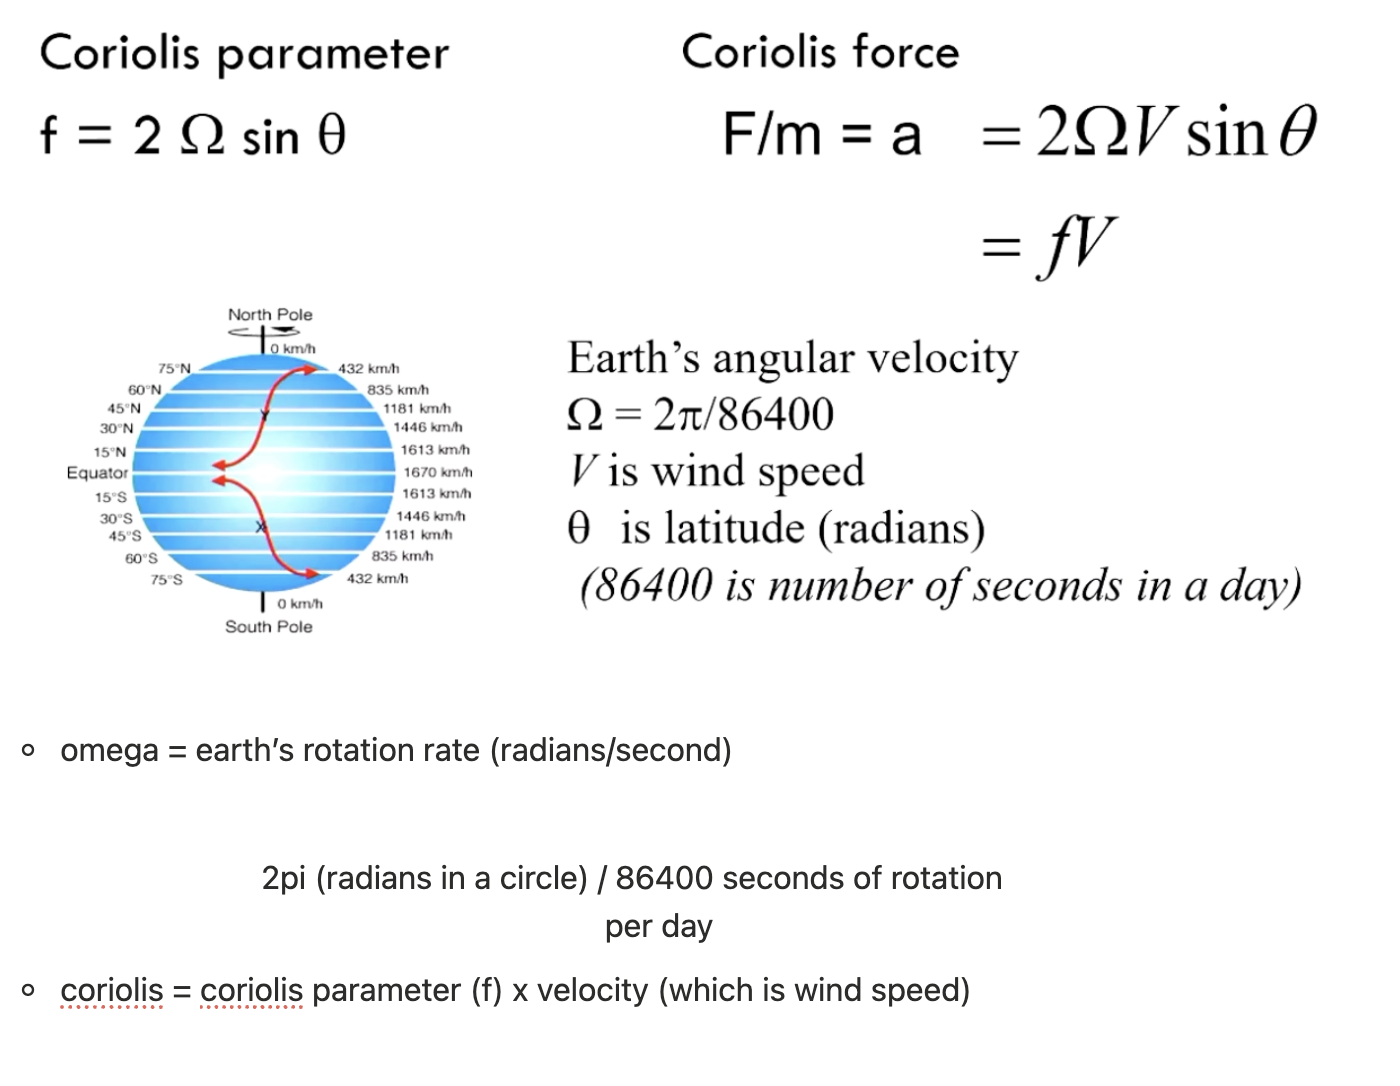
CORIOLIS EFFECT!
where is it the greatest?
coriolis force compensates for f=ma not accounting for rotation
coriolis force:
is greatest at the poles (local vertical aligned with earth’s rotation)
is zero at the equator (local vertical not aligned with rotation)
acts perpendicular to wind direction (right in NH, left in SH) → towards equator, essentially
coriolis force: the equations
what does theta and omega stand for?
understanding coriolis moving towards the poles
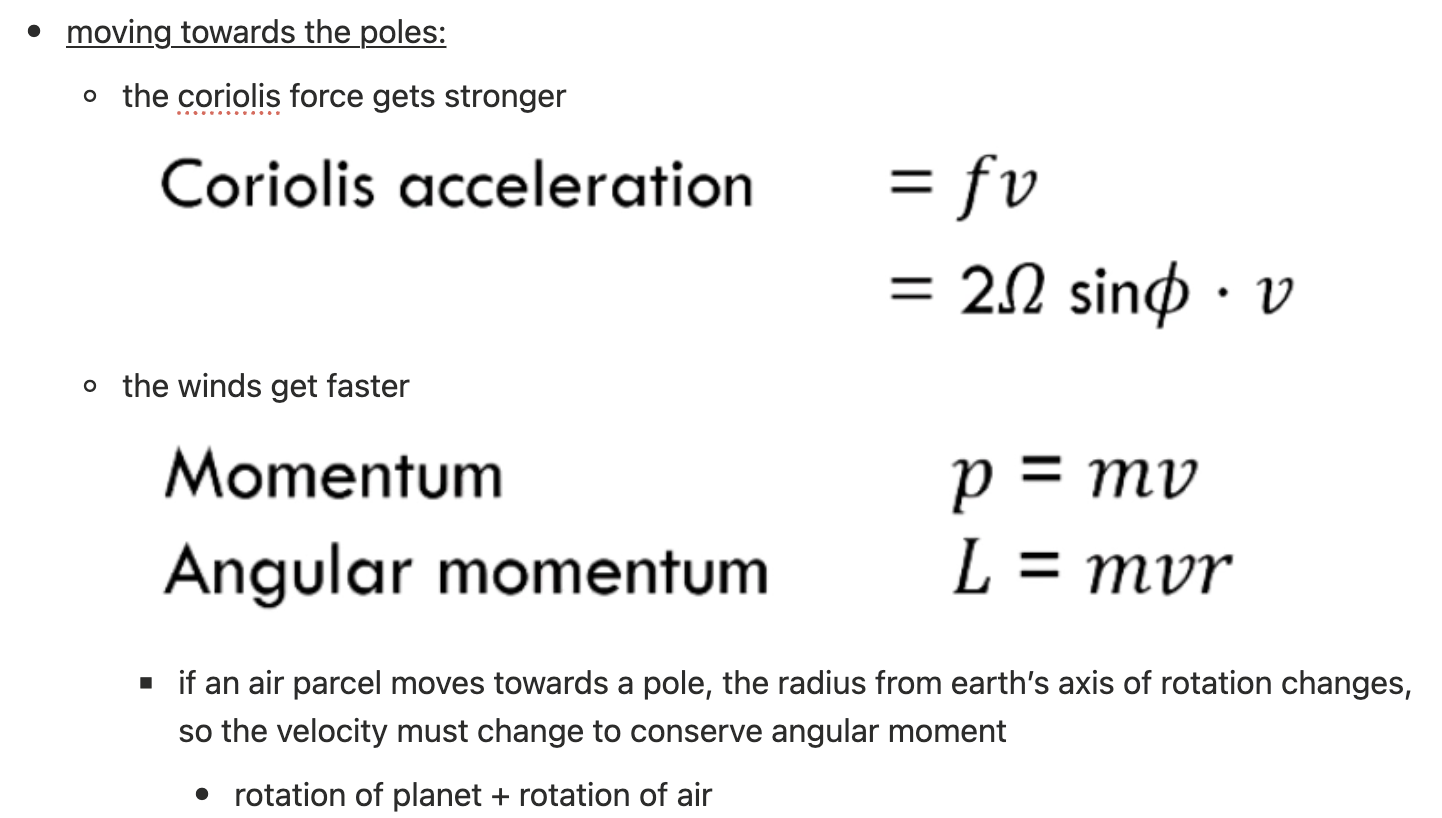
velocity increases as radius increases
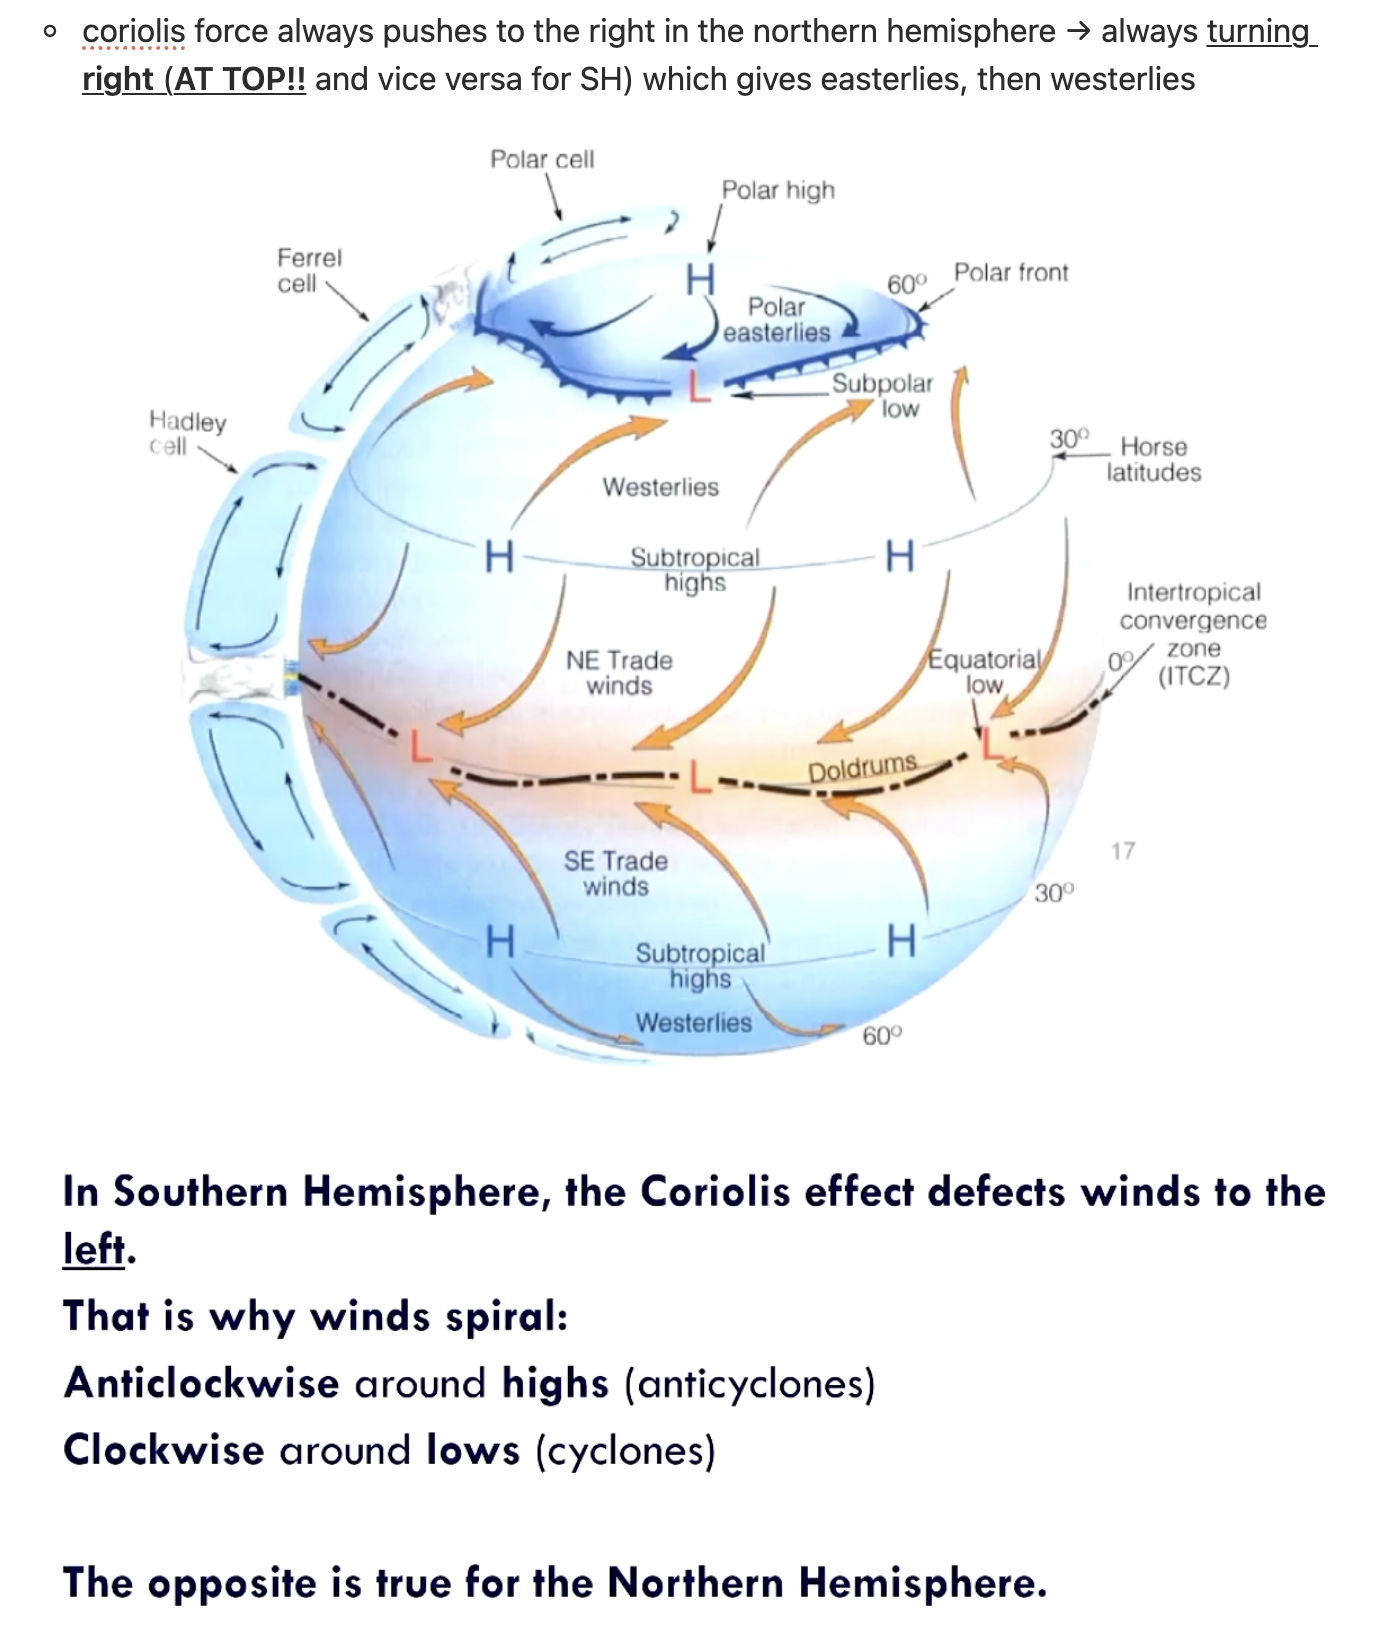
old mate cells!!
model of wind moving parallel to isobars flaws (4 things)
very good approximation to the actual wind in the middle troposphere (about 5000m or higher)
very good when no friction, and when isobars are straight.
but:
only good for large-scale approximation
not great when isobars are curved (they usually are)
apparent centrifugal forces must be considered too!
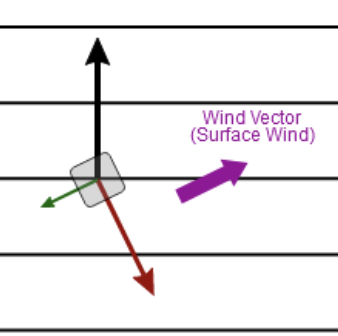
it’s not great at the earth’s surface
friction impact (think of last sem)
geostrophic balance
looking at cells/circulation globally
summary trust
vertical forces
horizontal forces
geostrophic balance
near surface?
you can measure rainfall with satellites!!
water/precipitation reflects microwaves back to satellites
microwaves make water move around a bit which shoots radiowaves back
what will climate change mean for atmospheric circulation/precipitation?
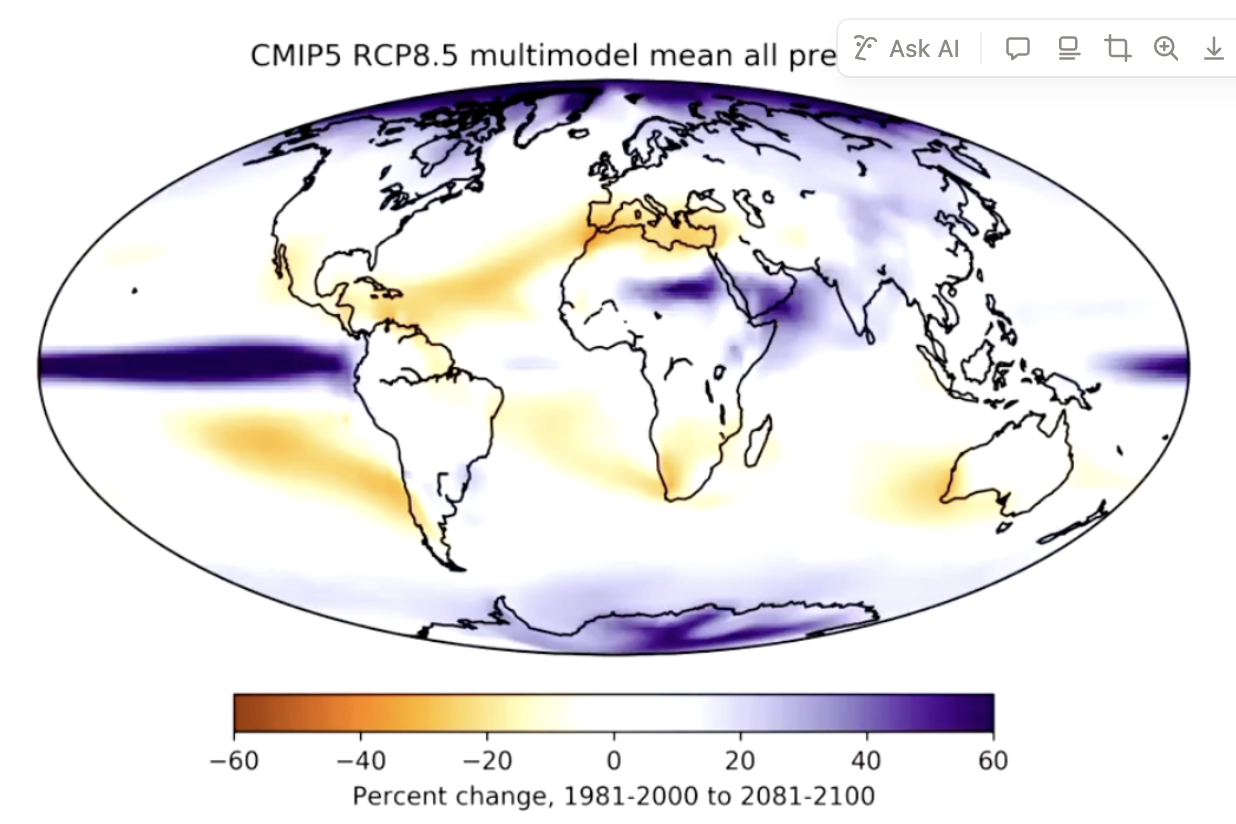
future areas with biggest increases in temperature!
arctic is warming more rapidly than other places → very reflective things (ice and snow) are being removed, so heating is accelerating faster than other places
land tends to warm more rapidly
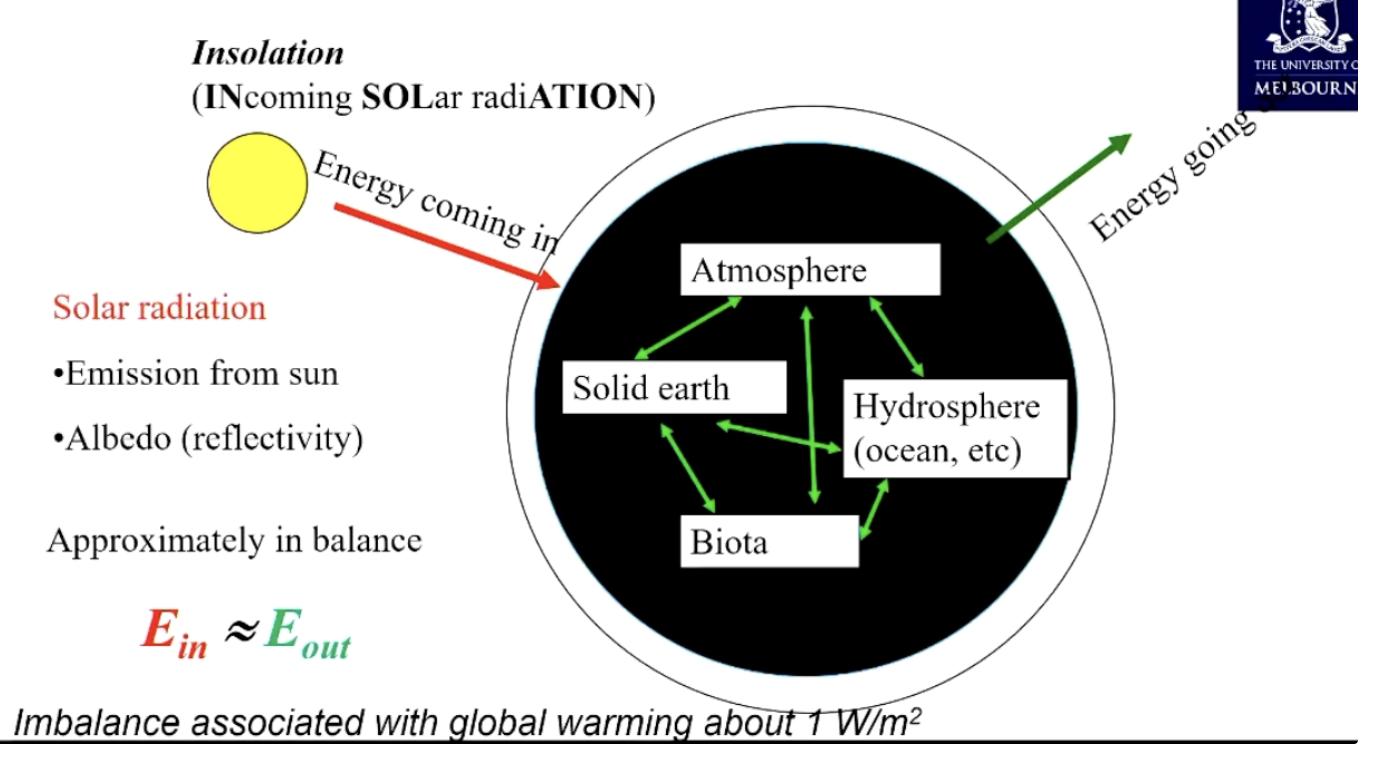
insolation
what is it?
= solar constant (radiation coming from sun)
amount of incoming solar radiation perpendicular from the sun
determined by level of radiation from sun and our distance from sun
~1361 W/m^2
when something has temperature, it
emits radiation (not just a particular radiation, a whole spectrum of light)
blackbody curve
can perfectly absorb all the energy that lands on it and perfectly emit all the energy possible
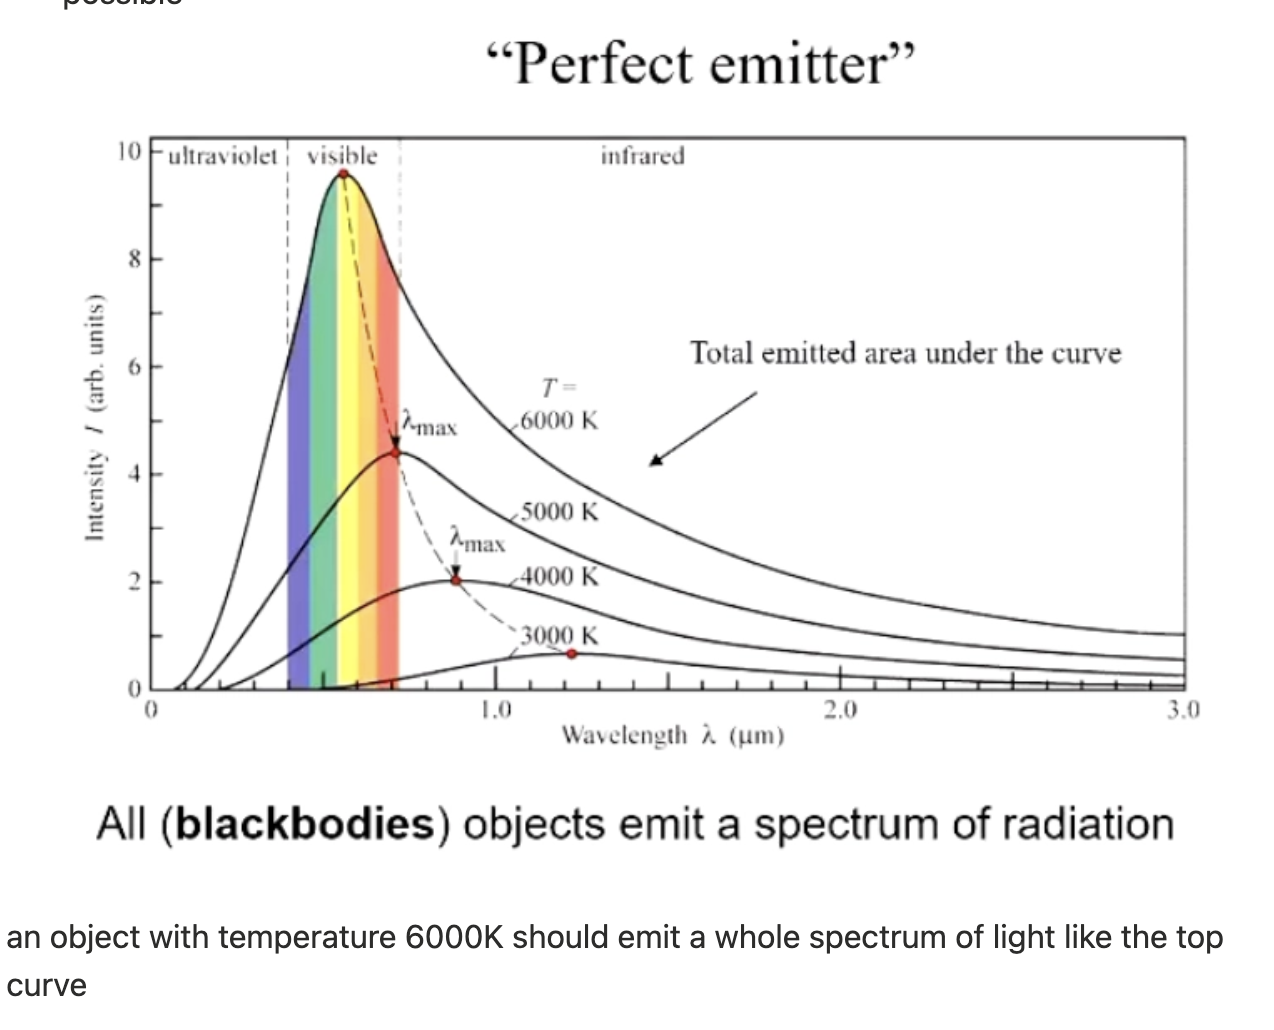
notice! brightest part at top of the curve is YELLOW
if an object is only 3000K, most intense light is a lower wavelength = infrared (flattest curve, smallest area underneath)
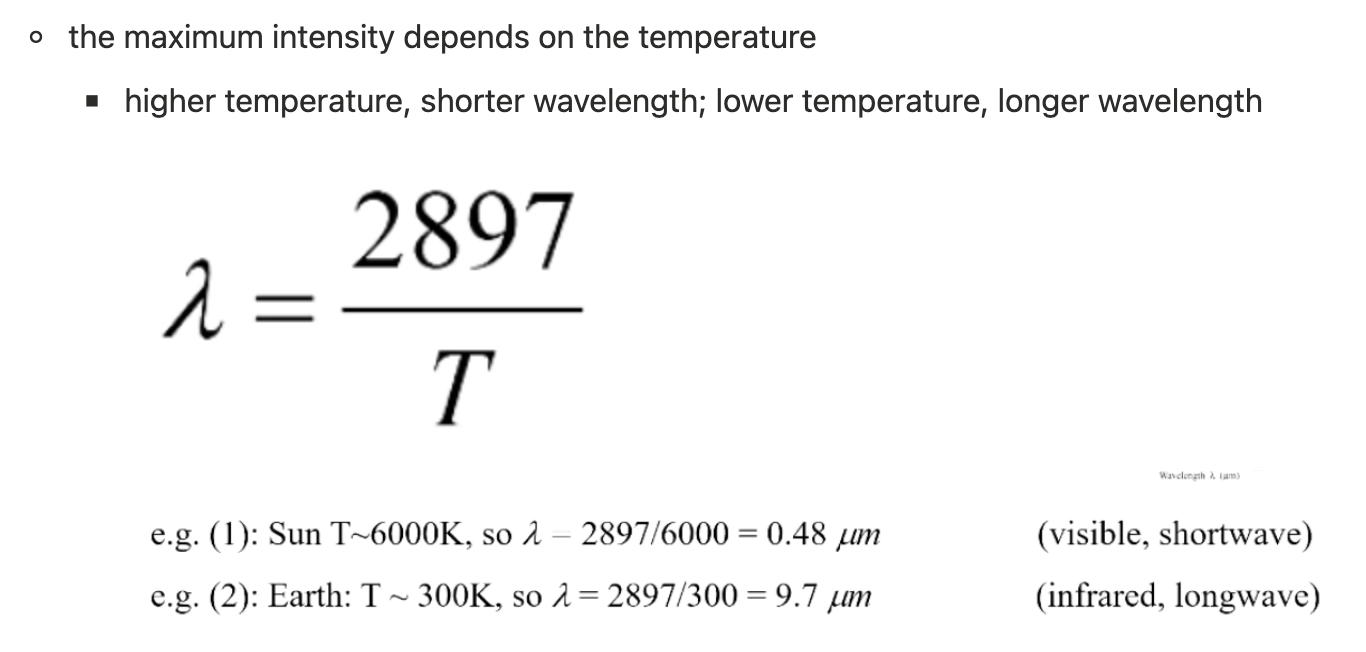
Wien’s displacement law equation
Stefan-Boltzmann law
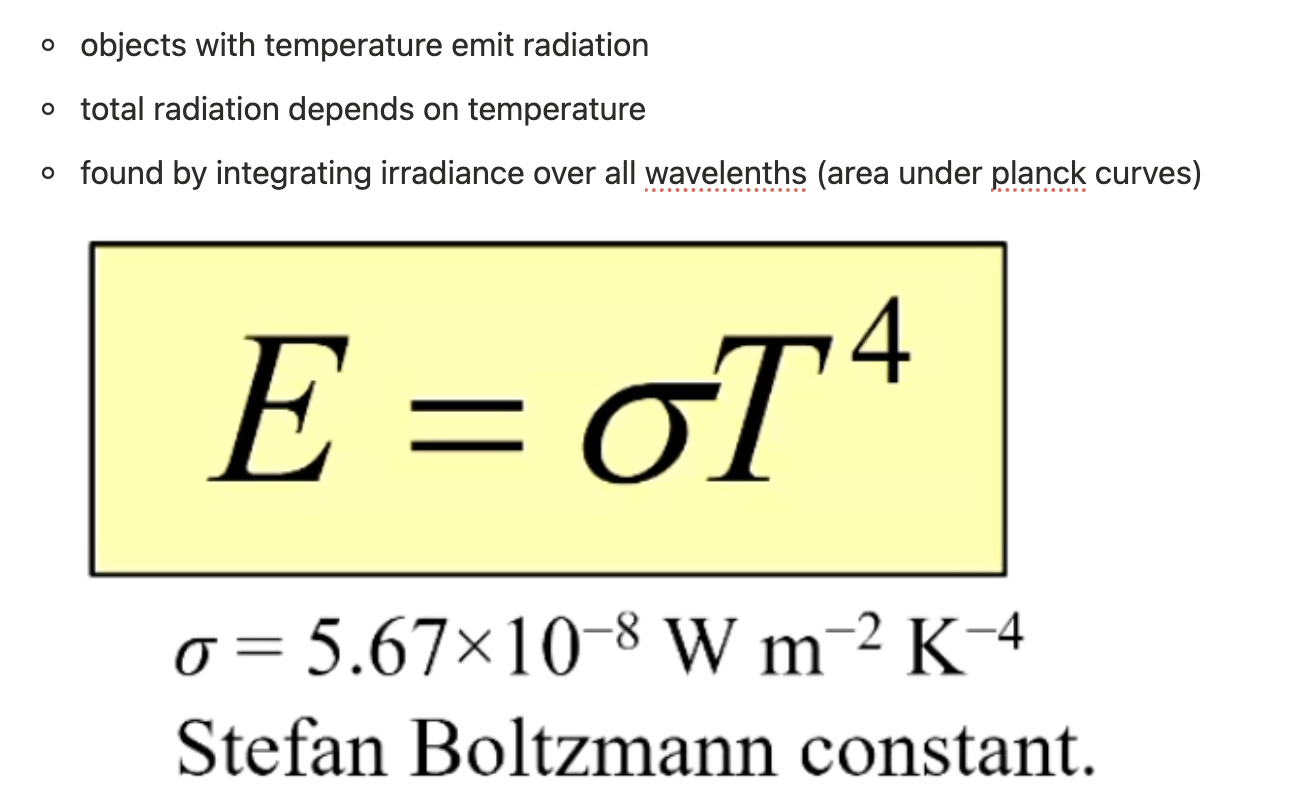
finding total radiation
solar radiation absorbed is only on the sunny side!
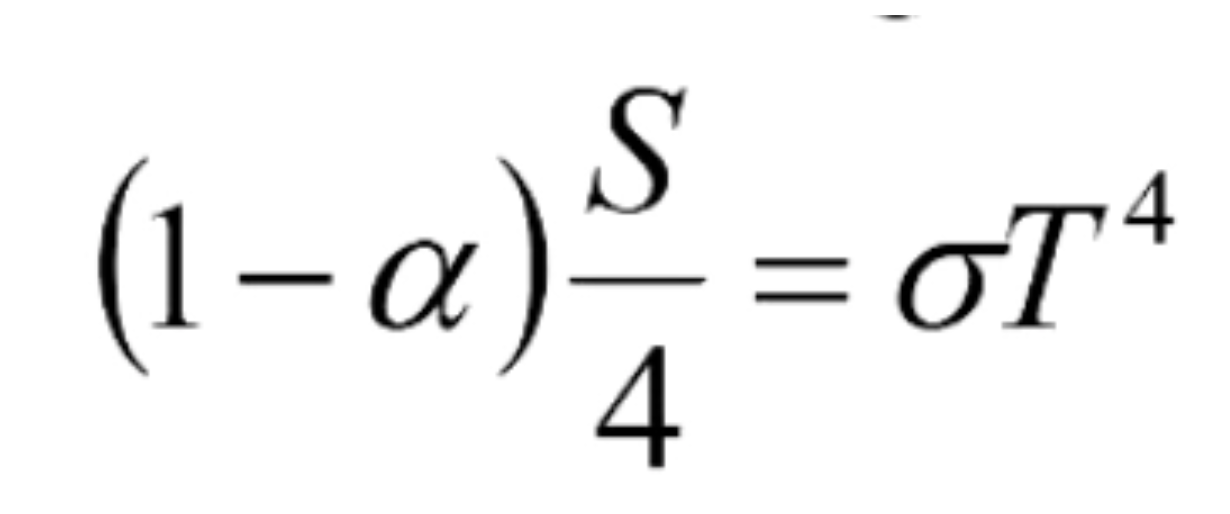
radiative balance
solar input of energy on sunny side BUT emission loss of energy in all directions (!!)
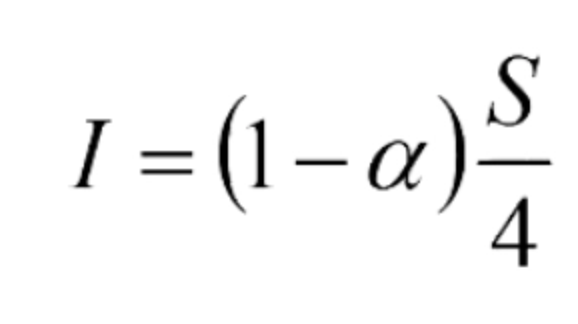
so for balance, incoming = outgoing
so if we know the albedo, we can figure out the radium equilibrium temperature because we know the solar constant! (basically just combining two above equations)
how is surface temp shaped by radiation
the boltzmann feedback requires the emission temperature to be near equilibrium. surface temperature adjusts to match
strength of the greenhouse effect
the difference between the radiative equilibrium temperature and the surface temperature
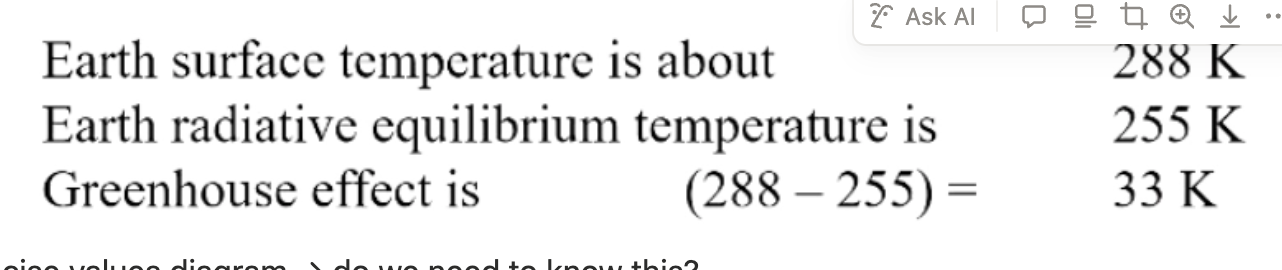
balance differs by 1W/m^2 ****and that is what is causing global warming
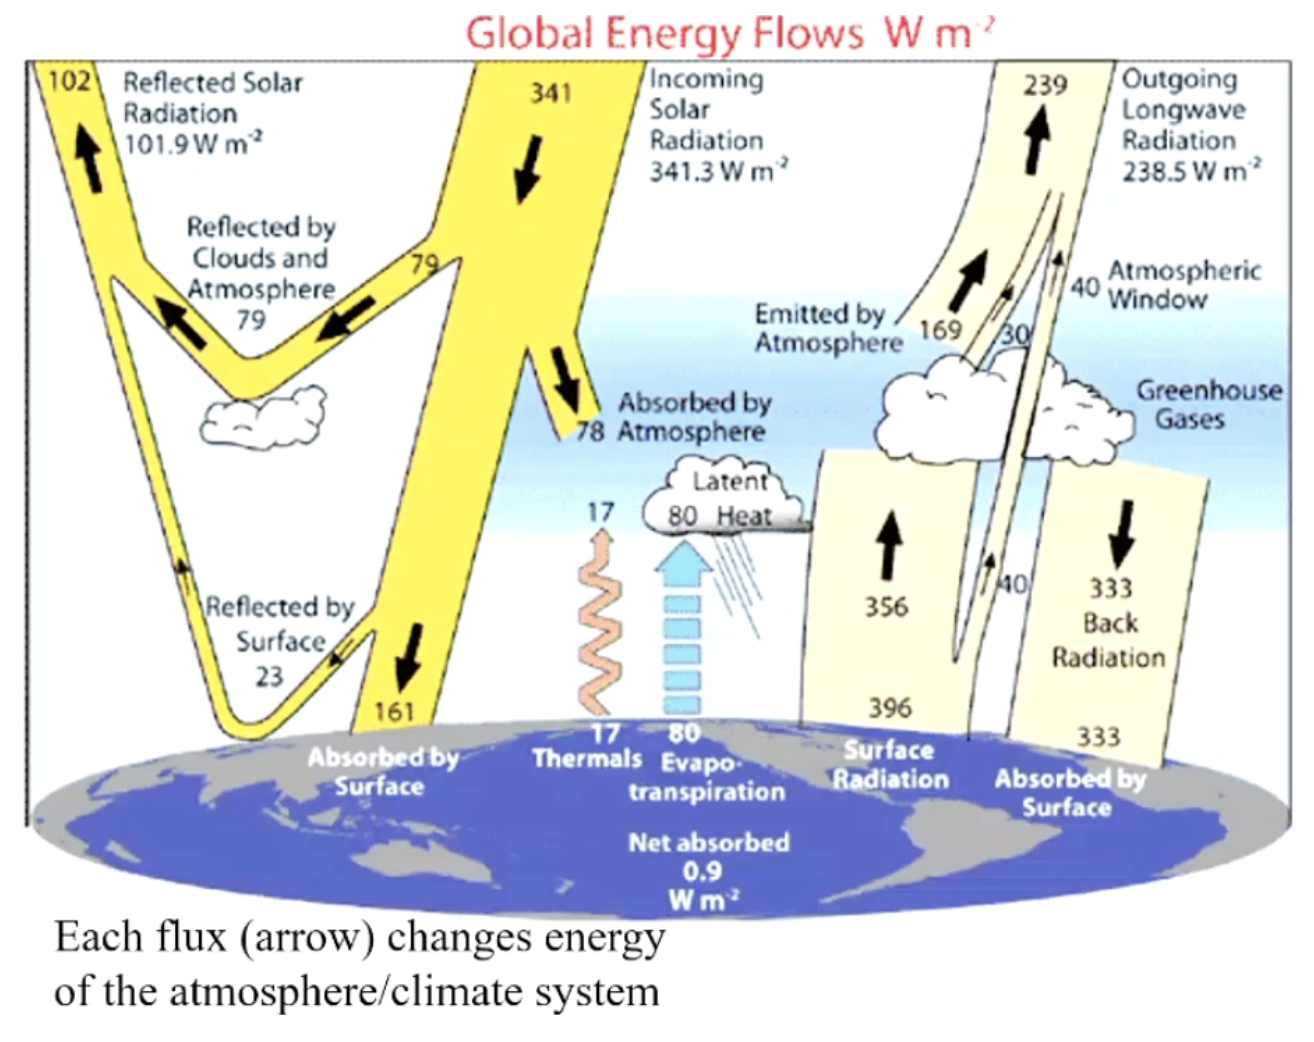
precise values diagram → do we need to know this?
how does absorption work?
H20 example → will rotate faster and vibrate if hit by incoming infrared photons
symmetric/asymmetric stretch, bend, and can vibrate in different waves → means different wavelengths absorbed by a single molecule
speed/frequencies very specific and dependent on the shape and weight of the molecule
CO2 example
earth emits a lot of frequency at its preferred wavelength
molecule bends
BASICALLY: (different molecules need a photon of specific wavelength)
atmospheric window region
wavelengths that don’t interact, that are re-emitted by earth straight back out into space
rest (356/396 watts) radiated from surface is absorbed by atmosphere (mostly water)
if a planet has an atmosphere, it has a greenhouse effect!
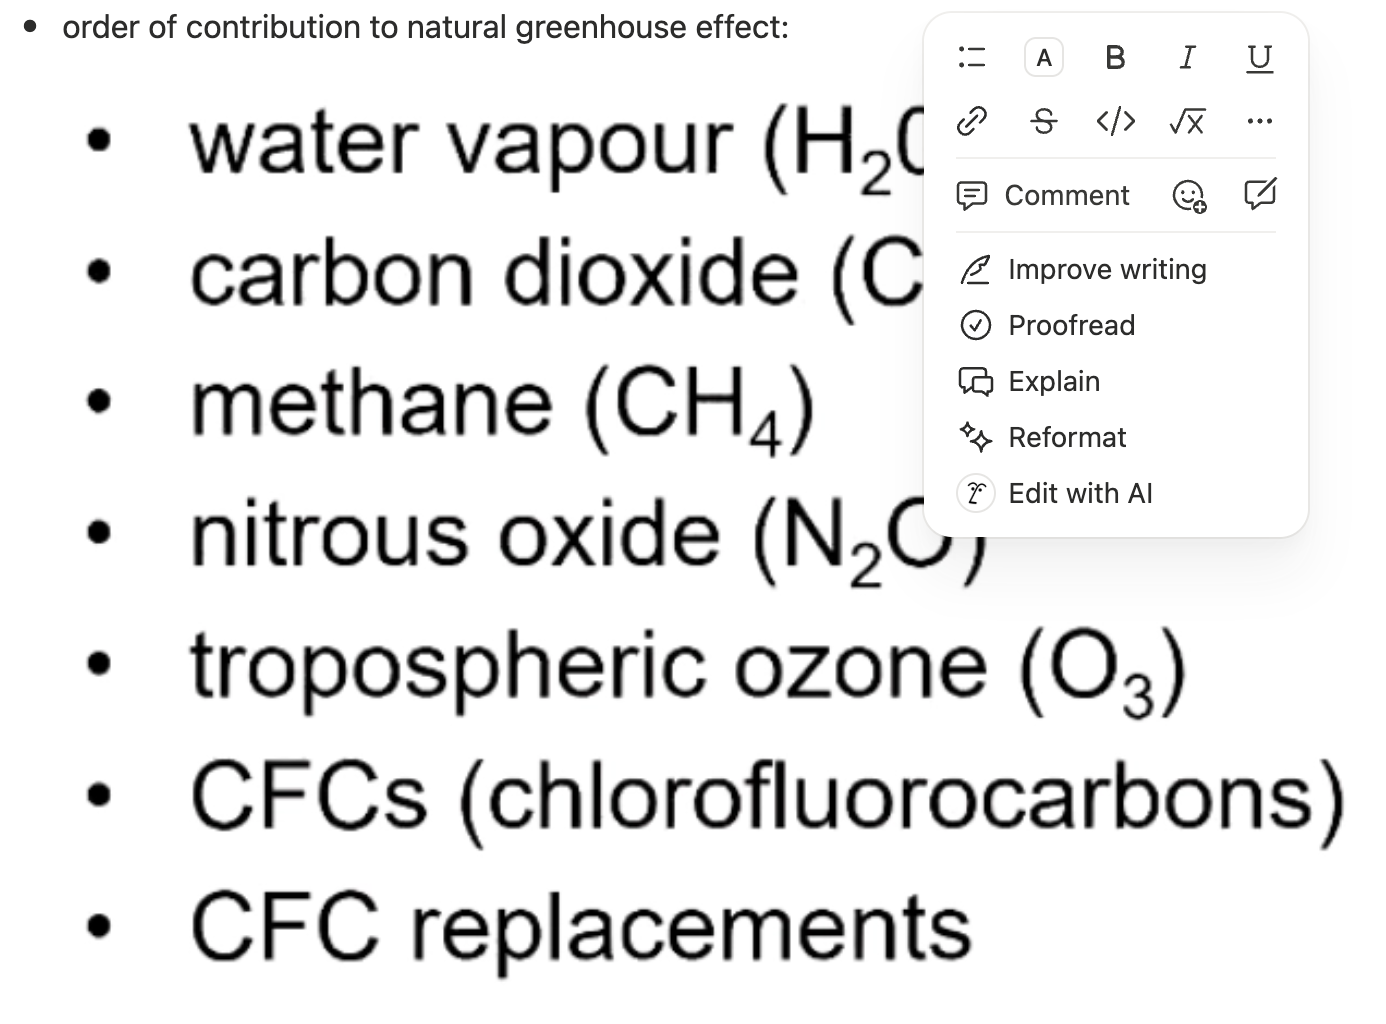
order of contribution to natural greenhouse effect
water vapour positive feedback!
understanding how feedbacks enhance a small change → for every 1 degree of warming we get from CO2 in the atmosphere, that effect is accelerated by the water cycle by another 2 degrees!!
tropical cyclone definition, structure and dynamics
three factors acting on a moving parcel of air for gradient wind
aka tropical storms, hurricanes, typhoons
tropical cyclones → warm-cored, cyclonically rotating atmospheric vortices driven by air-sea enthalpy fluxes, and are mostly in hydrostatic and gradient wind balance (except near the eyewall and within the boundary layer)
gradient wind means wind is moving parallel to isobars, three main forces acting on a moving parcel of air—the Pressure Gradient Force (PGF), the Coriolis force, and the centrifugal force—are perfectly balanced
hydrostatic balance in cyclones
→ vertical acceleration isn’t very strong
except in boundary layer bc of imbalance of forces due to friction
technical definition
and requirements
warm-cored, non-frontal low-pressure system of synoptic scale developing over warm waters
having organised convection
a wind speed of at least 34 knots or 63 km/h
extending more than halfway around near the centre
persisting for at least 6 hours
before that = tropical low
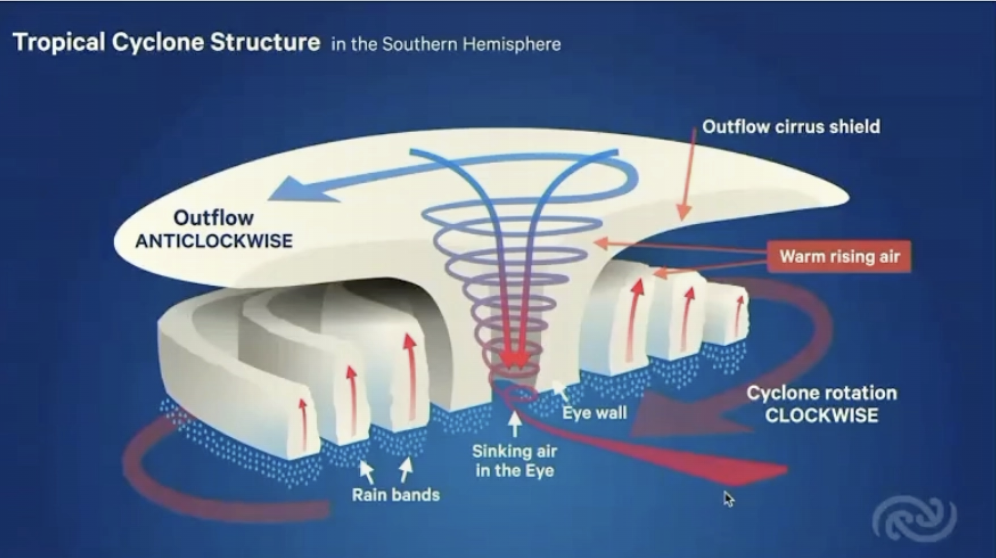
mature and intense tropical cyclones exhibit a high degree of symmetry with well defined eyes
tropical cyclone structure
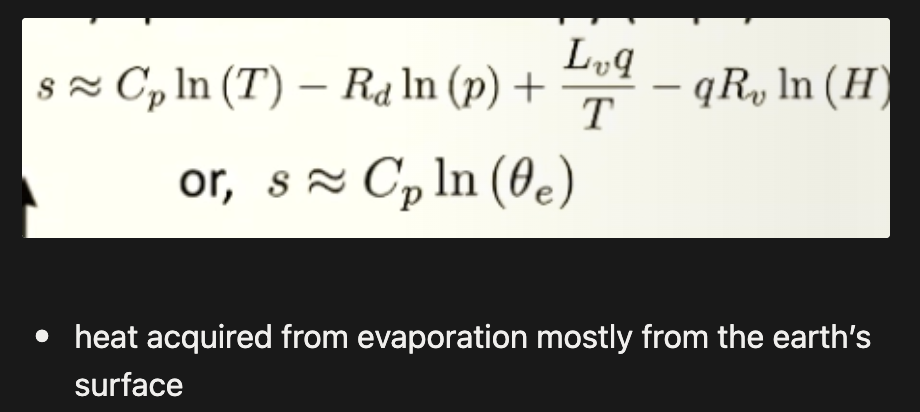
two important conserved variables
equation in first one
specific moist entropy -> ‘up,’
heat acquired from evaporation
absolute angular momentum -> ‘in,’ and, ‘out,’
equation
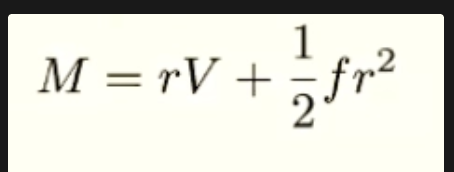
don’t think you need to know the maths that well?
R=radius, v= velocity (bigger in centre decreases moving out), f=Coriolis (doesn’t change unless latitude changes
MEANS as the air parcels spiral towards the centre and radius decreases, V (velocity) has to increase for M to remain constant
more cyclone structure/movement
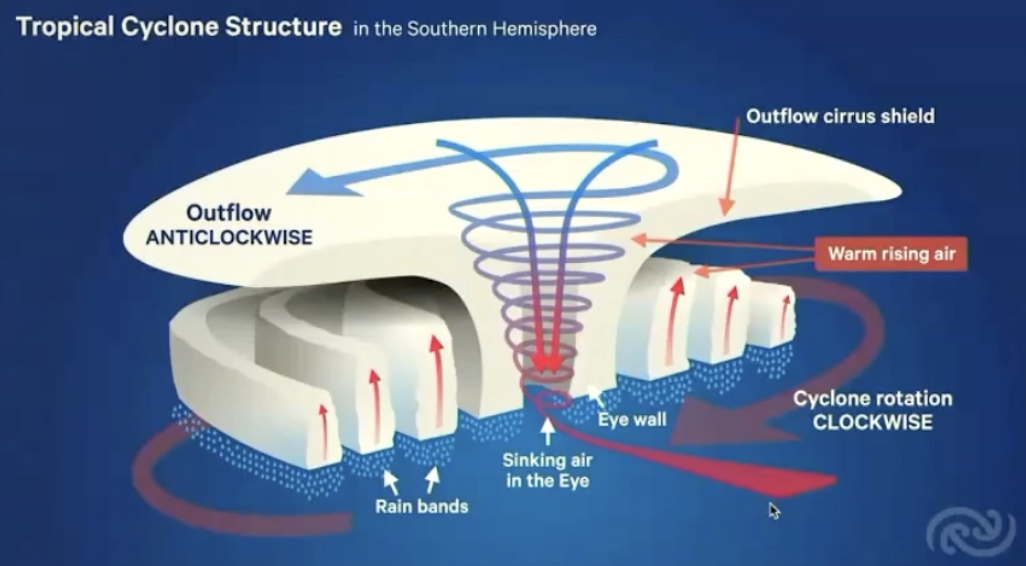
OUTFLOW IS ANTICLOCKWISE
Tropical cyclone wind profiles
how do these decay?
Most intense winds occur in the innermost ~100km surrounding the eye
Wide range of observed radius of maximum winds (RMW) -> 10-110km
Wind speed decays rapidly just beyond the RMW, but decreases more gradually at larger radii
Tropical cyclone energetics
Converting into
heat energy
mechanical energy
Carnot cycle (heat engine) -> stages of conversion
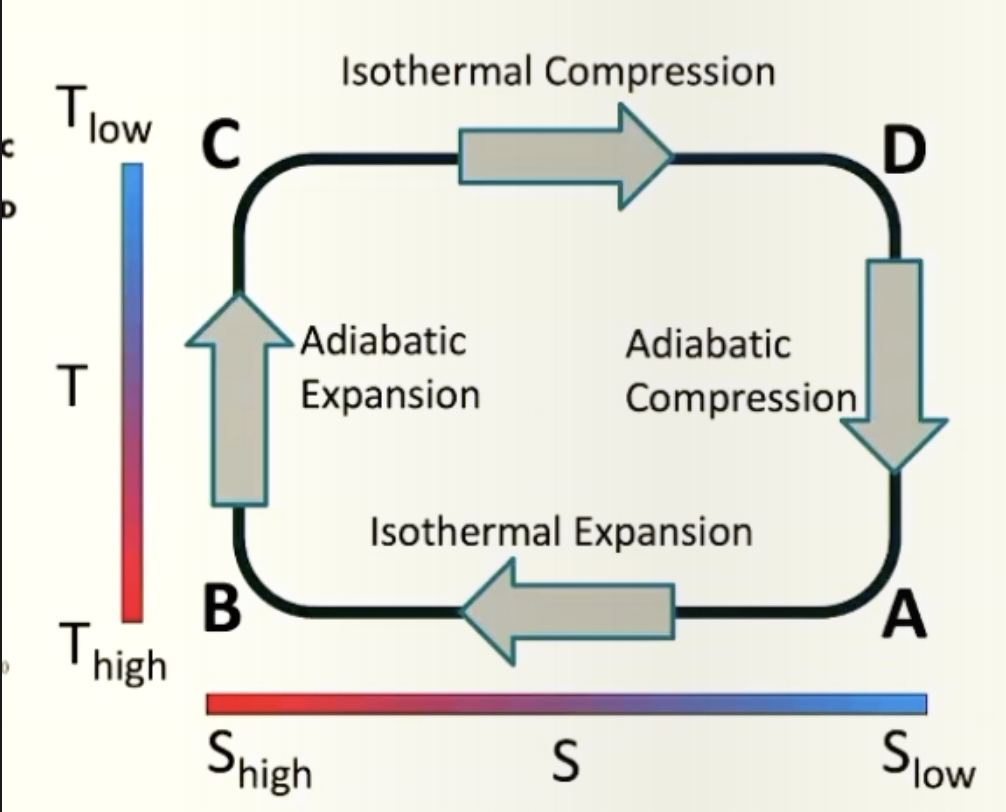
isothermal expansion
Surface winds increasing the heat as you move towards the centre
Temperature stays constant, moisture is acquired through evaporation of water as winds are increasing
air accelerating as it moves towards the centre of the cyclone increases the flux of vapour from the ocean -> latent heat, not sensible heat
Adiabatic expansion as air rises
High entropy air is conserved but temperature decreases
g. from 29 to -70 degrees Celsius
Isothermal compression
Heat radiatively lost from top out into space
Adiabatic compression
Air slowly sinks down to the surface
(but in actuality, not idealised, a lot of air is mixed as it sinks rather than conserved)
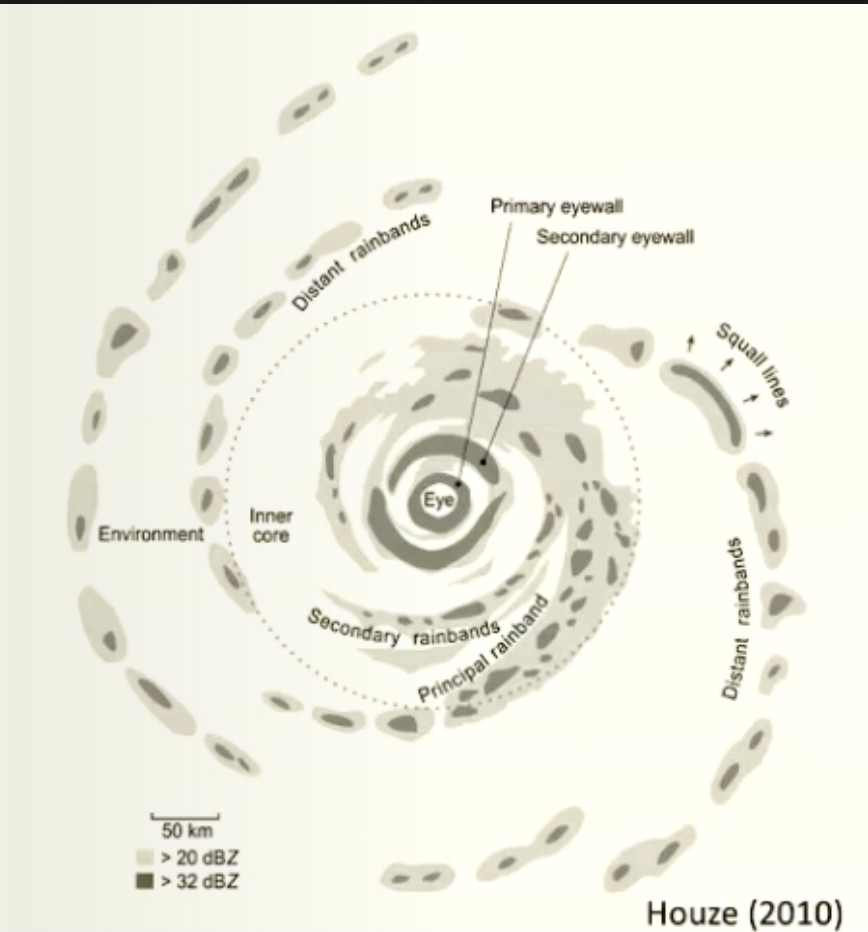
Precipitation structure of a mature TC
Concentrated in:
‘Eye wall
Spiral bands
WMO tropical cyclone programme
‘bhola cyclone,’ hit Bangladesh in 1970
300000 deaths due to storm surge
Triggered a coordinated response for the mitigation of cyclone disasters, resulting in the WMO TCP
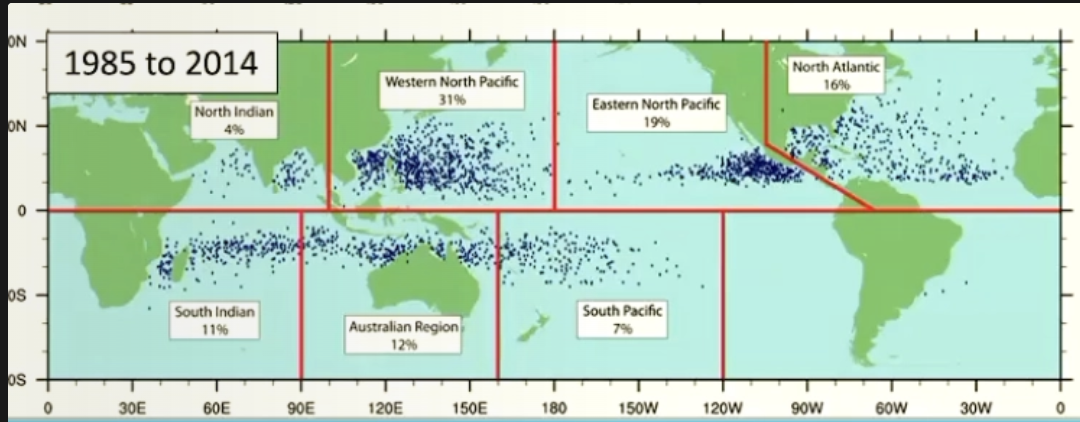
Spatial distribution of tropical cyclone genesis
Large-scale conditions for tropical cyclone genesis
6 things
Source of low-level (previous disturbance)
vorticity
Coriolis parameter needs to be sufficiently high, can’t be on equator
Low deep-layer vertical shear (not much criss crossy wind)
Sea surface temperature excess above 26 degrees to a depth of 60m
Threshold actually depends on global climate and will likely increase with global warming! -> shifts in a relative sense to the climate
Vertical gradient of theta between sfc and 500mb (huh)
Middle tropospheric relative humidity (big one!)
Annual tropical cyclone frequency -> a bit of a mystery
why might this be the case?
-> always around 80 per year with a standard deviation of only 7
Could help set the earth’s energy balance
Seasonality by region
Jan-march is peak but nov-april in aus
Peak in September-oct in northern hemisphere
Basically, summer!
Tc-related mortality is due to
Usually actually flooding/storm surge!
Tropical cyclone jasper (2023)
Huge rainfall and flooding in cairns
Rainfall of over 2m in a week
Most rainfall-intensive on record
TCs are responsible for how much rain?
resolution issues
30-50% of annual rainfall maxima, especially in WA northern desert!
Need to resolve intense rainfall near the centre of tropical cyclones -> at the moment we don’t have that that much, around 100km
climate change and tropical cyclones
what about with high-resolution models?
They’ll likely decrease with global warming
But , so we are left with models as our primary tool
no existing theory for tropical cyclone frequency
And if we go with high-resolution models decrease is actually less
With 2 degrees warming:
rain, wind speed, intensity
what is rapid intensification
But is expected to increase like 15% and even up to 30%!!
rain rate
Wind speed will increase about 5%
TC intensity will increase about 5%
TCs will intensify more quickly
Rapid intensification -> Increase in maximum winds of at least 30kt in a 24h period
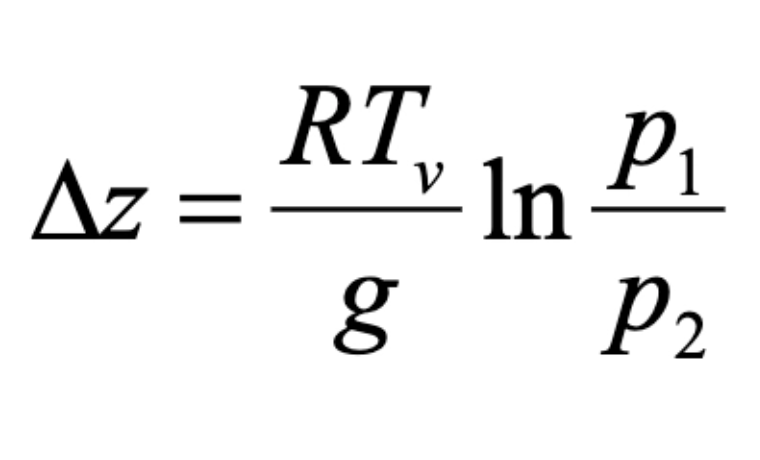
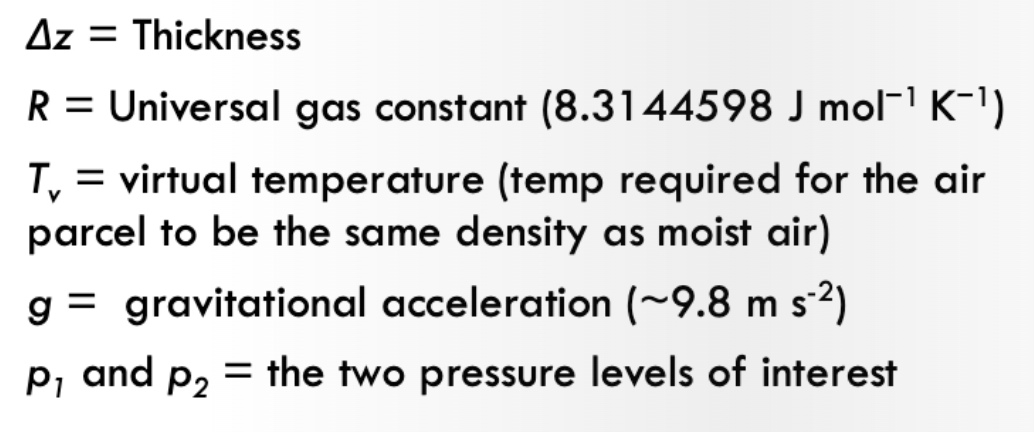
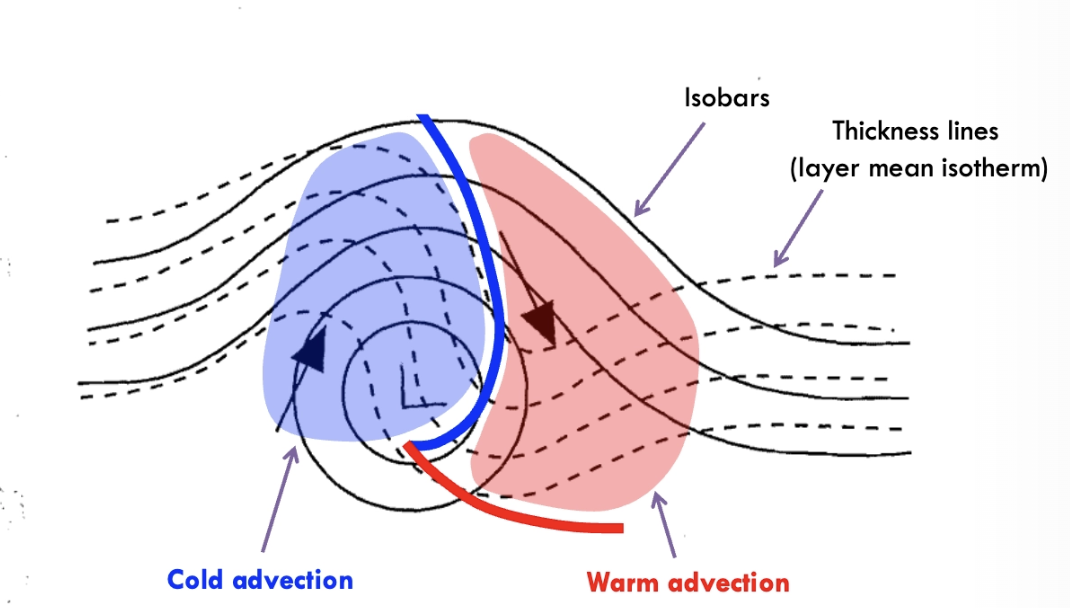
thickness
the distance between the 1000 and 500hPa pressure levels
proportional to the mean temperature over this layer
i.e. higher thickness = warmer air
used to identify cold and warm air masses
thickness equation
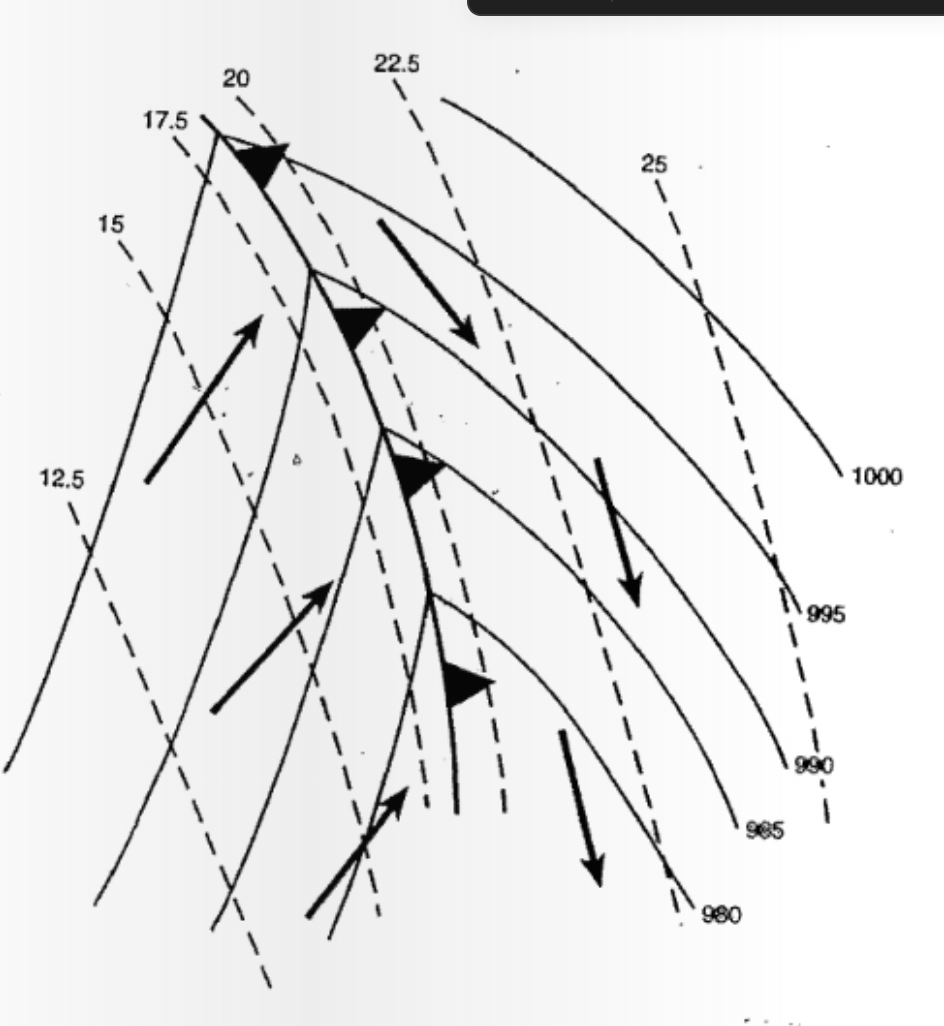
fronts and thickness
(esp thickness lines and isobars)
located at maximum gradients and kinks in
air pressure
thickness
identified by
sharp temperature changes over short distances
shifts in wind direction
rapid changes in air pressure
changes in air moisture content
clouds and precipitation patterns
seem to run perpendicular to isobars and parallel with thickness lines!
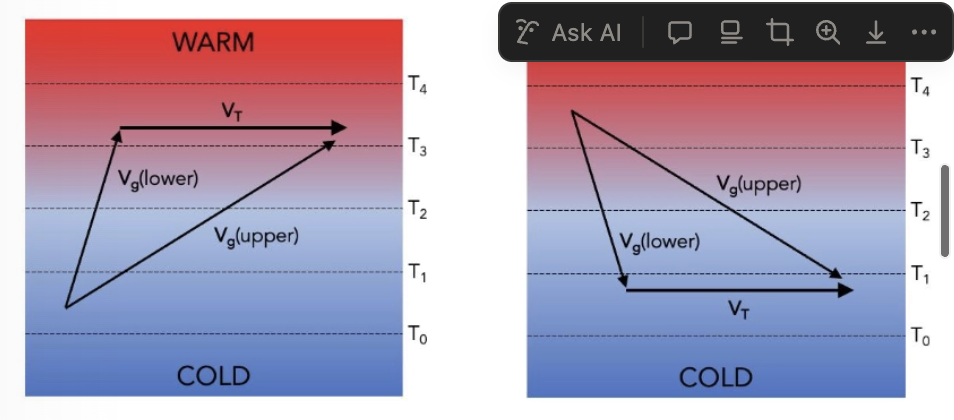
the thermal wind
the vector difference due to the change in geostrophic wind with height
represents the change in geostrophic wind speed and direction with height
oriented parallel to isotherms (thickness lines!)
helps identify advection of cold and warm air masses
can tell us if the average temperature is increasing or decreasing
indicating whether advection of air into a region is cold or warm
cold air advection:
colder airmass moves to replace warmer air
*geostrophic wind vectors turn clockwise with height → veering
thermal wind vector aligned parallel to the mean isotherms
warm air to the left of thermal wind vector, cold air to the right
warm air advection
the airmass within a layer is warming, as a warmer airmass moves in to replace colder air
*geostrophic wind vectors turn anticlockwise with height → backing
thermal wind vector aligned parallel to the mean isotherms
warm air to the left of thermal wind vector, cold air to the right
practice using hypsometric equation!
Synoptic
Implies both time and space scales
Time: 1-7 days
Space:
Horizontal: about 1000-3000km across
Vertical: up to 12-16km (depth of the troposphere)
weeklong timescale,
highs, mid-latitude and tropical lows
thunderstorms or tornadoes or climate change
not
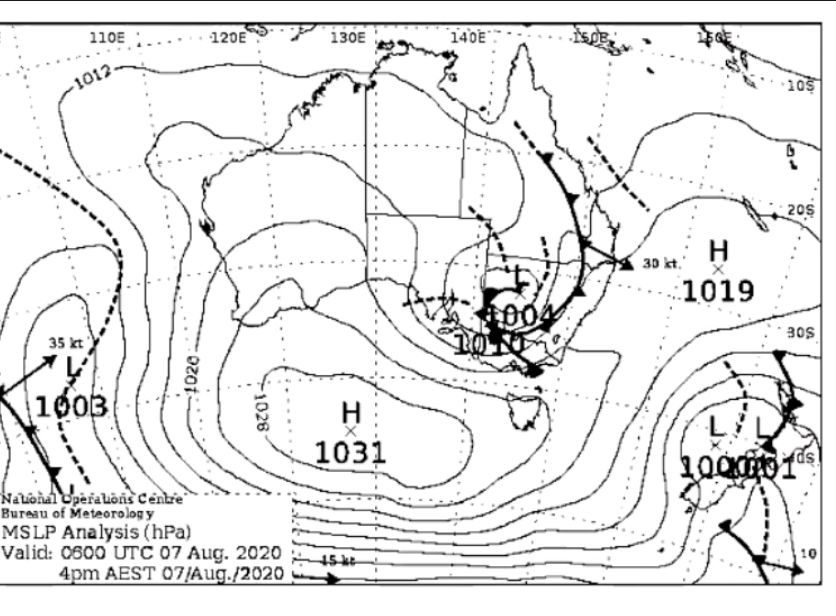
First synoptic chart
1816 -> Heinrich Brandes (using observations sent by mail)
First operationally useful chart
australia’s first chart
1849 -> Smithsonian institution (telegraph observations)
Australia’s first chart in 1877
fronts in north
how spaced out are pressure contours
north Atlantic/Europe tends to have a lot of occluded fronts and warm fronts and complicated things happening
Pressure contours are in hPa (1 Pa = 1 Nm/-2), usually spaced at 4 hPa
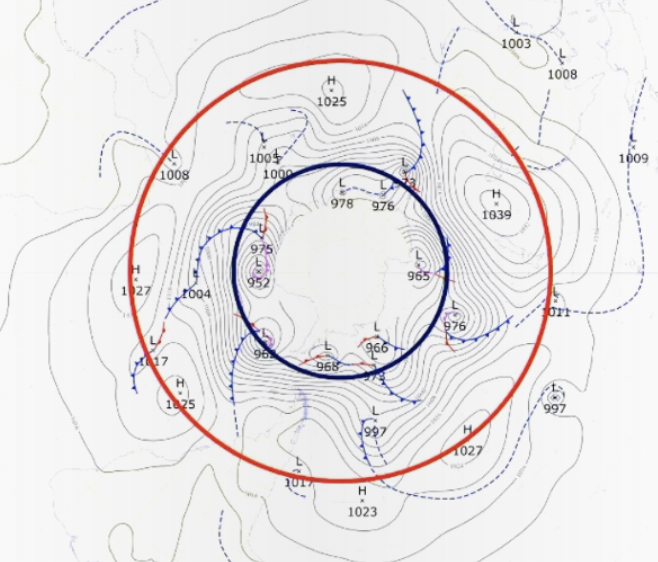
but hey! remember prac 1? (south?)
belt of highs, belt of lows
Vertical motion obvious rules
Descending in highs
Rising in lows
Condensation/clouds: rising air more likely to lead to rainfall
as air cools and condenses
Air warms when it descends
dew point
when condensation occurs
The temperature to which air must be cooled (at constant pressure and water vapour content) for saturation to occur
The 200hpa surface
About 12000m above sea level
Near the top of the troposphere in the mid-latitudes (Especially in summer)
Good for indicating the jet streams
Steering currents for mid-latitude weather systems
Can indicate areas of
upper-level divergence/convergence
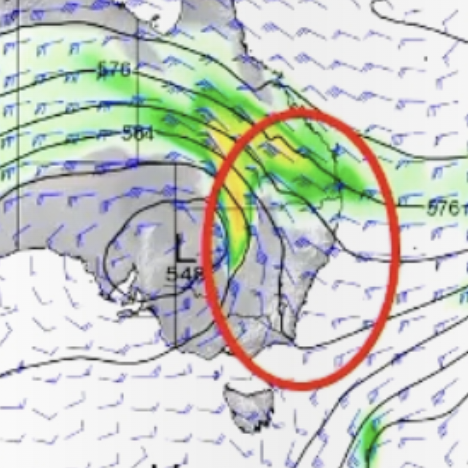
Regions that would help surface by promoting lows to develop/decay uplift/subsidence
e.g. ‘cut off lows,’
big part of cause of low/jet development
spinning jets and splitting air (big part of cause)