W26 L2 - Enzyme Parameters and Plots
1/17
Earn XP
Description and Tags
Flashcards about enzyme parameters and plots
Name | Mastery | Learn | Test | Matching | Spaced | Call with Kai |
|---|
No analytics yet
Send a link to your students to track their progress
18 Terms
What does Vmax tell us about enzyme behavior?
Vmax tells us how the enzyme behaves at very high substrate concentration.
What does Vmax/Km tell us about enzyme behavior?
Vmax over Km tells us how the enzyme behaves at very low substrate concentrations.
How does affinity relate to Km?
If the affinity is high, Km is low. If the affinity is low, Km is high.
What is the definition of Km?
Km is defined as the substrate concentration that gives us half of the maximum velocity.
How do we measure enzyme reaction to find parameters?
Measure different substrate concentrations and the corresponding initial rates.
Why aren't Michaelis-Menten plots used to determine parameters?
While visually appealing, Michaelis-Menten plots are ineffective for accurately determining kinetic parameters, especially Vmax and Km.
The plots do not provide precise measurements, making it difficult to derive accurate values directly; instead, non-linear regression or alternative plots like Lineweaver-Burk or Eadie-Hofstee are preferrable for more precise estimation of these parameters.
Who are Lineweaver and Burke?
They suggested turning the Michaelis Menten equation upside down to convert it into something that can be analyzed.
What is Lineweaver Burk Plot?
also known as a double reciprocal plot, 1/v against 1/s.
Why might researchers dislike Lineweaver and Burke plot?
data distortion issues during the linear transformation. This transformation often results in skewed data representation, making it difficult to accurately interpret enzyme kinetics and may lead to incorrect conclusions about enzyme parameters.
Why is the students data in Lineweaver and Burke lying?
It makes shite data look good, and I don't like that.
Why do people insist on using Lineweaver and Burke plot?
What you will find is that it is taught in all textbooks, and anyone who is sort of half familiar with enzymes will always go with a Lineweaver-Burk because it's very easy to apply.
What is the equation for a straight line in the alternative transformation?
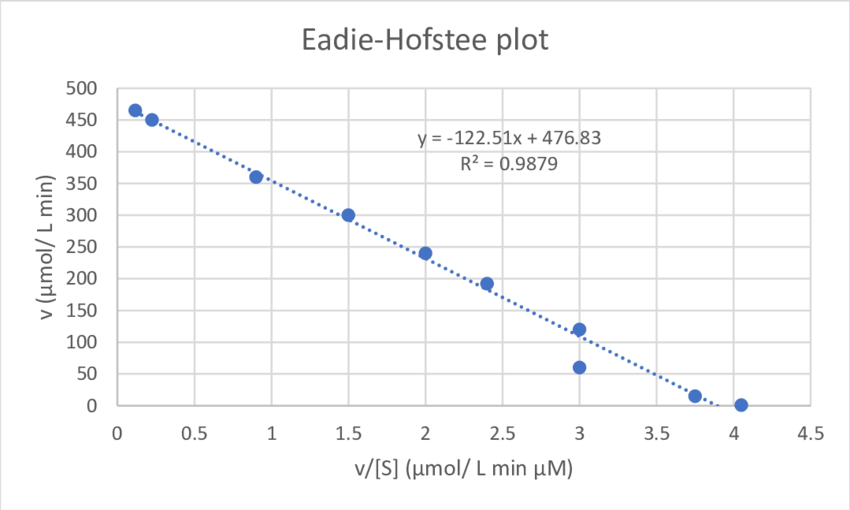
V = - Km * v/s + Vmax.
eadie hofstee plot equation
What does Eadie Hofstee plot axis look like?
V is plotted on the y-axis
v/s is plotted on the x-axis, resulting in a straight line.
What parametres does Eadie Hofstee plot give you?
y intercept - Vmax
x intercept - vmax/km
slope - -km
What does distribution look like in Eadie Hofstee plot?
The data distribution looks like that. It's very well behaved. There's no data clustering.
Why is it that researchers dislike the Eadie Hofstee plot?
Researchers dislike the Eadie-Hofstee plot because its visual representation can make even high-quality data appear to be poorly fitted. The plot's distribution of data points might give the impression of randomness, leading to a misinterpretation of the data's reliability and fit
Why does Klappa hate Hanes Woolf plot?
Because it combines all the bad features of a Lineweaver-Burk plot with the bad features of an Eadie Hofstee plot without giving any good features
overestimating the errors in estimated parameters like Km and Vmax
both axes depend on the substrate concentration, making correlation measures like R-squared unreliable
If you want to impress me in an exam, which plot should you use?
Always go for the Eddy Hof state plot because from a statistical point of view, it's much easier, much more valid, and it's less work for you.