REN R 105 Final Exam
0.0(0)
Card Sorting
1/99
Earn XP
Description and Tags
Last updated 5:23 PM on 12/8/22
Name | Mastery | Learn | Test | Matching | Spaced | Call with Kai |
|---|
No analytics yet
Send a link to your students to track their progress
100 Terms
1
New cards
Biodiversity
A measure of the variety of organisms within a local area or region often including:
-Genetic variation
-Taxonomic uniqueness
-Endemism
Organization (units): species interactions, ecological processes, and environmental conditions
E.O. Wilson was the first to popularize the term in 1988 and 1992
-Genetic variation
-Taxonomic uniqueness
-Endemism
Organization (units): species interactions, ecological processes, and environmental conditions
E.O. Wilson was the first to popularize the term in 1988 and 1992
2
New cards
Species richness
Number of taxa in a local area or region
Does NOT take into account abundance (dominance) of each species
Does NOT take into account abundance (dominance) of each species
3
New cards
Dominance (or evenness) index
A measure of the variety of taxa in a community that takes into account the relative abundance of each one (dominance index)
4
New cards
Three measures of local diversity (taxonomic)
(1) Alpha (α) diversity: is the number of species present (species richness, S) in locale/habitat and ideally combined with information on evenness of individual abundance (more ‘even’ is assumed to be ‘better’)
(2) Gamma (γ): number of species over a large region or continent (similar to α, but considering all habitats). Thus, the sum of species in broader region
(3) Beta (β) is the ‘turnover’ in number of species in a locale/habitat (α) vs region (γ); estimated ration of γ/α (more + means more turnover or unique species per locale/habitat)
Diversity (evenness) metrics are used to calculate how 'equitable' the community is. Once graphic approach richness/dominance is called rank-abundance curve
5
New cards
Biological species concept
Species are groups of interbreeding natural populations that are reproductively isolated from other such groups
Here, genes are NOT transferred to other 'species' and thus can take on different characteristics (appearances, etc.)
Generally, this is the most widely accepted. But it is not without it's challenges
Here, genes are NOT transferred to other 'species' and thus can take on different characteristics (appearances, etc.)
Generally, this is the most widely accepted. But it is not without it's challenges
6
New cards
Competing Species Concepts
1. Morphological species
2. Phylogenetic species
3. Genetic species
4. Ecological species niche space
2. Phylogenetic species
3. Genetic species
4. Ecological species niche space
7
New cards
Morphological Species
Differences in characters/traits
8
New cards
Phylogenetic Species
Lineages that maintain integrity
9
New cards
Genetic Species
Different in DNA
10
New cards
The Case of the Northern Oriole
Pre-1800s: two species recognized as distinct
1800s: Reclassified to one species
Late 1900s: Genetic analyses illustrate the species are distinct (now back to two species)
It's not always easy to define a species (despite our common use). Sometimes it is clear, sometimes it's not.
Speciation is most often a gradual process, thus we expect gradual differences in populations that are diverging with different traits that may lead to isolation of breeding and thus allowing further divergence
11
New cards
Patric
Fatherland (homeland)
12
New cards
Allopatric
Often due to geographic barrier of populations (mountain range, big river, etc.) where there are dissimilar selective pressures, or genetic drift
13
New cards
Peripatric
Due to isolate niche from isolation of a small population with unique traits (founder effect, genetic drift)
14
New cards
Parapatric
Is from niche specialization within a population to reduce competition (better off mating with other specialists)
15
New cards
Sympatric
Is from genetic divergence within a population, but not due to new niches (sexual selection; polyploidy)
16
New cards
Founder Effect
When an isolated population is founded by a small number of pioneering individuals, the new population may turn out to be quire different (reduced 'sample' of genes)
One of two genetically related 'sampling' factors underlying allopatric, parapatric, peripatric, speciation (especially peripatric)
One of two genetically related 'sampling' factors underlying allopatric, parapatric, peripatric, speciation (especially peripatric)
17
New cards
Genetic Drift
Changes in allele frequencies caused by random effects of 'sampling' (the smaller the sample, the more likely it will deviate); this is the core mechanism of the founder effect
One of two genetically related 'sampling' factors underlying allopatric, parapatric, peripatric, speciation (especially peripatric)
One of two genetically related 'sampling' factors underlying allopatric, parapatric, peripatric, speciation (especially peripatric)
18
New cards
Endemism
An endemic species is one who geographic range is small (confined to a small area/region) or below a specific geographic range size (
19
New cards
Time-stability
Long, stable environments
20
New cards
Topographic (environmental) barriers
Topographic heterogeneity increases isolation of species (can lead to allopatric speciation)
It is always terrain (mountains): Amazon River is 4-km wide and 1,400 km inland from the sea (and many species use the river as their range boundary)
Heterogeneity is found elsewhere with low endemism, so it is no the only factor
It is always terrain (mountains): Amazon River is 4-km wide and 1,400 km inland from the sea (and many species use the river as their range boundary)
Heterogeneity is found elsewhere with low endemism, so it is no the only factor
21
New cards
Low productivity
Many areas of high endemism have low productivity (limited nutrients and/or water)
Example: Endemism in Australia is highest in heath communities (very poor soils)
Why? Low rates of competitive displacement (slow growth) and non-equilibrium conditions (disturbances, droughts) reduce gene flow
Example: Endemism in Australia is highest in heath communities (very poor soils)
Why? Low rates of competitive displacement (slow growth) and non-equilibrium conditions (disturbances, droughts) reduce gene flow
22
New cards
St. Helena Example
420-km2 volcanic island (10 Ma); one of the most isolated islands on Earth
Plant Endemism:
-Isolation and rugged shoreline restricted colonization of plants. Those that were able to colonize (certain traits) evolved to new species found only on the island (hence 'endemic')
-Many remote ocean islands in tropical/subtropical zones have endemic species
Plant Endemism:
-Isolation and rugged shoreline restricted colonization of plants. Those that were able to colonize (certain traits) evolved to new species found only on the island (hence 'endemic')
-Many remote ocean islands in tropical/subtropical zones have endemic species
23
New cards
Endemic patterns in North America
Non-random distribution
Areas that missed glaciation more recent events are darker
Areas that missed glaciation more recent events are darker
24
New cards
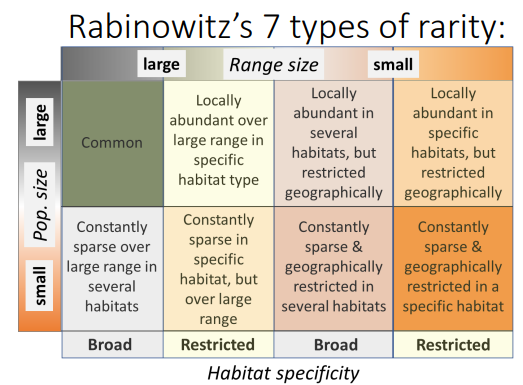
Species Rarity
Rabinowitz defined seven types of rarity based on three factors:
1. Range size (small vs. large)
2. Population size (small vs. large)
3. Habitat specificity (restricted vs. broad)
1. Range size (small vs. large)
2. Population size (small vs. large)
3. Habitat specificity (restricted vs. broad)
25
New cards
Rabinowitz's Seven types of rarity
26
New cards
Hyperdominance in the Amazonian Tree Flora
16,000 tree species in 1,170 plots
227 hyper-dominant (~50% of stems) species
Rarest 5,800 species (36% of total) have population sizes of
227 hyper-dominant (~50% of stems) species
Rarest 5,800 species (36% of total) have population sizes of
27
New cards
Species-Area Relationship (SAR)
S=cAz
S = number of species (based on a power function)
A = area
c = constant measuring number of species per unit area (depends on taxon and biogeographic area)
z = constant measuring the slope of the line relating to S & A
Curved relationships, like power-law, make predications difficult (they require more math than straight lines). In this case, we can make things easy by using logarithms (logs) to for a straight line
-What are logs?
--A handy way of rescaling numbers
Global triphasic pattern with different mechanisms (another SAR at large scales):
(1) Local scale: Sensitive to local abundance (quickly adding common species; rare species added later) + encountering new habitats (i.e., environmental heterogeneity
(2) Intermediate scale: Sensitive to the encounter of species ranges (processes of speciation, dispersal, and extinction)
(3) Large scale: Species again start accumulating faster in the presence of major barriers to dispersal (i.e., biogeographic realms with long separate evolutionary histories)
Environmental (habitat) heterogeneity example:
-Plant diversity with increasing sample area in the Judean desert of Israel
-T1: Transect in homogeneous area
-T2: Transect 2 in heterogenous area with four vegetation zones (demonstrates stair-step pattern of complete sampling in a single habitat followed by sampling of the next)
-T3: Transect 3 in homogeneous area close to T2 showing the effect of habitat edge
28
New cards
Artificial + Environmental Heterogeneity
hypotheses are not mutually exclusive. Artifact idea is that it takes larger areas to sample (encounter) rare species so it is simply an ‘artifact’ of sampling
29
New cards
SAR and Extinction Risk
Implications for conservation (z = 0.03):
-A 10-fold increase in area = 2-fold increase in species
-A 90% decrease in area = 50% in species (severe habitat loss needed before most species are lost)
Darlington’s Rule (1957): “Division of area by ten divides the fauna by two”
Reverse SARs has been used to predict species extinction rate/risk under different rates of loss in habitat
30
New cards
Species-scape
global patterns in number of species by taxonomic group (not considering prokaryotes)
31
New cards
Ration extrapolation
Terry Erwin used insecticidal fogging of tress to study insect diversity in the Tambopata Reserve, Panama:
-400 species discovered in the canopy of one tree species (Luehea seemannii)
-163 of which were beetles
-Beetle collections made 50 metres apart showed only 8.7% overlap in species (different tree species have quite different beetle species)
Erwin the used a ratio method to predict number of total beetle species based on unique beetles per tree (163) and estimate of 50,000 tropical tree species:
-163 x 50,000 = 8.15 million canopy beetles species
-Because beetles represented 40% of canopy insects, he estimates total tropic canopy insects at 20 million
Subsequent studies demonstrated much smaller number of unique canopy beetles per tree species
32
New cards
Biodiversity (S) patterns of taxa in NA
Contours of Tree species richness (S) within different regions of North America (out of 620 tree range maps)
Why this pattern? (What limits tree growth?)
-Trees are temperature limited in the north
-Trees are also moisture limited
--The more moisture the more trees
Note strong latitudinal gradient in Canada, but a greater longitudinal gradient in the USA
Species richness patterns in mammals, amphibians and reptiles
-Amphibians are moisture limited! They need moisture
-Reptiles are temperature limited! They need heat more than moisture
33
New cards
Global patterns in biodiversity
Notable negative latitudinal relationship (richness decreases with latitude)
34
New cards
Global latitudinal patterns in biodiversity
As a general rule, there is an inverse (negative) relationship between latitude and species diversity
-The poles are not good for diversity!
Hypotheses:
(1) Solar energy, precipitation & PET: More energy, more niches (and water is needed for life)
(2) NPP & Structure: More biomass or structure (veg/trees), more niches
(3) Seasonality: High seasonality, low diversity (greater climatic tolerances select for wider latitude species)
(4) Stability-time: diversity increases with community age (evolution); limits to dispersal into glaciated areas (not enough time yet)
(5) Area: Tropics have larger surface area of similar climate because border equator
(6) Pathogens: Tropics have more pathogen pressure than temperate ecosystems, so individuals must spread out to avoid diseases (neighbours are thus different species)
A lot of correlated factors make it difficult to separate hypotheses
35
New cards
Energy (PET) and stability hypotheses
most commonly promoted as you need not only stable environments, but also significant energy/moisture to partition resources (niches) [i.e., stable arctic conditions don’t show how diversity/endemism]
36
New cards
Mechanisms that prevents competitive exclusion
(1) Mortality of dominant competitor via predation, herbivory, or abiotic disturbance
(2) Environmental fluctuations (e.g., droughts)
(3) Local extinction and rescue effect (re-invasion of species) can mitigate local effects of competitive exclusion (landscapes are patchy, species move)
The first two factors slow the process of competitive exclusion thus helping avoid equilibrium conditions that would promote top competitors from dominating and lowering diversity, while the last factor compensates for its effect
-Competitive exclusion: In a stable environment competition will drive extinction of one species and the dominance of another
Rescue effects (landscape processes) consider spatial patterns in populations (source-sink dynamics) relative to patches of habitat with immigrations (dispersal) ‘rescuing’ populations lost or declining, thus maintaining more diversity in a region
37
New cards
Mortality via Predation
Predation can reduce the intensity of competition among prey species (a mortality-causing disturbance)
Paine (1966) studied the tidal rock faces on the Washington coast
The starfish predator allows coexistence, increasing diversity
-Starfish are selective – they prefer mussels (dominant competitor), allowing barnacles (weak competitor) to coexist
-Without starfish, mussels overtake barnacles
Paine (1966) studied the tidal rock faces on the Washington coast
The starfish predator allows coexistence, increasing diversity
-Starfish are selective – they prefer mussels (dominant competitor), allowing barnacles (weak competitor) to coexist
-Without starfish, mussels overtake barnacles
38
New cards
Biotic disturbances
(1) Herbivory
-Selective grazing of dominant species. This decreases competition leading to increased diversity
-Mowing can also decrease dominant species and thus increase diversity
(2) Parasitism and diseases
-Can reduce competition with competitors
Often density dependent (increase prevalence at high densities), thus targeting dominant species leading to increased diversity
39
New cards
Abiotic disturbances
(1) Density-independent mortalities
-Can prevent competitive exclusion
-Ex/ windstorms, landslides, fire, severe weather events (freezes or droughts), etc.
(2) Selective mortalities
-Ex/ large, dominant trees selectively killed by wind or lightning thus reducing competition
Fire is an important regulator of diversity for many ecosystems
40
New cards
Species richness-productivity relationship
More productive ecosystems (high biomass production) are often assumed to contain higher species diversity
-This may be true at global scales, but not necessarily at local scales
-A number of systems have low richness and high productivity
--Ex/ mangrove swamp, salt marsh, cattail marsh
Park Grass (1856) experiment
-Hay production research (2.8 ha site)
-Soil nutrients and pH changed (+) in 20 plots (since divided)
-Annual disturbance – haying
-Greater productivity (biomass) results in few species, especially pH > 4.9 where nutrients are more available (competitive displacement is lessened at lower productivity)
41
New cards
Species richness-productivity and disturbance
At local scales, the effect of productivity (nutrient enrichment) can act to depress species richness because competition dominates (few good competitors win out).
However, disturbances especially in nutrient rich sites, (again where competitors would otherwise win out), can again promote diversity
However, disturbances especially in nutrient rich sites, (again where competitors would otherwise win out), can again promote diversity
42
New cards
Importance of life history trade-offs
Hubbell (2001) created a Unified Neutral Theory of Biodiversity (UNTB)
-Key principle, species ‘play’ a zero-sum game (must play by the same ‘rules’ and face constraints/trade-offs); per capita neutrality
--If it wasn’t a zero-sum game eventually one species would win and the other species would become extinct
-(1) Shade-tolerant trees – high survival to shade trees, but low growth rates in sun
-(2) Shade-intolerant trees have low survival to shade, but high growth rates in high light
-An example of a life history manifold because it is an evolutionary attractor in niche space – a series of unavoidable life history design constraints that every species in the trophically defined community must obey to stay in the game
43
New cards
Natural Background Rates
The opposing force of speciation is extinction. IT is a natural process, but there are different periods of the Earth’s history where extinction rate far exceeded speciation
Some key natural process that promotes extinction:
-Demographic stochasticity
-Environmental variability (stochasticity)
-Catastrophes
Background extinction rate is 0.0001-0.00001% per year (based on fossil record); or 1-10 species/year
Of all the species that have lived on Earth since life first appear, only about one in a thousand is still living today (i.e., 99.9% of species have gone extinct)
Although less discussed, competition can be a driver of extinction
44
New cards
Mass extinctions
Mass extinction is when over 75% of species, disappear within a geologically short interval, typically less than 2 million years. 5 major events prior to Pleistocene (minor Pleistocene evet)
5 major extinction, but note general trend towards more diversity
Rates of extinction now far exceed average fossil record rate of say 1 species per 1,00-years. Recent extinction rate is now 100-times higher than distant past.
-Rates are project to get worse in the future with at least 1,000 times higher than distant past, thus putting us into a 6th extinction period, this one due to human activities (habitat loss, climate change, over-exploitation)
45
New cards
Human causes
Jared Diamond helped build the discipline of Conservation Biology in the 1980s, including developing concepts around threats to biodiversity loss (species extinctions).
-This included his ‘evil quartet’ (4-horsemen of the ecological apocalypse) concept in 1984, whereby species extinctions are building due to the individual or combine affects of:
(1) Overexploitation (over-hunting/fishing)
(2) Introduced (non-native) species
(3) Habitat loss (destruction)
(4) Chains of linked extinctions (i.e., trophic cascades, co-extinctions, etc.)
-Later he and others added climate change as it’s own threat. Some also add pollution as another threat or even human population size/growth, but Diamond’s evil quartet and climate (human caused vis pollution) are likely the biggest factors
46
New cards
Overharvest: passenger pigeon
~6 billion passenger pigeons pre-1800
Each year, hunters followed the nesting. The spring of 1871, over a period of 40 days, at least 1.2 M adult birds were ‘harvested’ and shipped to markets. This does not include local catch and loss of squabs
Normally, rarity corelates with extinction risk (i.e., hyper-abundant organisms typically stick around) However, overharvest of a species provides a mechanism to extinction, particularly if that species is naïve to humans like passenger pigeons were
The final extinction of passenger pigeon cannot be explained by overharvest as law protected pigeons once numbers were low
-Why?
--Allee effect: at some critically threshold point your per capita growth rate begins declining
47
New cards
Pleistocene Megafauna
Megafauna losses at the end of the Pleistocene:
-Europe and non-tropical Asia = 36%
-North America = 72%
-South America = 83%
-Australia = 88%
Megafauna defined by animals whose weight was > 44 kg (100 lbs)
-The African paradox: Why do African grasslands have such high megafauna diversity, yet the longest history of people?
--Co-evolution with humans, people have always been on the continent
Bison, moose, elk, caribou, deer, pronghorn, muskox, big horn sheep and mountain goats remain in North America
All but the pronghorn descended from Asian ancestors that had evolved with human predators
48
New cards
Multiple hypotheses: Pleistocene megafauna
Multiplicative (synergistic) effects:
“extinction event was spread over more than 50,000 years globally…and was amplified by the interaction of both biotic (humans as invasive species) and abiotic (climatic) drivers”
“implication for conservation biology is that the coupling of marked climatic change with direct human impacts on fauna is especially pernicious. Both effects are under way today at unprecedented rates.”
49
New cards
Pleistocene Megafauna loss
Megafauna dispersal syndrome
-Osage orange range collapse example
Fruits are sometimes torn apart by squirrels to get the seeds, but few animals make use of it leaving them to rot. But, large fleshly fruits serve the function of seed dispersal through consumption by large animals
Other examples of anachronistic fruit species.
-Persimmon, papaya, honey locust, avocado
-All these fruits are generally to large for current mammals to consume whole. Many of these species have lost range since megafauna loss relying on humans for dispersal
50
New cards
Megafauna dispersal syndrome
loss of key megafauna resulted in loss of dispersal for large-fruited species (Osage orange, avocado, etc.)
51
New cards
Invasive Species: Impacts
(1) Environmental impacts
-Can negatively impact biodiversity
-Can cause species extirpation and extinction
-Can cause soil degradation and erosion
-Can alter ecosystem processes like fire cycles
(2) Societal impacts
-Can cause disease or suffering in humans, pets
-Can reduce recreational opportunities
(3) Economic impacts
-Control and management costs can be significant
-Can reduce productivity in resources (forestry, agricultural)
-Can cause export and import trade restrictions
-Can reduce property values
52
New cards
American chestnut and chestnut blight
Chestnut blight is a fungal disease from Chinese chestnut trees (East Asia) introduced to North America in 1904 (New York)
-It is estimated that 4 billion trees were destroyed in the early 20th century. Some estimated that 1 out of 4 trees in eastern forests were lost since it was historically such a dominant species
-It is estimated that 4 billion trees were destroyed in the early 20th century. Some estimated that 1 out of 4 trees in eastern forests were lost since it was historically such a dominant species
53
New cards
American Elem and Dutch Elm Disease
Dutch elm disease is caused by a fungus (Ascomycota) though to be native of Asia that affects elm trees. It is spread by elm bark beetles with the fungus attacking the tree’s vascular tissues
-200 million trees were lost to DED primarily in the late 20th century
-200 million trees were lost to DED primarily in the late 20th century
54
New cards
Invasive Species: Traits
Common traits of invasive species:
(1) Fast growth and rapid reproduction
(2) excellent dispersal ability
(3) Generalist species (ability to thrive in different environments and climates)
(4) Few or non predators (often free of predation and disease in new areas; in original range this keeps them in balance)
(5) Often associated with humans and surface disturbances (primary pathway [vectors] for invasion)
55
New cards
Invasive Species: Consequences
Economic consequences
o (1) Economic losses of $138 B per year
o (2) Forage losses on pastures alone cost 1 billion per year (weeds expanding by 4,600 acres per day on US Federal lands)
How do you deal with Invasive species?
o Ideally, you eradicate it early before it get’s a stronghold, but once established many are very difficult to eradicate with biological controls (finding predators, parasites or pathogens of the species from it’s source/original range, so introducing another non-native species to fight it)
56
New cards
Native-exotic species richness
• Charles Elton (1958) said that ecosystems with higher species richness were less subject to invasive species because of fewer available niches (competition). And entry into the ecosystem by a new species would required extinctions elsewhere
•Diverse ecosystems should have fewer niches available for new invaders existing number of species and high levels of competition
•Invasion paradox
•Native and exotic species ricness associations depend on the scale and type of analysis (experimental vs. observational)
•Biodiversity hotspots in the tropics tend to have very few exotic species
57
New cards
Invasion Paradox
natively rich ecosystems are likely to be hotspots for exotics – “the rich keep getting richer”C
58
New cards
Coarse-grained
(large areas) observational studies often show positive correlations
59
New cards
Fine-grained
(small plots) experiments often suggest negative correlations (but with variable results)
60
New cards
Exotics and extinction
• New Zealand is home to 2,065 native plants
• Europeans brought with them 22,000 alien plants (most grow in gardens/farms) of which 2,069 have become naturalized
• There are more naturalized invasive plants species in New Zealand than native plant species
• Sax and Gaines (2008) point out the number of documented extinctions of native New Zealand plant species is only three
• Exotics receive a lot of attention and worry, but is this biased or justified by ecological theory?
• In no case is competition listed as the sole causes of species extinction. Predation appears to be a far more important factor. Diversity on islands seems to keep climbing
• For any island able to hold a certain number of native species, it tends to also be able to hold that many exotic species (2x diversity)
• Alternate explanation: extinctions are already set in motion, but will take 100s-1000s of yrs to come to completion (time-lags to extinction called: extinction-debt)
• Elton predicted that niches are limited so entry into a system requires extinction elsewhere due to competition, but that doesn’t appear to be the case within taxa (at least now). Bigger issue is across taxa (exotic diseases, predators)
61
New cards
Exotics can spur evolution
• Exotics can spur the evolution of new diversity:
o (1) Saltmarsh cordgrass- introduced to England in the 19th century
o (2) Interbred with the native small cordgrass
o (3) Hybrid offspring could not reproduce with either original species, producing a new species called common cordgrass
• This isn’t to say that non-native (exotic) species are harmless, as some can be quite problematic. The majority may not threaten native species if it is through competition and instead just add diversity. The problem is knowing which species are the especially problematic ones as studies looking at traits to ID ones haven’t worked
62
New cards
Types of Habitat Loss
• Fragmentation
o The redistribution of big patches to small patches
• Four spatial processes leading to habitat loss
o Shrinkage
o Bisection
o Fragmentation (native habitat is not connected)
o Perforation (native habitat is connected)
o The redistribution of big patches to small patches
• Four spatial processes leading to habitat loss
o Shrinkage
o Bisection
o Fragmentation (native habitat is not connected)
o Perforation (native habitat is connected)
63
New cards
Native habitat loss by biome
• TeG, Temperate grasslands: much of it gone by 1950+ rapid (-16%) recent losses
• TeB, Temperate broadleaf forests: much lost by 1950, little lost since
• BF, Boreal forests: little lost up to 1950, little lost since
• TeB, Temperate broadleaf forests: much lost by 1950, little lost since
• BF, Boreal forests: little lost up to 1950, little lost since
64
New cards
Asymmetry of habitat loss
•Often we assume forest harvest is habitat loss, but it is a disturbance that regenerates to forest so no ‘lost’ but rather considered habitat alteration or disturbance
65
New cards
Percentage of forests protected and species
• If we assume reverse SARs, we should be able to maintain 50% of the world’s species assuming the only space they got were protected areas (non-protected still has habitat)
66
New cards
Agricultural and sparing vs. sharing
• Although croplands are dominant in many areas many of them still retain some native habitat within the farm, although there has been a trend towards larger fields (removal of fence lines/hedges) for ease of mechanization (larger farming equipment).
• There is major debate about whether conservation should occur within each farm lowering yield (sharing) or triaging and separating high yield with no habitat from areas of habitat (sparing)
• More land was converted to cropland in the 30 years after 1950 than in the 150 years between 1700 and 1850
• Trade-offs in the spatial allocation of conservation of native habitat in farmland. Intensive agriculture of land sparing by focusing on yield within the most productive sites can result in less overall land needed for agriculture (total yield or calories of needed) and thus more for conservation, but locally that farm has low conservation value and it doesn’t benefit from positive ecosystem services provided by local habitat (pollinators)
67
New cards
Land Sharing
having wildlife-friendly farmland everywhere
o Conservation in agricultural areas
o Production benefits from ecosystem
o More land allocated to agriculture
o Less inputs (most self-sustainable agriculture)
o Diverse or associated crops
o Conservation in agricultural areas
o Production benefits from ecosystem
o More land allocated to agriculture
o Less inputs (most self-sustainable agriculture)
o Diverse or associated crops
68
New cards
Land sparing
some natural habitat, some high-yield farmland
o Conservation in separate areas
o Production intensification
o Less land allocated to agriculture
o More inputs to agricultural production
o Mono-cropping
o Conservation in separate areas
o Production intensification
o Less land allocated to agriculture
o More inputs to agricultural production
o Mono-cropping
69
New cards
Land sparing vs. sharing in forestry
• Land sharing: new paradigm in Alberta’s forest harvesting is toward in-block tree retention to emulate natural disturbances (fires), but his results in more area needed to achieve same yield (tree volume for mills)
• Land sparing: old paradigm in Alberta’s forest harvesting was called 2-pass harvesting where all the wood volume harvested in an area with a buffer of trees/stand about the same size separating harvest block. Then return later to harvest second part
• Land sparing: old paradigm in Alberta’s forest harvesting was called 2-pass harvesting where all the wood volume harvested in an area with a buffer of trees/stand about the same size separating harvest block. Then return later to harvest second part
70
New cards
Island Biogeography
• IBG theory: species richness on islands is due to dynamic equilibrium between colonization of new species and extinction of established species
• Colonization and extinction are in turn affected by island area (extinction) and isolation (colonization)
• Why not use species-area? Because it does not sufficiently explain island diversity patterns
• Colonization and extinction are in turn affected by island area (extinction) and isolation (colonization)
• Why not use species-area? Because it does not sufficiently explain island diversity patterns
71
New cards
What are the key processes driving IBG?
• Holding island size constant, colonization (immigration) rate decreases with distance
o (1) Better dispersers arrive first, followed by species with poor dispersal abilities
o (2) As the number of colonizing species increase, the number of new immigrant species arriving decreases (fewer species are available from the “mainland” source)
• Holding island distance (isolation) constant extinction rates decrease with island area
o (1) Small islands have small populations
This makes them vulnerable to extinction from demographic and environmental stochasticity
o (2) Small islands have fewer resources; more species = more competition
This keeps population size small, thus increasing extinction risk
72
New cards
SLOSS Debate
• Single Large Or Several Small
• Single, Large reserve from island biogeography (IBG) theory
o Better able to preserve intact communities
o Better to able to maintain viable populations that occur at low population densities and large territory sizes
• Several, Small reserves
o IBG doesn’t require the species on small islands be a subset (nested) of those on large islands
o Large is in the eye of the beholder; for some species (plants, small sedentary animals) a few hectares maybe all that is needed
o Spread the risk of catastrophic disturbance (spread you ‘eggs’ out)
• There is no right or wrong answer beyond the answer of ‘it depends’. In one sense, this is an academic exercise as rarely in the real world do we have the perfect comparison or conditions that match this, but regardless most conservation biologists would select Single Large sometimes without evidence to back up their opinion
73
New cards
Natural Experiments testing SLOSS
• Islands selected for their size to control for area
• Species richness of vascular plants per island
• If fragmentation negatively affects richness, we’d expect lower richness in smaller fragments vs. large fragments, but this isn’t the case
• Species-area relationship for SLOSS: Lines how expected diversity if no fragmentation effect (not deviating from SAR despite being in fragments)
• In a highly fragmented Mediterranean scrub, fragmentation by itself does not seems to influence the number of species for these taxa
74
New cards
Habitat loss is the big issue
• For most taxa, it appears that the spatial distribution of native habitat is far less important than just the amount of habitat. Although fragmentation is discussed a lot in conservation, it is the habitat loss itself that is the big issue (perhaps the biggest issue in conservation)
• There are likely exceptions, particularly for large ranging, large bodied animals (e.g., grizzly bears) because their territory needs are large and thus they need large patches
• Generally, the patch size needs of a species scales with their body size/mass
• There are likely exceptions, particularly for large ranging, large bodied animals (e.g., grizzly bears) because their territory needs are large and thus they need large patches
• Generally, the patch size needs of a species scales with their body size/mass
75
New cards
Managing uncertainty
• Management approaches when uncertainty is LOW:
o Maximum Sustained Yield
o Hedging
o Many environmental issues have HIGH uncertainty where Adaptive Management (high controllability) or Scenario Planning (low controllability) is appropriate
o Maximum Sustained Yield
o Hedging
o Many environmental issues have HIGH uncertainty where Adaptive Management (high controllability) or Scenario Planning (low controllability) is appropriate
76
New cards
Hedging
Represents low uncertainty, but also low controllability. This would represent a form of insurance (hedge) where for example foresters may leave extra volume due to the risk of catastrophic fire.
77
New cards
Maximum Sustained Yield
Where there is low uncertainty and high controllability like in forest harvesting or many fisheries (can control catch by setting limits with responses understood)
78
New cards
Adaptive management
• The cycle of integrated (adaptive) learning (‘learning by doing’)
• Is a systematic approach to improving resource management by learning from management outcomes
• Works in systems with high uncertainty, but are controllable
• Is best utilized when:
o (1) Multiple (competing) management objectives
o (2) Dynamic (complex) systems
o (3) Uncertain responses to actions
• Should NOT be used when monitoring can’t provide useful information and risks of learning is too high (endangered species)
79
New cards
Adaptive management examples
• Water management: what amount and timing of water release from a dam will maintain water quality, quantity and biodiversity?
• Wildlife management: how many animals should be relocated for long-term persistence?
• Habitat management: when and where should prescribed fire be used to maximize the persistence of rare fire-adapted species?
• Sometimes we are doing adaptative management without calling it that
• Wildlife management: how many animals should be relocated for long-term persistence?
• Habitat management: when and where should prescribed fire be used to maximize the persistence of rare fire-adapted species?
• Sometimes we are doing adaptative management without calling it that
80
New cards
Scenario Planning
Is used when there is high uncertainty and low controllability
81
New cards
Triage Principle
Myers (1980)
• Triage threatened species by dividing (prioritizing) species based on likelihood of survival with and without help
o (1) Low danger- ignore (probably will survive anyway)
o (2) Lost- ignore (probably can’t be saved anyway)
o (3) Acute danger- salvageable; concentrate limited conservation $ here
• Carl Jones
o Challenged the Triage approach by working with techniques learned from saving the peregrine falcon in North America could used to save Mauritius kestrel (1973 there were 8 individuals left, 2 nesting pairs)
82
New cards
Minimum population size: 50/500 rule
• Maintain Ne ≥ 50 to ensure short-term survival and to minimize the risks of inbreeding
o Buffer from inbreeding
• Maintain Ne ≥ 500 to ensure long-term survival through an ability to adapt to environmental change (enough genetic diversity)
o Provide a buffer of genetic diversity (for adaptation)
• Ne is effective population size – number of breeding individuals in a population assuming the same amount of dispersion of allele frequencies under random genetic drift (usually much smaller than the absolute population size, N)
83
New cards
The Mauritius Kestrel challenge to Triage and 50/500 rule
• One reason to triage species with very small numbers as “lost” is a concern over inbreeding depression and the extinction vortex via demographic stochasticity
• However, inbreeding depression may not be as much of a concern for island populations. Unlike tigers and lions on continents, the Mauritius kestrel has been confined to a tiny island throughout its whole history. Its population was never large and so always chronically small. Thus, the species must have already been chronically inbred
• Compared to an episode of acute breeding, chronic inbreeding prevents the accumulation of a heavy genetic load. It allows potentially lethal mutations to be combed out the population gradually
84
New cards
Minimum viable population
Is a threshold number of individuals that will ensure, with some level of probability, that a population will persist in a viable state for a given interval of time. Emphasis is on finding the minimum population size
• Rather than set rules of thumb for minimum populations sizes, it may be more appropriate to just calculate what each species Minimum Viable Population is which may be different than 50 or 500 rules for genetics
• The first to do this was Shaffer in 1978 for the Yellowstone grizzly bear where he asked what population size was needed to be 95% certain (can change certainty levels) that the population will persist for a specified period of time (he used 100 years)
o Was interested in the number of bears needed to be viable and area of protection needed (at the time grizzly numbers were very low in Yellowstone
o Minimum area needed estimated to be 1,000 km2 to 13,500 km2
• Implies some threshold number of individuals to ensure (with some risk) a population persists for a given interval of time
• Typically uses vital rates (death/birth) and their variability to estimate how stochastic events affect populations (simulate population growth in presence of stochasticity). Normally only done for a single population of a single species. It doesn’t consider other factors
85
New cards
Rule of 70
It takes 70 years to double a population if growing at 1% (time to double: divide 70 by growth rate %)
86
New cards
A key conservation tool is to protect places
• The process of planning for places to be protected is called Reserve Design or Conservation Planning
• Historically this was done in more of and ad hoc manner leading to biases in the distribution of protected areas
• We strive for protected areas to be representative of what is out there (environments, species, etc.)
• Current targets, including Canada, are 30% protection by 2030 (called “30 by 30”). Protected areas are a form of in situ conservation where we protected species in place
o Ex situ conservation is protecting them ‘out of place’ such as in a Zoo/Aquarium; a tool more common for endangered species
87
New cards
How do we 'represent' biodiversity if we can't easily measure it?
• Three main approaches for indexing biological values in Reserve Design:
o (1) Coarse-filter approach – representation of the full spectrum of ‘habitats’
Ex/ land cover/vegetation, soils, terrain features, etc. (“conserving the areas, not the actors” principle
o (2) Fine-filter approach – protecting rare species (or community) occurrences
Protect habitat around rare species occurrences (i.e., say a rare plant is known to a site, you protect that site)
o (3) Focal species approach – identify and protect habitats for selected species that are sensitive to disturbances or ecologically important
Uses suites of species tied to key limitations, such as: (1) area-limited species like grizzly bears; (2) dispersal-limited species; (3) resource-limited species; process-limited species (perhaps those tied to fire); Caribou an example of using focal species to promote conservation of boreal forests
• Some species are assumed to have “Umbrella” effects to other biodiversity
88
New cards
Irreplaceability
is the concept that some sties are more valuable in others in that they contain things not found elsewhere and thus irreplaceable. Prioritize these first
89
New cards
Complementarity principle
is that the most important next place to protect is that which is most different from what you already have protected (i.e., protect sites that are different, not more of the same)
90
New cards
Restoration: Bring back what you used to have
• In some places, there is little left to protect, so conservation paradigm = restoration
• Use of historical models are controversial
o (1) Ignores the dynamic nature of ecosystems and places; reference conditions perhaps from a time of different climates? (e.g., Little Ice Age)
o (2) Scientists are generally abandoning the ‘balance of nature’ and ‘static’ paradigm in favour of “flux of nature paradigm” (only constant in nature is change)
o (3) However, goals/targets are needed for restoration, otherwise management actions can’t be defined and assessed
91
New cards
Example: Pleasant Valley Conservancy Natural Area
Structural manipulation-based restoration of a bur oak (Quercus macrocarpa) savanna using selective harvest of smaller (younger) trees and herbicide treatments on invasive shrubs/trees followed by fire and then re-seeding of local prairie plant species
92
New cards
Field of dreams hypothesis
If you build it (i.e., habitat), they will come (i.e. organisms); this will lead to ‘normal’ composition and function
Alternate = F of D myth:
o Restoration of a site without consider the context of the surround landscape will not in the long-run be successful. You cannot rely on landscape rescue effect alone (substantial inputs [species] may be needed)
Alternate = F of D myth:
o Restoration of a site without consider the context of the surround landscape will not in the long-run be successful. You cannot rely on landscape rescue effect alone (substantial inputs [species] may be needed)
93
New cards
Field of dreams relies on a 'rescue effect'
• (1) Immigration (dispersal) is an important regional process that interacts with local conditions to enhance/support species richness (including restoration projects)
• (2) Adjacent, patchy populations provide a “source” (immigrants) for disturbed or declining populations (“sinks”)
• (3) The rescue effect – species richness can be maintained at higher than expected levels when population sinks (perhaps they are poor competitors) are maintained by immigration from nearby source populations
• (4) Location and context of restoration site therefore matters
94
New cards
Assisted Migration
• Assisted migration (colonisation) has recently been suggested as a proactive (anticipatory conservation) tool for dealing with climate change
• (1) Move species poleward or upward that lack natural connectivity, yet face climate change stresses
• (2) Could be as simple as driving a species north in your car; growing coral reefs outside their current range by placing cultured coral on concrete blocks; or capturing an endangered butterfly and host plant) and taking it to cooler sites
• Torreya taxifolia (Florida Torreya or stinking cedar) survives as
95
New cards
Mitigation's black eye
implies that any habitat destruction can be remediated thus permitting or even encouraging habitat destruction since they assume it can be mitigated in other areas to “balance” the overall loss. This may encourage habitat destruction of native habitats
96
New cards
Savanna Hypothesis
• A broad survey of art preferences of people from Asia, Africa, Europe, and Americas found cross-cultural preference for realistic painting that include water, trees and other plants, human beings and animals, especially large mammals. Same structure is preferred in preference teats of photographed landscape
• Human evolution took place in the East African savanna. Thus, Orians predicted that landscape features characteristic of this environment should be preferred over those found in more dry or moist tropical habitats.
• Human evolution took place in the East African savanna. Thus, Orians predicted that landscape features characteristic of this environment should be preferred over those found in more dry or moist tropical habitats.
97
New cards
Biobigotry
is the persistent and often irrational desire to be surrounded only by those species of which one approves and to exclude any animals, plants, and other life forms that one finds
98
New cards
Opposing ways of 'valuing' nature
• Economic value
o Quantifying direct economic value (harvest, license fees, sales of wild foods like mushrooms or fish, recreation, etc.)
o And indirect economic values that are harder to quantify such as ecosystem services (purifying water, sequestering carbon, etc.)
• Intrinsic value
o Cultural values
o Aesthetics
o Ethics (idea of extending rights; acknowledging that organisms and nature in general have the right to exist without the need to invent a reason)
99
New cards
Motives (controls) for conservation
Legislation
Self-interest (economics, etc.)
Ethics (intrinsic value)
Self-interest (economics, etc.)
Ethics (intrinsic value)
100
New cards
Leopold's Half Umbrella Principle
Conservation of public lands but not private lands is like buying half an umbrella
o You only do conservation on half
o You only do conservation on half