AP statistics chapter 5 Stats modeling the world third edition by David E. Bock
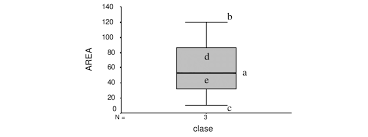
This chapter introduces us to boxplots which display the 5 number summary. It also introduces a way to compare boxplots using far outliers and comparing them with the Interquartile range. Furthermore it also introduces timeplots, which are a type of graph that shows the change over time of specific values. ● Five-number summary: it consists of the smallest data value, the first quartile, the median, the third quartile, and the largest data value ● Quartile: a section that equals the 25% of the values