chapter 16
1/21
There's no tags or description
Looks like no tags are added yet.
Name | Mastery | Learn | Test | Matching | Spaced |
|---|
No study sessions yet.
22 Terms
descriptive statistics
Summarizes data through central tendency, variability/spread, and frequency.
inferential statistics
The process of using data analysis to infer properties of an underlying probability distribution and apply it to a larger population.
unskewed curve
data that falls under normally distribution and also shares the same mode, median, and mean.
unimodal data
there is only one mode and it appears at the center of the normal distribution curve.
multimodal data
there are multiple modes in the data set.
three factors to why studying standard normal distribution curve is important
describes distributions of responses to a particular survey question.
interprets the magnitude of a standard deviation.
determines the probability of observing any particular level of response.
M±1SD
68% of data fall under this range
M±2SD
95% of data fall under this range
M±3SD
99.7% of data fall under this range
hypothesis testing
testing if the observed difference is real, based on the sampling distribution.
Group Difference Hypothesis
finding a pattern or difference regarding a variable between two different groups. (gen z have more screen time per day than gen x.)
Sample vs Population Hypothesis
finding a pattern or difference regarding a variable between the sample and the general population. (UT students, on average, will have a higher IQ than that of the general population.)
central limit theorem
The distribution of sample means will be normally distributed after repeated sampling. The data will become more centered over time, and fewer outliers will exist.
sample distribution
continuously sampling from the total data.
statistical significance (α or p-value)
a concept that expresses whether the relationship between two variables is real or is just due to chance. The value exists between 0-1. “Proving if the data is statistically significant.”
level of significance
The probability that the relationship has occurred by chance. A lower level of significance means a lower ability for chance to affect the data and a higher level of confidence. (A good level of significance is less than or equal to 5%.)
statistical significance vs level of significance
The level of significance/chance is the statistical significance as a percentage. if α = 0.04, the level of significance is 4%.If
confidence level
The probability, expressed as a percentage, that a confidence interval will contain the true population parameter (a good confidence level is about 95%; Confidence Level = 1 - α).
p-value and sample size
the p-value becomes smaller as sample size increases because there is less room for chance to occur because reliability increases as repeated sampling is done.
t-test
a statistical test that checks for statistical significance by comparing two groups’ means.
t-test formula
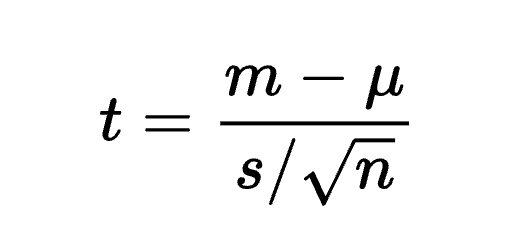
The t-value is equivalent to the difference of the sample means over the quotient of the sample’s standard deviation divided by the square root of the sample size.
t-value with standard deviation and sample size
high standard deviation or sample size means lower t-values and vice versa.