paper 3 practical skills
1/90
There's no tags or description
Looks like no tags are added yet.
Name | Mastery | Learn | Test | Matching | Spaced |
|---|
No study sessions yet.
91 Terms
how do you write an experimental method?
independent and dependent variable
experimental technique
graph
what is involved in the independent and dependent variable section when writing an experimental method?
identify independent and dependent variables (i.e., how the independent variable will be varied)
state how each variable will be measured, with the correct measuring device
state the range and interval of the independent variable for the investigation
what should the range be in an experimental method?
the independent variable range must be as large as possible whilst still being safe to carry out the experiment
the interval of the independent variable should give at least 5 values for the dependent variable. this will allow for a line of best fit, or a ‘trend’ to be established easily
what is the experimental range?
the set of values for which the conclusion / trend / values are valid for
what is involved in the experimental technique section when writing an experimental method?
identify any control variables and how they will be controlled
identify any way the experimental technique can be modified to reduce uncertainty
discuss carrying out repeated measurements and calculating averages if appropriate
until when should measurements be repeated in an experiment?
until concordance (consistence results) is achieved with the values, to reduce the random error of the results
what is involved in the graph section when writing an experimental method?
state the graph that would be drawn
if you need to derive a value from a graph, look at the ways the y and x axis can be adjusted to get a straight line of best fit (i.e., make them proportional)
put the experimental equation into the form y = m x + c and work out how to calculate the wanted value
how do you draw a graph you can derive results from?
by making it a straight line - manipulate the y and x axis values until you get a proportional relationship, then adjusting the equation into the form y = m x + c
what should you consider when planning an experimental method?
does the method actually test what it is being asked to?
is the method clear enough for someone else to follow?
apart from the independent variable, what is being controlled and how?
are the apparatus and techniques appropriate for what is being measured? will they be used correctly?
will the method give precise results?
are repeated measurements needed to be taken in the experiment?
is the experiment going to be conducted safely and ethically?
what are some tips for getting full marks on a planning / evaluating experiment methods question?
students should be encouraged to describe how to change one variable and to give suitable ranges of values as well as specifying how many sets of results to take
students should describe graphical methods of processing results, including, where relevant, the significance of intercepts and gradients
to gain credit for suggesting repeating measurements, students must be specific about which readings are repeated and they must mention the averaging of those measurements (also talk about why repeated measurements are taken; to reduce random error)
students found it harder to describe the way in which a suitable range of sets of results could be obtained, and few mentioned the advisability of taking repeat measurements of each set of pd and current in order to find mean values
many students suggested that a graph is straight when the suggested relationship is correct, few mentioned that it goes through the origin
details on how to vary the independent variable and how to record the value of the dependent variable should be considered
knowing how to process the data to obtain a straight line graph
students should use the words ‘read’, ‘measured’, or ‘recorded’ when discussing the dependent variable
students can give an expression to show how their gradient could be manipulated to obtain a value, but examiners are expected for the value to be the subject of this expression
what does the graph look like when the suggested relationship is correct?
providing its not a negative gradient, straight lines that goes through the origin
why do we want to improve the experimental technique?
to reduce overall percentage uncertainty
how do we reduce overall percentage uncertainty?
by improving the experimental method
what are some things we should consider to reduce the overall percentage uncertainty (i.e., improving an experimental method)?
how extra results can be taken and used
consider how to measure values accurately
be specific to the experiment about the error and the correlation
consider how percentage uncertainty could be reduced, either by decreasing absolute uncertainty or increasing the measured values
consider how to control variables
what are some common problems caused in an experimental method using a ball bearing and craters?
there are not enough results to draw a valid conclusion
the ruler is too wide to measure the depth of the crate
they may be a parallax error when measuring the top level of the crater
it is difficult to release the ball bearing without giving it a sideways velocity, leading to a distorted crater
the crater lip is of varying height
what are the solutions to some common problems caused in an experimental method using a ball bearing and craters?
there are not enough results to draw a valid conclusion
take more results and draw a graph of D against d
the ruler is too wide to measure the depth of the crater
use a knitting needle (or something similar) and mark the sand level on the needle, then measure with a ruler
they may be a parallax error when measuring the top level of the crater
keep the eye parallel to the horizontal level of the sand, or use a stiff card
it is difficult to release the ball bearing without giving it a sideways velocity, leading to a distorted crater
use an electromagnet to release the ball
the crater lip is of varying height
always measure the highest point
what is the graph for an experiment method using ball bearings and craters?
D (diameter) against d (distance)
what are some common problems caused in an experimental method using freefall?
there are not enough readings to draw a valid conclusion
it was difficult to start the stopwatch at the same instant the stone was dropped, and to stop it exactly as it it hit the ground because of my reaction time (human error)
my hand was not steady and so i may not have dropped the stones from exactly the same height each time
the heavier stone was larger in size and it was important that the bottom of each stone started at the same height. there may have been parallax error
the times that i measured were very short (not much greater than reaction time) so reaction time had a great effect
what are the solutions to some common problems caused in an experimental method using freefall?
there are not enough readings to draw a valid conclusion
a great range of masses should be used, and a graph should be plotted of the average time to fall to the ground against the mass of the object
it was difficult to start the stopwatch at the same instant the stone was dropped, and to stop it exactly as it it hit the ground because of my reaction time (human error)
film the fall of each stone with a video camera which has a timer. when the video is played back, frame by frame, the time the ball is dropped and hits the ground can be seen (alternatively, use a light gate)
my hand was not steady and so i may not have dropped the stones from exactly the same height each time
use iron objects which hang from an electromagnet. when the current in the electromagnet is switched off, the object falls
the heavier stone was larger in size and it was important that the bottom of each stone started at the same height. there may have been parallax error
clamp a metre ruler vertically and start the bottom of each stone at exactly the top of the ruler each time. to avoid parallax error, ensure line of sight is horizontal and at right angles to the ruler
the times that i measured were very short (not much greater than reaction time) so reaction time had a great effect
increase the distance of fall so that the times are larger. this will make the uncertainty in each time measurement smaller in proportional to the time being measured
what is the graph for an experiment method using freefall?
average time to fall to the ground against object mass
what are some common problems caused in an experimental method using oscillations?
there are not enough readings to draw a valid conclusion
it was difficult to judge the end of the swing
the oscillations died away too quickly
the times were too small to measure accurately, as reaction time was a significant fraction of the total time
it was difficult to measure the length to the centre of gravity of the weight accurately
what are the solutions to some common problems caused in an experimental method using oscillations?
there are not enough readings to draw a valid conclusion
use more than two lengths and plot a graph of the average time squared against the length of string
it was difficult to judge the end of the swing
use a fiducial mark at the centre of the oscillation as the position to start and stop the stopwatch.
use an electronic timer placed at the centre of the oscillation to measure the time.
make a video of the oscillation with a timer in the background and play it back frame and frame.
the oscillations died away too quickly
use a heavier mass which swings longer
the times were too small to measure accurately, as reaction time was a significant fraction of the total time
use longer strings.
increase the number of oscillations measured.
it was difficult to measure the length to the centre of gravity of the weight accurately
use a longer string so any errors are less important.
measure the length to the top of the weight and use a micrometer to measure the diameter of the bob and add on half the diameter to the length of string.
what is the graph for an experiment method using oscillations?
average time squared against string length
what are some common problems caused in an experimental method using forces?
there are not enough readings to draw a valid conclusion
it was difficult to zero the newton-metre used horizontally
the reading of F was very low on the scale and gave a large percentage uncertainty
the block starts to move suddenly and it is difficult to take the readings when this happens
different parts of the board are rougher than others
what are the solutions to some common problems caused in an experimental method using forces?
there are not enough readings to draw a valid conclusion
use more than two masses and plot a graph of the force against the mass
it was difficult to zero the newton-metre used horizontally
use a force sensor and a computer.
use a pulley and string to connect a tray to the block, then tip sand onto a tray until the block starts to move. the weight of the sand and tray is then the force.
the reading of F was very low on the scale and gave a large percentage uncertainty
use heavier masses on top the block
the block starts to move suddenly and it is difficult to take the readings when this happens
video the experiment and play back frame by frame to see the largest force.
use a force sensory and a computer.
different parts of the board are rougher than others
mark round the block with a pencil at the start and put it back in the same place each time
what is the graph for an experiment method using forces?
force against mass
what are some common problems caused in an experimental method using resistivity?
there are not enough readings to draw a valid conclusion
difficult to measure the length of wire as the clips have width and i don’t know where inside they grip the wire
the scale is not sensitive enough and can only measure to 0.05 V
the values of voltage are small, particularly at 0.3 m
the voltmeter reading fluctuates because of contact resistance
other factors may have changed the resistance, for example, the temperature may have increased because of the current
what are the solutions to some common problems caused in an experimental method using resistivity?
there are not enough readings to draw a valid conclusion
use more than two lengths and plot a graph of the voltmeter reading against the length.
calculate more than just two values of k.
difficult to measure the length of wire as the clips have width and i don’t know where inside they grip the wire
use narrower clips.
solder the clips onto the wire.
the scale is not sensitive enough and can only measure to 0.05 V
use a voltmeter that has a higher reading, e.g., 0.01 V.
use a digital voltmeter.
the values of voltage are small, particularly at 0.3 m
use a larger current so that when l = 0.5 m the voltmeter reading is at the top of the scale
the voltmeter reading fluctuates because of contact resistance
clean the wires with wire wool first
other factors may have changed the resistance, for example, the temperature may have increased because of the current
wait a long time until the wire has reached a constant temperature.
use smaller currents, but with a more sensitive voltmeter.
what is the graph for an experiment method using resistivity?
voltmeter reading against length
what should you consider when analysing or evaluating given experimental results?
what patterns are shown in the experimental data
was the experimental data valid and precise?
how accurate is the experiment value measured?
is the resolution of the measuring instrument high enough?
is there any anomalous results? if so, what caused this?
is there any anomalous results? if so, what has caused this?
how large is the percentage uncertainty? how large is the percentage difference?
have all the variables been controlled and monitored? if not, how could they have been controlled?
what has caused any systematic or random error?
how could the percentage and absolute uncertainty be reduced?
when is experimental results valid?
over the experimental data gathered. trends can be extrapolated, but it does mean it will continue as there is no evidence to suggest this
what are the main types of error?
systematic and random
what is systematic error?
errors which cause the same uncertainty on the experimental results, e.g., zero error
what are random errors?
errors which cause different uncertainties on the experimental results, e.g., parallax error
what is the absolute uncertainty?
total systematic and random error
how do you reduce the percentage uncertainty?
use larger values for experimental results
use a measuring device with a greater resolution
good equipment and good technique
what is the impact of systematic error?
changes the intercepts of the graph, but not the gradient
what is the impact of random error?
changes the intercept and gradients of the graph
makes the line of best fit difficult to plot
how do we reduce systematic error?
compare the results with the expected results and subtract the error
calibrate equipment by the error measured when comparing results with given results
how do we reduce random error?
carry out repeats until concordant results are achieved. remove anomalies and calculate mean
why are there systematic errors?
the way in which measurements are taken
faulty measuring devices
why are there random errors?
factors that are not controlled in the experiment
the difficulty in deciding on the reading given by a measuring device
what is accuracy?
how close the measurement result is to the true value. the closer it is, the more accurate
what is precision?
how close repeated measurements are to each other. the closer repeated measurements are, the more precise the measurement
is a precise reading one that does not vary widely?
yes, unless the device is measured with a low resolution
what is resolution?
the smallest increment in the measured quantity that can be shown on the device
how can precision be improved?
by repeating the measurements and removing the anomalies
carrying out ‘bigger’ measurements (e.g., measuring 10 m instead of 1 m)
how can accuracy be improved?
carrying out ‘bigger’ measurements (e.g., measuring 10 m instead of 1 m)
what are valid results?
results from a suitable procedure that answer the investigation question
what is repeatable?
results are repeatable if you can repeat an experiment multiple times and get the same results
when are results reproducible?
if another team of experiments can recreate your experiment using different equipment or methods and get the same results
what is division?
like, the scale of each line on a measuring thing. resolution
how can you align an object vertically?
set square
parallel to a plumb line
parts of a micrometer
main scale on the shaft
fractional / thimble scale on the rotating barrel / thimble
50 divisions on the barrel, so one rotation of the barrel moves the end of the barrel 0.5 mm along the shaft
each division represents 0.5 / 50 = 0.01 mm
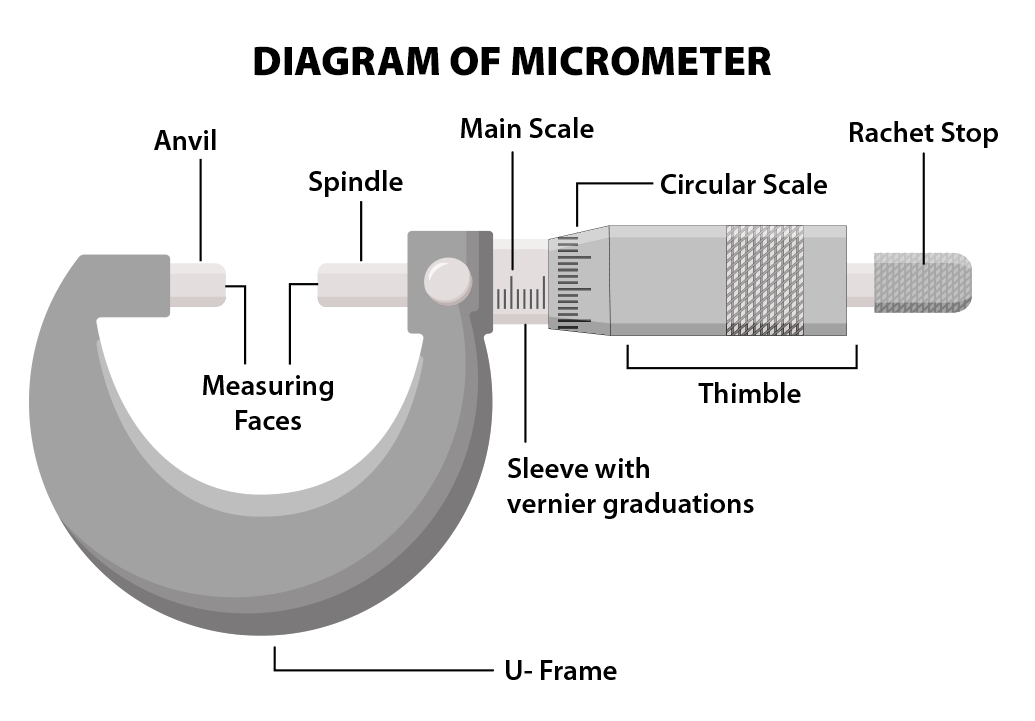
where is the main scale on a micrometer?
on the shaft (sleeve)
where is the thimble scale on a micrometer?
on the rotating barrel (thimble)
how many divisions are on the barrel of a micrometer?
50, so one rotation of the barrel moves the end of the barrel 0.5 mm along the shaft
what is the resolution of a micrometer?
0.1 mm for the thimble scale, each division is 0.01 mm
0.5 mm for the main scale, each division is 0.25 m
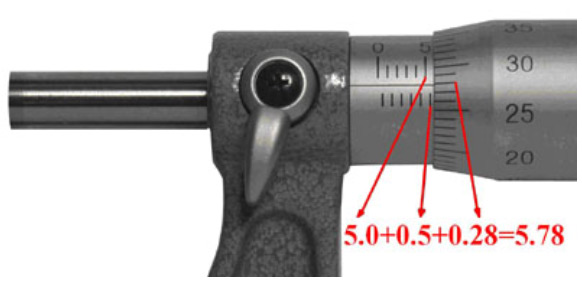
how do you use a micrometer?
spindle and anvil clamped around object using the ratchet and not the barrel. it should be tight enough for the object to not fall out but not so tight as to not deform it
each division represents 0.5 mm on the main scale. each division represents 0.1 on the thimble scale
read the number that aligns with the main scale and multiply it by 0.01
final measurement = main scale + thimble scale
how do you check the zero error on a micrometer or dial caliper?
bringing the jaws together without any object between them. this zero error (if there’s any) should be added or subtracted to every other reading that you have. if the jaws do not quite close to the zero mark, there is a positive zero error, and this error should be subtracted
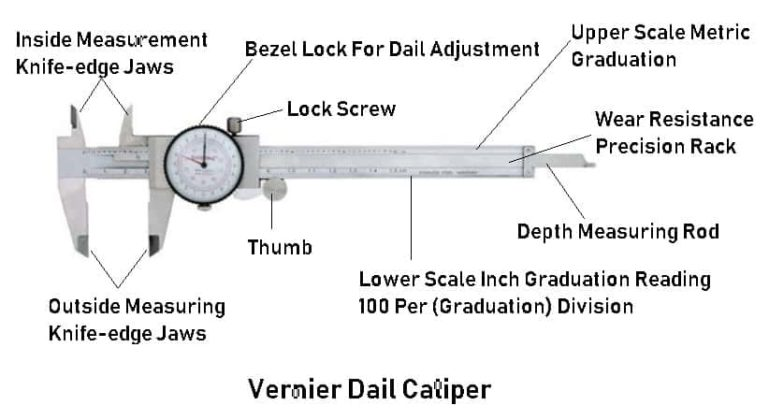
what is the difference between a micrometer and a vernier calliper?
micrometer measures diameters and thickness
vernier callipers also measures that, but they can also measure the length of small objects such as a screw or the depth of a hole. they can also measure internal diameter
parts of a vernier calliper
jaws for external measurements
prongs (internal jaws) for internal measurements
dial
locking screw
main scale
vernier scale
do this later i so don’t give a fuck
resolution of vernier scale
how do you use a vernier calliper?
read off the centimetre mark to the left of the vernier scale
what are analogue metres?
like a normal scale. displays values on a dial, usually with a needle or moving pointer
what is good about analogue metres?
easy to see a change
scale can be changed easily
what is bad about analogue metres?
they can cause experimental error as they are susceptible to parallax error
how do we reduce the parallax error when reading from an analogue metre?
by reading the measurement at eye level
using a plane mirror - plane mirror placed behind the pointer. the image of the pointer must be directly behind the pointer to ensure the observer views the scale directly face on
what is the range of an analogue metre?
its full scale deflection (i.e., what it goes up to). this full scale deflection must be large enough to record all results in your investigation. if the full scale deflection is too large then its not sensitive enough to accurately record the results
what is the interval of an analogue metre?
the difference between each point on the scale of the meter
what do you do with a numerical value of error?
write a range, with + or - the error. it can also be written as a percentage uncertainty
what do we consider when evaluating uncertainty?
resolution of instrument used
manufacturer’s tolerance on instruments
judgements that are made by the experimenter
procedures adopted (e.g., repeated readings)
size of increments available (e.g., the size of drops from a pipette)
how can we calculate uncertainty?
calculating uncertainty due to the measuring device used
calculating uncertainty due to experimental technique
calculating uncertainty due to stated value given
calculating uncertainty due to variation in readings
what is the distance between uncertainty and absolute uncertainty?
same thing. say absolute uncertainty
how can we calculate uncertainty due to the measuring device used?
taking a reading. its a single judgement
taking a measurement. the value as the difference between two judgements
which measuring devices give readings (i.e., one judgement)?
thermometer
top pan balance
measuring cylinder
digital voltmeter
geiger counter
pressure gauge
which measuring devices give measurements (i.e., two judgements)?
ruler
vernier calliper
micrometer
protractor
stop watch
analogue metre
what is the uncertainty in a reading?
+ or - half the smallest division
what is the uncertainty in a measurement?
+ or - half the smallest division. as there is uncertainty for both values, the absolute uncertainty is + - 1 (i.e., the value of the division)
what is the uncertainty due to the experimental method?
these are things like human error (reaction time)
when measuring a wire, its the wire not being straight along the ruler
faulty electrics in an instrument
there is no ‘right’ value. you estimate the value added to the uncertainty, as this needs to be included in the absolute uncertainty. typically add one or two the division
what do you also need to find the uncertainty of?
values given in the a question or in the data sheet. we assume the uncertainty to be + or - 1 in the last significant digit
how do we calculate uncertainty due to the variation in readings?
when we have multiple values and we take a mean, the absolute uncertainty can be calculated from the variation in the repeated readings, using the maximum and minimum possible values. we use the largest possible range to reduce uncertainty. there is uncertainty in all equipment, and the absolute uncertainties of all must be added
remove the anomalous values
find the range (max possible value - min possible values)
the uncertainty is + or - the range / 2. the belief is that the true values in the centre of this range
percentage uncertainty =
absolute uncertainty / value x 100
absolute uncertainty / mean value x 100
what is the absolute uncertainty of adding and subtracting?
add the uncertainties
what is the absolute uncertainty of multiplying and dividing?
adding the percentage uncertainty
what is the absolute uncertainty of powers?
multiply the percentage uncertainty by the power (e.g., for stuff like area)
what does directly proportional mean?
the values increase / decrease in the same proportional as each other.
y = k x , so the gradient (y / x) gives the constant of proportionality
what does inversely proportional mean?
when one value increases, the other value decreases in the same proportion
y = k / x , so y x x gives the constant of proportionality
how do you find the value when the graph is a curve?
draw a tangent at that point and find the gradient. this is a measure of instantaneous rate of change
how can you check for anomalies using error bars?
It’s an anomaly when the line of best fit does not go through any error bars
How do we find the percentage uncertainty of the gradient?
(Best grad + worst grad) / best grad x 100
What is the absolute uncertainty of gradients?
Best grad - worst grad