2. Visual Encoding
1/27
There's no tags or description
Looks like no tags are added yet.
Name | Mastery | Learn | Test | Matching | Spaced | Call with Kai |
|---|
No analytics yet
Send a link to your students to track their progress
28 Terms
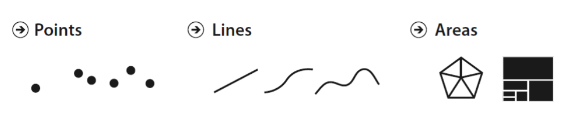
What are the 2 building blocks of data visualizations?
Marks and channels
What are “marks” in data visualization? Give examples.
Marks are the visual objects used to represent data - e.g., points, lines, and areas.
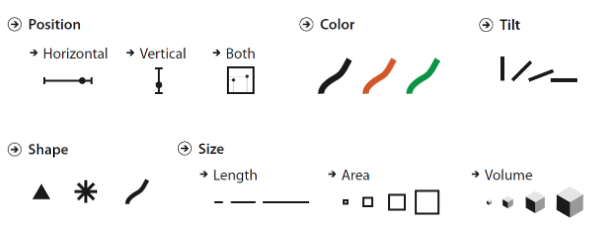
What are “channels” in visualization? Give examples.
Channels are visual properties of marks that encode data - e.g., position, color, size
What is the expressiveness criterion for visual mappings?
A visualization must encode all intended data relations and encode no unintended relations.
What is the effectiveness criterion for visual mappings?
A mapping is effective if it best leverages human visual perception and the display medium to support the task - e.g., using position instead of color for quantitative data.
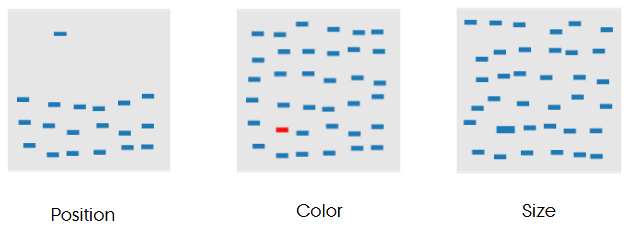
What are preattentive visual cues? Give three examples.
Features detected almost instantly without conscious effort - e.g., position, color, size
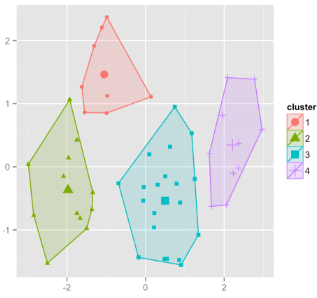
Name three Gestalt principles relevant to visualization.
Proximity, Similarity (color/shape), Enclosure
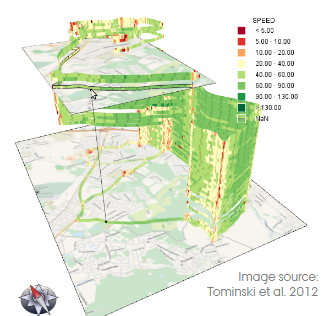
What visualization problems arise when using 3D charts?
Occlusion, perspective distortion, non-anchored points, navigation/orientation problems, selection difficulty.
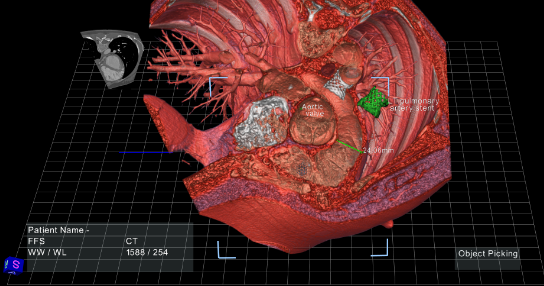
When is it appropriate to use 3D visualizations?
Only for inherently 3D data (e.g., volume data) and not for ordinary 2D data like pie charts.
What is luminance, and why is contrast important?
Luminance = perceived brightness (computed from RGB).
Contrast = luminance difference; for readability, avoid contrast ratios < 3:1.
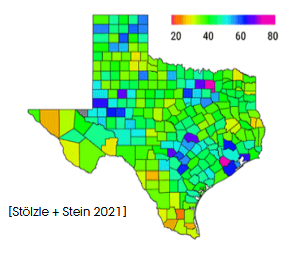
Why is the rainbow color scale criticized?
It is not perceptually equidistant, implies categories, creates ambiguous ordering, and is not colorblind-safe.
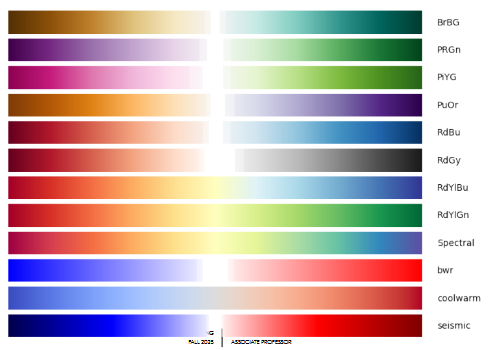
What are diverging color scales used for?
They encode deviation from a meaningful center (e.g., zero), using two hues diverging, e.g., with increasing luminance.
Why is direct labeling preferred over legends?
It reduces cognitive load by placing labels next to the marks, avoiding back-and-forth eye movement.
Name two challenges of direct labeling.
Occlusion in dense areas and placement difficulty for long labels.
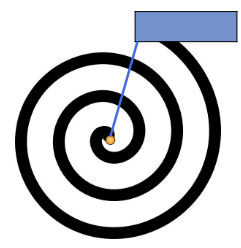
What is particle-based labeling?
A labeling method that first tests fixed candidate positions; if these collide, labels - treated as repelling particles - are moved along a spiral path until a non-overlapping placement is found.
What is semantic color coding?
Choosing colors that carry meaning consistent with the data (e.g., red = heat), rather than arbitrary hues.
What is the difference between marks and channels?
Marks define what is drawn; channels define how it varies to encode data.
Which operations differentiate data types (categorical, ordinal, quantitative)?
Categorical → match
Ordinal → sort
Quantitative → compare/difference/interpolate.
What is the appropriateness (efficiency) criterion?
A visualization should balance creation effort with analytical benefit.
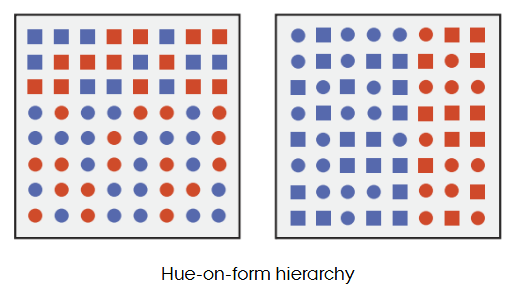
What does the hue-on-form hierarchy show?
Hue is perceived before shape when both vary
What does the luminance-on-hue hierarchy show?
Luminance is perceived before hue when both vary

Why are Gestalt principles useful in visualization?
They guide how viewers group elements, helping reveal structure.
What is 2.5D and when is it used?
2D visualization with depth-like stacking; used when limited 3D separation is helpful but full 3D isn't needed.
What is a perceptually uniform color space?
A space where equal numeric changes ≈ equal perceived differences (e.g., HCL).
Why is colorblind-safe design important?
Red-green distinctions often fail under protanopia/deuteranopia; alternative palettes (or use of other channels, such as shapes) reduce misinterpretation.
What are plain vs. excentric labels?
Plain = placed directly next to mark
Excentric = connected via a line when nearby placement is not possible.

Why does excentric labeling increase visual complexity?
Connecting link increases visual complexity, especially in the presence of edges.
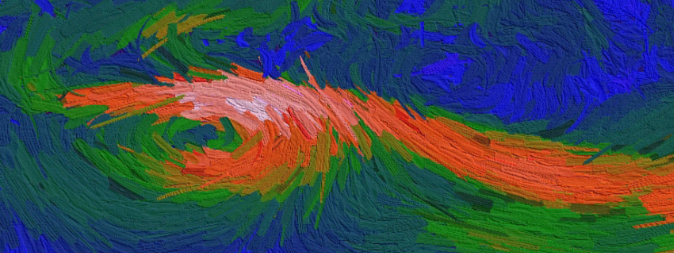
What is impressionistic visualization?
A rendering style using sketchy or artistic strokes to emphasize uncertainty or exploration.