AP macro - unit 4
1/80
There's no tags or description
Looks like no tags are added yet.
Name | Mastery | Learn | Test | Matching | Spaced |
|---|
No study sessions yet.
81 Terms
45 degree line
where disposable income = consumption
y axis of income (DI=C) relationship
consumption
dissavings
when consumption is above disposable income (occurs at lower DI levels)
average propensity to consume
avg. percentage of income that is spent
APC calculation
consumption/income
APS calculation
savings/income
average vs. marginal propensity
average = total, marginal = of additional income
MPC calculation
change in consumption/change in income
MPS calculation
change in savings/change in income
main nonincome determinant of consumption / savings
disposable income
wealth
assets - liabilities
wealth effect
wealth rises, consumption rises, savings decreases
determinants of wealth (and eventually DI)
borrowing, expectations, real interest rate
how does borrowing effect consumption?
increased consumption now, decreased consumption later
borrowing effect
reduces wealth by increasing liabilities
expectations effect
high expectations = more consumption, low expectations = less consumption
effect of real interest rates
lower rates = more borrowing = more consumption now, less later (less saving)
why real GDP, not DI
output drives DI for nation
what causes changes in amount consumed?
changes in real GDP
what causes a change in the consumption schedule?
changes in nonincome determinants
effect of increased taxes on consumption schedule
consumption and savings decrease
effect of decreased taxes on consumption schedule
consumption and savings increase
MB
expected rate of return on investments
MC
investment’s real interest rate
r (expected rate of return) calculation
profit/cost
i (real interest rate)
price of financing investment
i < r
invest
i > r
no investment
investments are less risky at ______ rates
lower
investments are more risky at ______ rates
higher
investments are more unstable/volatile due to
expectations, innovation, durability, profit
demand shocks
what do unstable investments cause
reason for multipliers
chain of initial income changes magnifies effect
multiplier equation
change in real GDP/change in spending
MPC multiplier equation
1/1-MPC
MPS multiplier equation
1/MPS
private closed economy
C + Ig
real domestic output
amount of output firms are willing to produce as long as costs are covered/exceeded
equilibrium GDP
spending is equal to output
savings = planned _________
invesment
spending > production
unplanned reduction of inventory - more profit, more production
spending < production
unplanned increase in inventory - less profit, less production
cumulative effect of changes in C + Ig
effect of change accumulates because spending is income for someone else
private open economy
C + Ig + Xn
effect of negative net exports
decreased aggregate expenditures / EQ GDP
international linkages
prosperity abroad, exchange rates, tariffs/devaluing
value of american dollar drops (Xn linkage)
greater consumption from international consumers
value of american dollar increases
international consumption decreases
open mixed economy
C + Ig + Xn + G
which has a greater impact on EQ GDP: gov. spending or taxes
government spending
recessionary gap
gap between aggregate expenditures and full employment GDP, usually due to unemployment
keynes’s solution to recessionary gap
inc. government spending, dec. taxes
inflationary expenditures
where full employment GDP exceeds what is required to achieve FE GDP, all workers are employed
effect of inflationary gap
demand pull inflation
aggregate demand PL/output relationship
negative; greater PL = lower output, lower PL = greater output
real balances effect (ADC)
higher price level reduces purchasing power of society’s savings (less consumption)
interest rate effect (ADC)
higher price level increases demand for money, raises real interest rate
foreign purchasing effect (ADC)
higher price level makes U.S. goods more expensive relatively (lowers Xn)
what can change aggregate demand
consumer spending, investment spending, government spending
MPC
change in consumption/change in income

aggregate supply in the immediate short run
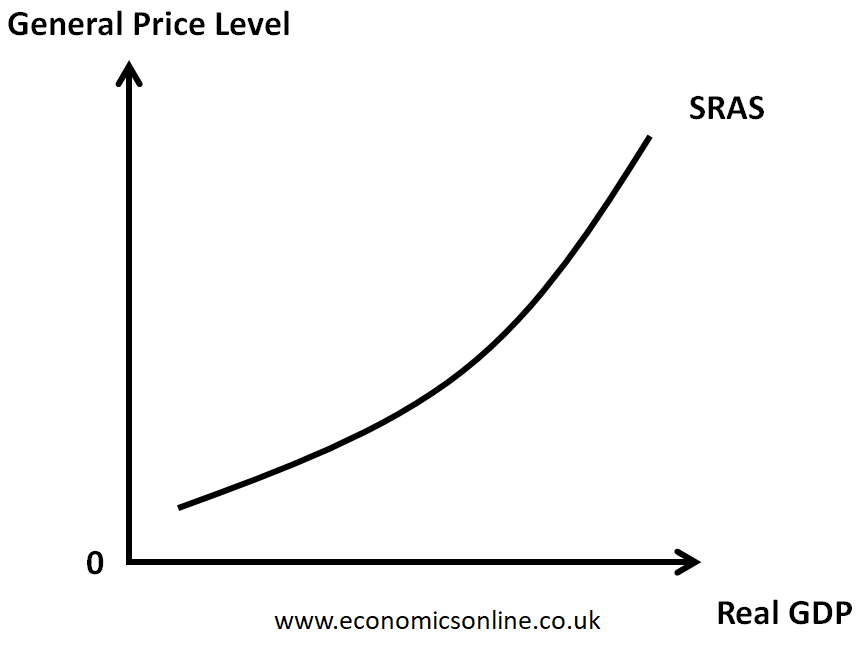
short run aggregate supply graph
aggregate supply in the short run
where output prices are flexible but input prices are fixed
why does the AS graph (short run) slope upwards
output prices outpacing input prices = profit
aggregate supply in the long run
input and output prices are flexible; input prices are full responsive to output prices
effect of aggregate expenditures > output
inflationary gap
effect of output > aggregate expenditures
recessionary gap
tax multiplier
mpc/mps
spending multiplier
1/mps
productivity
total output/total input
increases in aggregate demand
demand pull inflation
decreases in aggregate demand
recession + cyclical unemployment
decrease in aggregate supply
cost push inflation
increases in aggregate supply
full employment and price level stability
effect of decreased AS
price level increases, recession, unemployment
effect of increased AS
offsets inflation (good, not something we try to fix)
discretionary policy
active and intentional change; needs government action (ex: changing taxes / gov. spending)
expansionary fiscal policy
fights recession/unemployment by increasing AD, surpluses decrease or deficits increase (inc. real GDP)
options for expansionary fiscal policy
increased gov. spending, tax reduction, or both
contractionary fiscal policy
fights inflation by reducing AD, increases budget surpluses or decreases budget deficit (decrease real GDP)
options for contractionary fiscal policy
decreased government spending, increased taxes, or both