Year 12 WACE Economics Unit 3 Flashcards 2025
1/74
There's no tags or description
Looks like no tags are added yet.
Name | Mastery | Learn | Test | Matching | Spaced |
|---|
No study sessions yet.
75 Terms
Australia’s Linkages Between Economies, Including Trade, Investment, Tourism & Immigration:
Trade:
Economic Integration: Increasing linkages between economies, occurring when trade barriers (tariffs, subsidies & quotas) are reduced or removed between countries facilitating growth in free international trade & flows of investment.
Trade:
→ In 2024 Australia imported $444b worth of goods (e.g., cars) & $143b (e.g., tourism) worth of services, while exporting $536b worth of goods (e.g., iron ore) & $143b worth of services (e.g., education).
→ Trade is a stimulus to economic growth expanding Australia’s economy & the global economy alike.
→ Trade creates jobs, raises household incomes, encourages businesses to become more innovative & productive creating wealth & increasing living standards.
→ Around 25% of Australian workers are directly involved in trade-related activities.
→ Trade provides consumers a greater choice of products at more competitive prices.
Free Trade Agreements: An international treaty between two (bilateral FTA) or more (multilateral or regional FTAs) economies that reduces or eliminates certain (e.g., tariffs, subsides & quotas) barriers to trade in goods & services as well as investment.
Examples in the Indo-Pacific Region which facilitate freer trade between Australia & the rest of the world (removing trade barriers like tariffs & subsidies) include:
→ ECTA (Australia-India Economic Cooperation & Trade Agreement)
→ RCEP (Regional Comprehensive Economic Partnership)
→ ChAFTA (China-Australia)
The Indo-Pacific Region: The vast area encompassing the Indian & Pacific Oceans & countries bordering these oceans. It’s a geopolitical concept highlighting the economic, political, & strategic interconnectedness among the major nations in this area.
→ The region has over 4.5b people & accounts for over 60% of Gross World Product (market value of all goods & services produced in the world).
→ Australia’s trade focuses on this region due to geographical proximity
Reduces transport costs
→ Australia’s trade focuses on this region due to economic opportunity
Many of the economies in this area are developing & in need of investment & resources.
→ Australia has a comparative advantage (producing at a lower opportunity cost) in supplying (exporting) commodities to these developed & developing economies.
E.g., Australia supplies commodities (raw mining and agricultural resources) such as iron ore, coal, natural gas, wheat & beef.
→ Australia has a comparative disadvantage (producing at a higher opportunity cost) in manufacturing due to high labour costs in domestic manufacturing.
Therefore, Australia imports manufactured good supplied by countries in the Indo-Pacific region
E.g., These manufactured good include PMVs, computers & smartphones & capital machinery.
Australia’s Linkages Between Economies, Including Trade, Investment, Tourism & Immigration:
Foreign Investment:
Foreign Investment:
→ Australia has a deficit of domestic savings (domestic investment demand > savings) to fund domestic investment creating a savings-investment gap.
Due to Australia’s small savings pool due to its small population & high number of investment projects especially in the mining sector.
Australia’s economy relies on foreign investment inflows supplementing domestic savings & helping fund economic development & growth.
→ Foreign investment inflows are financial assets in Australia owned by foreigners & financial transactions in the balance of payments that increase or decrease stock.
→ Inflow of foreign investment comes in two forms, foreign equity (foreign investment into Australia) & foreign debt (borrowing money from overseas).
In 2024 foreign investment inflows into Australia totalled $245 billion.
E.g., Gorgon LNG plant North-Western Australia (natural gas project) cost US$54billion to complete, Australia doesn’t have the domestic savings to finance this therefore the majority of the money was foreign investment.
→ There are two types of foreign investment:
Foreign Direct Investment: Occurs when a foreign resident/firm establishes a controlling share of at least 10% in an Australin firm or asset.
Foreign residents/firms expect & receive dividends (share of the profits proportionate to the investment provided) as remuneration.
e.g., Australian firm Hancock Prospecting purchased 67% of S Kidman & Co Cattle Station & Chinese firm Shanghai CRED purchased the remaining share of 33%.Foreign Portfolio Investment: A foreign resident/firm lends money to or acquires a share less than 10% in an Australian firm or asset
e.g., A North American investment firm acquiring 1.5% of Qantas Airways Ltd.
→ Australia’s major sources of foreign investment include the United States, United Kingdom & Japan.
In recent years China has become an increasing important source of foreign investment but only accounts for >2% of total foreign investment.
→ Nearly 38% of all FDI into Australia is invested into the mining sector followed by real estate activities at 14%.
Costs & Benefits of Foreign Investment in Australia:
Benefits: | Costs: |
|
|
Australia’s Linkages Between Economies, Including Trade, Investment, Tourism & Immigration:
Immigration:
→ The Indo Pacific region has become an increasingly important source of migrants to Australia.
Migrants arrive as means of filling Australia’s skill & labour shortages & for humanitarian reasons.
Skilled migration has been boosted through international students remaining in Australia following completing their studies
Over 30% of people living in Australia are born overseas with England, India & China being the top three sources of migrants
→ The movement of labour between economies is concentrated in the ‘top end’ of the labour market where highly skilled workers are attracted towards the richest economies (i.e., United Stated & Untied Kingdom) due to higher pay & opportunities.
Smaller advanced economies (i.e., Australia & New Zealand) suffer from a ‘brain drain’ whereby their most skilled workers are attracted to other countries.
5% of Australian citizens live overseas with 40% of them living in the U.K
→ In the year ending June 2023 over migration contributed to a net gain of 518,000 to Australia’s population – the largest net overseas migration estimates on record.
This can be attributed to two main factors:
Boarders reopening after the Covid Pandemic
The relaxation of immigration laws by the Australian government addressing and assisting in labour shortages (Australian unemployment is 4% just within the target range of 4-4.5%).
Australia’s Linkages Between Economies, Including Trade, Investment, Tourism & Immigration:
Tourism:
→ Tourism has grown due to improvements in transport & communications & is Australia’s sixth largest export & its largest import
In 2024 8 million tourists visited Australia (import) whilst 11.3 million Australians travelled overseas (export).
→ Australia’s goal is build Australia’s market share of targeted travellers through increasing demand.
→ Tourism influences people to travel to & within Australia maximising tourist spending & visitation delivering economic benefits of increased economic growth.
→ Total spending by international tourists in Australia during 2023 was $40,792 million accounting for 36.2% of total services imports
The Composition & Direction of Australia’s Trade:
The Composition of Australia’s Trade:
The Composition of Australia’s Exports:
Australia’s export landscape is characterised by its significant dominance of the mining sector with minerals & energy exports accounting for the majority of exports.
→ Key exports include iron ore, coal & natural gas which are abundant in Australia a comparative advantage in producing primary goods.
→ Beyond mining Australia diversifies its exports by shipping agricultural goods like wheat, wool & beef diversifying its approach to international trade.
Diversification ensures Australia remains unaffected by demand changes & supply issues.
→ Australia’s exports compositions has changed overtime with a dramatic decline in rural exports & a significant increase in the mining sector as a result of China’s rapid growth from 2000 onwards.
→ China’s dramatic growth can be attributed to its establishment as a dominant industrial sector leading to its growing need for ion ore, coal & natural gas.
Australia has a comparative advantage in these goods therefore becoming a significant supplier of these resources’ contribution to a resource boom in Australia lasting for over 20 years.
The Composition of Australia’s Imports:
Australia’s imports are skewed towards manufactures goods such as PMVs, refined petroleum, computer equipment & machinery which Australia is at a comparative disadvantage in producing.
→ While Australia excels in primary production due to abundance of natural resources it relies on imports to meet its demand for manufactured goods.
→ Australia’s trade composition makes their “medium open sized economy”, strategically leveraging its strengths in primary production while addressing its limitations in manufacturing through international trade agreements.
The Composition & Direction of Australia’s Trade:
The Direction of Australia’s Trade (who Australia trades with):
Australia’s economic ties are deeply rooted in the Indo-pacific Region constituting 75% of the nation’s total goods & services trade.
→ Countries within close proximity to Australia are manufacturing hubs of Asia depending heavily on Australia’s mining exports, solidifying the importance of resource driven trade partnerships.
→ China holds the position of Australia’s largest import source supplying clothing, white goods & technology, maintaining their title as the world’s most efficient manufacturer.
The Composition of Australia’s trade: | The Direction of Australia’s trade |
|
|
The Composition & Direction of Australia’s Trade:
Reasons for Australia’s Direction in Trade Towards the Indo-Pacific Region:
Reasons for Australia’s Direction in Trade Towards the Indo-Pacific Region:
Geographical Proximity:
Australia can trade with these nations with low transportation costs compared to area outside this region making trade more profitable.
Limited Supply of Raw Resources Relative to Population:
Australia’s comparative advantages & disadvantages compliment the advantages & disadvantages of the Indo-Pacific
Australia’s low population in comparison to its endowment of resources compliments the Indo-Pacific’s limited supply of natural resources compared to its relatively large population.
Growing Market:
Many countries in the Indo-Pacific region are still developing at fast rates with strong economic growth (e.g., China) growing potential markets for Australian exports.
E.g., “Tiger Economies” Such as India & Vietnam
Increased Trade Liberalisation:
An increase in FTA’s (preferential trade agreements) with many countries in this region allows for increased exports & imports.
E.g., 14/18 FTAs Australia has enforced are with the Indo Pacific region
The Composition & Direction of Australia’s Trade:
Trade Composition & Direction Statistics Exports:
Australia’s Top Two-Way Trading Partners (2022-2023)
1. China (25.7%)
2. Japan
3. United States
Australia’s Top Export Markets (2023-2024):
1. China (32%)
2. Japan
3. South Korea
Australia’s Changing Exports (1990-2024):
Rural exports (agriculture: wheat) have decreased
Resource exports have increased doubling in size
Manufactures have halved in this time
Commodities, exports have rapidly increased
Australia’s Top Export Products (2023-2024):
1. Iron Ore (21%)
2. Coal
3. Natural Gas
The Composition & Direction of Australia’s Trade:
Trade Composition & Direction Statistics Imports:
Australia’s Top Import Sources (2023-2024):
1. China (20%)
2. European Union
3. United States
Australia’s Top Import Products (2023-2024):
1. Personal Travel (10.5%)
2. Refined Petroleum
3. Passenger Motor Vehicles
Extent & Importance of Trade for the Australian Economy:
Factors of Trade:
Trade accounts for 48% of GDP & can be summaries into four main factors:
1. Increases Economic Growth:
Trade (exports & Imports) drives economic growth in Australia as it results in increased production of goods & services.
E.g., by 2023, total trade had increased to nearly 50% of Australia’s GDP.
2. Increased Real Incomes for Australian Households:
By engaging in international trade Australia gains access to wider markets for its goods & services leading to increased exports.
In return generating revenue that flows back into the economy (multiplier effect) contributing to higher incomes & wages.
3. Increased Employment Opportunities:
Trade posters job creation & economic growth.
As businesses expand their markets through international trade, they often need to increase production leading to increased demand for Australian workers therefore decreasing Australia’s unemployment rate which sits at 4.0%.
4. Increased Living Standards for Consumers:
Trade contributes to a wider variety of goods & services at competitive prices due to increased connection.
It allows households to consume goods & services that are either not produced in Australia or are too costly to produce, enhancing Australia’s living standards.
Extent & Importance of Trade for the Australian Economy:
World Trade Organisation:
Key Principles of the WTO:
→ Non-discriminations: Countries can’t discriminate between trading partners or between its own & foreign products or services.
→ Most Favoured Nations (MFN): The idea that countries should trat their partners equally.
E.g., if a country lowers tariffs for one country it should do the same for all other countries.
→ Opening Trade: Lowering trade barriers to encourage trade, including tariffs import bans & quotas.
→ Fair Competition: discouraging unfair practices such as export subsidies & dumping products at below normal cost to gain market share.
→ Protection of the Environment: The WTO permit members to take measures protecting public, animal & plant health & also the environment, however members can’t use environmental protection measures as a means of introducing discriminatory trade barriers.
Australia’s Trade Policy, including Regional & Bilateral Free Trade Agreements:
Australia’s Trade Policy:
→ Australia’s trade policy is characterised by a commitment to open markets, free trade & economic liberalisation.
→ Australia pursues bilateral & multilateral trade agreements to enhance its economic engagement with global partners.
→ Bilateral trade agreement: Only two countries are signatories.
Australia – New Zealand: ANXCERTA
Singapore – Australia: SAFTA
Australia – Chile: ACI-FTA
→ Multilateral trade agreement: With three or more signatory countries.
Comprehensive & Progressive Agreement Trans-Pacific Partnership (CPTPP)
Pacific Agreement on Closer Economic Relations (PACER Plus)
Regional Comprehensive Economic Partnership Agreement (RCEP)
→ Australia has 18 FTAs (14 bilateral & 4 multilateral)
Australia places a strong emphasis on its region ties (14/18 FTAs are Indo-Pacific).
Australia seeks to diversify its export markets (particularly after trade wars with China e.g., UK FTA)
Australia’s Trade Policy, including Regional & Bilateral Free Trade Agreements:
ChAFTA (China-Australia Free Trade Agreement):
→ China is Australia’s largest trading partner, in 2020 China bought $102 billion of Australian exports, more than a quarter of Australia’s total exports.
→ ChaFTA entered into force on 20/12/15
→ Key Outcomes:
Eliminated tariffs on Australia’s major exports: Iron ore, coal, crude oil or liquid natural gas increasing international competitiveness.
Reduced tariffs up to 10% on pharmaceutical goods: In action from 01/01/2019
Elimination of all tariffs on: Car parts, engines & plastic products from 01/01/2019
→ ChaFTA eliminated all remaining tariffs on Australian barley & sorghum 20/12/2015
This will see a rapid tariff reduction on other agriculture exports (i.e., seafood, sheep, meat & horticulture)
Australia’s Trade Policy, including Regional & Bilateral Free Trade Agreements:
Multilateral FTA: RCEP:
Regional, Comprehensive, Economic Partnership Agreement:
→ Signatory Date: 15/11/20
→ Date it came into Effect: 01/01/2022
→ Number of Countries: 15
→ Names of Countries: Australia, Brunei, Cambodia, China, Japan, Laos, New Zealand, Singapore, Thailand, Vietnam, Republic of Korea, Malaysia, Indonesia & the Philippians.
Key Outcomes of the Agreement:
→ Largest Trade Bloc
Covers 30% of global GDP (~$26 trillion).
Encompasses 30% of the world’s population (~2.3 billion people).
→ Tariff Reductions & Market Access
Eliminates 91% of tariffs over 20 years.
Simplifies rules of origin, making it easier for businesses to qualify for tariff reductions.
→ Trade & Investment Growth
Expected to add $186 billion annually to the global economy.
Projected to increase intra-regional trade by 42%.
→ Supply Chain Integration
Creates a unified set of trade rules across member countries.
Facilitates cross-border investment by standardizing regulations.
→ Services & Digital Trade
Liberalizes 65% of services sectors (e.g., finance, telecommunications, and e-commerce).
Strengthens intellectual property protections and data flow regulations.
→ Inclusion of Major Economies
Comprises 15 Asia-Pacific countries, including China, Japan, South Korea, ASEAN nations, Australia, and New Zealand.
First trade agreement to include China, Japan, and South Korea together.
→ Boost to SMEs (Small & Medium Enterprises)
Simplifies trade procedures, making it easier for SMEs to export.
Reduces bureaucratic red tape and administrative costs.
→ Geopolitical & Economic Stability
Strengthens economic ties among Asia-Pacific countries.
Provides a counterbalance to other major trade agreements like CPTPP and EU trade deals.
Australia’s Trade Policy, including Regional & Bilateral Free Trade Agreements:
Effects of Free Trade Agreements:
Positive Effect: Trade Creation
→ When FTA creation leads to the replacement of high cost domestic production to low cost imports from signatory members of the FTA
→ The removal of trade barriers through FTAs helps to increase the volume of trade between specific countries,
E.g., the A-U.K FTA came into force in 2023 removing tariffs on 99% of exports to the UK increasing trade opportunities.
Negative Effect: Trade Diversion
→ When FTA formation leads to the replacement of low-cost imports from non-members to high cost imports from members to the FTA
→ With tariffs, countries import form the most efficient producers due to lower costs, a trade deal with a less efficient nation shifts imports to a higher-cost supplier, causing trade diversion.
E.g., the European union trade block removed tariffs on goods & services with the 27 countries of the EU but applies tariffs on goods & services imported from countries outside the bloc.
Australia’s Trade Policy, including Regional & Bilateral Free Trade Agreements:
Concept of International Competitiveness & its Determinants:
International competitiveness is the ability of a country to compete successfully against other countries in international trade, it is important as it can improve a country's economic growth increasing exports & production.
1. Changes in Inflation Relative to Trading Partners:
An increase in Australia’s international competitiveness will occur if Australia’s inflation rate is relatively low compared to its trade competitors as its comparatively cheaper for overseas markets to purchase Aus’ exports.
2. Changes in Australia’s Wages Relative to Trading Partners:
Lower wages in Australia boost competitiveness by reducing production costs, making exports cheaper.
3. Changes in Exchange Rates Relative to Trading Partners:
A weaker Australian dollar makes exports cheaper to our partners to purchase, boosting competitiveness.
4. Changes in Labour Productivity due to Training & Technology:
Higher productivity & increased efficiency lowers export costs through better training, technology, & investment.
5. Trade Liberalisation:
Increase in a countries trade liberalisation (through FTAs) reduces/eliminates the cost of tariffs & subsidies improving economic efficiency, reducing exports & import costs.
Australia’s Trade Policy, including Regional & Bilateral Free Trade Agreements:
Australia’s Trade Intensity: (How much trade contributes to a countries economy):
Australia’s trade intensity increased significantly over the last few decades from 34% in 1992 to 48% in 2023 reflecting its increasingly open economy but is still comparatively low compared to other developed countries.
To measure international trade, calculate the share of trade in GDP (trade openness/intensity ratio).
→ Trade Intensity = (exports + imports) / GDP x 100
Factors determining a country’s trade intensity are:
→ Relative Economy Size: Large nominal GDP reduces trade instability by lowering a country’s reliance on trade as they produce so many goods/services themselves.
E.g., Japan, China, & the USA have low trade intensities due to their large economies
→ Country Location Relative to Foreign Markets: While most people & economic activity in the Northern Hemisphere, Australia’s exports are impressive despite it suffering from the “tyranny of distance”. If it were in Europe, its global ranking would be higher.
→ Extent of Trade Barriers: Tariffs, trading blocs (e.g. the EU) and high transport costs will all reduce a nation’s trade intensity
The Concepts of an Absolute & Comparative Advantage, including the Sources of Comparative Advantage:
The Concepts of an Absolute Advantage:
The Concepts of an Absolute Advantage:
A country has an absolute advantage in the production of a good or service if it can produce a greater quantity of that good.
The Concepts of an Absolute & Comparative Advantage, including the Sources of Comparative Advantage:
The Concepts of a Comparative Advantage:
The Concepts of a Comparative Advantage:
→ A country can produce a good or service at a lower opportunity cost than another country.
→ A country will specialise in the production of the product with the lowest opportunity cost (value of the best alternative given up).
Opportunity cost = Total Production of Good B / Total Production of Good A
The good you are calculating for will always be the denominator
Sources (Reasons) of Comparative Advantage:
→ Endowment of Natural Resources: Australia has a large supply of farming land & endowment of minerals creating a comparative advantage in agriculture & mining.
E.g., Australia is primarily an exporter of primary products & an importer of, manufactured goods, Australia has specialised in the production of primary goods (because of the comparative advantage).
→ Differences in Technology: Technology is the application of knowledge & technical skills to the development of new products & production processes.
By investing in research & development countries add stock to knowledge & improve the productivity both labour & capital gaining a critical cost advantage over other nations (decreased costs of production).
→ Differences in Labour & Capital Resources: Countries may specialise in producing goods & services based on skills in labour & or quantity of labour.
Other countries have a comparative advantage in producing innovative products using high quality capital equipment.
Trade encourages business enterprises to seek out new markets for their products & establish a reputation for their quality.
Australia also has a good reputation for telecommunications equipment, the production of wine & beer, & education
The Gains from Specialisation & Trade using the Production Possibilities Frontier & Opportunity Cost:
Using Output Data to Draw a PPF:
Using Output Data to Draw a PPF:
Unit of Goods that can be Produced:
1. Draw in the axis
2. Label each one as either of the goods that are being produced
3. Draw points on each of the axis representing the units of goods that can be produced by each country.
4. Connect the two points for each good with a straight line.
Before Specialisation:
→ Before specialisation & isolation they do not trade with one another Australia wishes to produce at 6 units of wool & 2 units of shoes.
→ While Bangladesh wishes to produce 2 units of wool & 6 units of shoes.
Therefore, the total global production of wool is 8 units & total global production of shoes is 8 units.
After Specialisation:
→ After specialisation a country puts all of its resources into the production of the good or service, they have a comparative advantage in as it’s the most efficient use of their resources.
→ If both countries specialise in producing goods they have a comparative advantage in global production increases.
→ Australia will specialise in producing wool & Bangladesh will specialise in producing shoes.
Therefore, total global production of wool is 10 units & total global production of shoes is 10 units – a net increase of 2 units per output for the world.
Terms of Trade:
→ After countries specialise, their markets still demand the good they chose not to produce therefore countries will trade one another to satisfy the demand of their domestic markets.
→ The terms of trade represents the rate at which different commodities exchange for each other between countries
→ The terms of trade will always lie between the opportunity cost ratios of the goods being traded.
→ “a suitable terms of trade for 1 unit of _____ trades for ___ units of ____ & 1 unit of ___ trades for ___ of _____”
The Gains from Specialisation & Trade using the Production Possibilities Frontier & Opportunity Cost:
The Consumption Possibility Frontier:
1. Draw the PPF for each good.
2. Calculate the opportunity cost for each country to produce each good & identify the good each country has a comparative advantage in
3. Determine a suitable terms of trade
4. Each country will only produce the good they have a comparative advantage in & they will export based on this, to determine the CPF:
→ For the good the country has a comparative advantage in the axis intercept does not change. The CPF will point upwards from this point.
→ Determine the quantity of the good a country can receive in return by multiplying the quantity of the goof the country is producing with the terms of trade.
→ The CPF sits outside the PPF demonstrating gains from trade as when the country specialises in & trades it allows the country to consume outside its PPF.
Gains from Specialisation & Trade:
→ The CPF demonstrates the gains from specialising in the production of one good & exporting all of that good
→ There are two gains from specialisation & trade:
World Output (total common) Increases: Before specialisation to total output on __ was , after specialisation & trade it increases to .
Amount of Output available per country increases by One Additional Unit: Before specialisation ___ only had units of available but after specialisation & trade it now has units of _ available.
→ Trading economies like Australia benefit from specialization & trade if each country has a comparative advantage, even when one has an absolute advantage in both products.
The Gains from Specialisation & Trade using the Production Possibilities Frontier & Opportunity Cost:
Using Import Data (amount of resources needed to produce a good)
→ Calculating comparative advantage using input data (e.g., how many hours it takes to produce one unit of output)
→ A country has an absolute advantage when it has the lowest amounts of inputs.
→ To calculate the opportunity cost (determine the comparative advantage) you must convert inputs into outputs:
Assume each country has 30 (or the lowest common multiple) available input hours
The Gains from Specialisation & Trade using the Production Possibilities Frontier & Opportunity Cost:
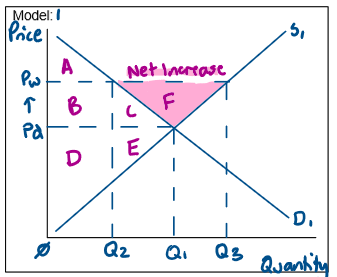
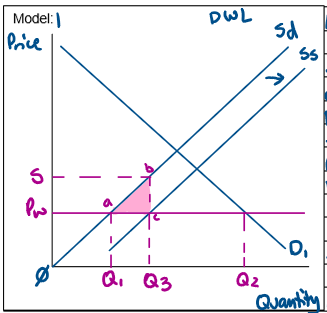
Gains from Specialisation & Trade using Demand & Supply Gains from Exports:
Exports (e.g., coal, iron ore, education) are the sale of domestically produced goods & services to overseas markets.
→ Producers in exporting countries receive higher prices & sell more goods, gaining from exporting becoming winners as producer surplus increases.
→ Consumers in the exporting country pay more & receive less – consumers lose out & consumer surplus decreases.
→ Since the gai in producer surplus is larger than the loss in consumer surplus total surplus increases.
DIAGRAM
→ Exports are the sale of domestically produced goods & services to overseas markets
E.g., iron ore & coal.
→ As seen in model _ before trade equilibrium price is Pd (price domestic).
→ Equilibrium quantity is Q1.
→ Domestic consumption & production is Q1.
→ Through trade domestic producers access higher prices for their products & price increases form Pd to Pw (price world).
→ Domestic production increases form Q1 to Q2.
→ There is now a surplus which is cleared by exporting overseas Q3-Q2.
→ Producer surplus increases from DE to BCDEF & consumer surplus decreases from ABC to A.
→ The net gain in total surplus is F increasing total surplus from ABCDE to ABCDEF.
→ Since the gain in producer surplus is grater than the loss in consumer surplus the __ economy gains & economic welfare increases.
The Gains from Specialisation & Trade using the Production Possibilities Frontier & Opportunity Cost:
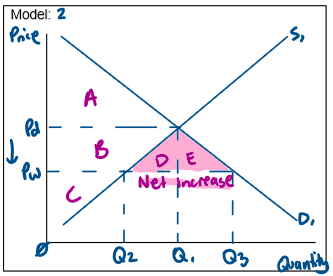
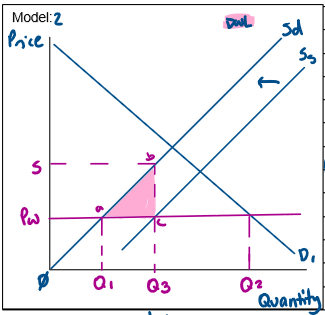
Gains from Specialisation & Trade using Demand & Supply Gains from Imports:
Imports (e.g., pmvs, tech) are the purchase of foreign goods & services produced overseas.
→ When a country allows trade & becomes an importer of a good, domestic consumers gain.
→ Consumers pay a lower price & consume more therefore becoming winners & consumer surplus increases.
→ Domestic producers receive a lower price & produce less becoming losers as producer surplus decreases.
→ Since the gain in consumer surplus is larger than the loss in producer surplus, total surplus increases.
DIAGRAM
→ Imports refers to the purchase of foreign goods & services produced overseas
E.g., pmvs
→ As seen in model __ before trade equilibrium price is Pd (price domestic) & equilibrium quantity is Q1.
→ Domestic production & consumption is Q1.
→ Through trade consumers can access a wider variety of products at cheaper prices
→ Prices decrease form Pd to Pw (price world).
→ Domestic consumption increases from Q1 to Q3.
→ Domestic production decreases from Q1 to Q2 resulting in a shortage which is cleared through importing from overseas (Q3-Q2).
→ Producer surplus decreases from BC to C & consumer surplus increases from A to ABCDE.
→ The net gain in total surplus is DE increasing total surplus from ABC to ABCDE/
→ Since the gain in consumer surplus is greater than the loss in producer surplus the ___ economy gains & economic welfare increases.
The Benefits of Trade Liberalisation:
Definition of Trade Liberalisation:
Trade liberalisation is the reduction of trade barriers in the movement of goods & services across international borders achieved through diplomacy & the establishment of FTAs.
The Benefits of Trade Liberalisation:
Economic Growth & Living Standards:
→ Reducing trade barriers leads to increased importing & exporting
Increased exports increase the output of domestic industries & production levels will increase.
Consequently GDP & economic growth increases, therefore employment levels &incomes rise (multiplier effect) benefits the Australian economy.
→ Increased imports through trade liberalisation increases access to a wider range of quality goods & services at lower prices.
Increased imports & exports improve domestic living standards.
Living standards rise as a result of exporting from increased employment & incomes
Living standards also rise through importing as consumer access low-cost, high-quality goods & services which may not be available to be sourced domestically.
→ 1/5 Australian workers (2.2 million people) are involved in trade related activities, a direct injection to the Australian economy (increased employment, increased income, increased growth & living standards.
E.g.., trade liberalisation has caused Australia’s real GDP to be 5.4% higher than is would otherwise have been without trade liberalisation.
The Benefits of Trade Liberalisation:
Specialisation & Comparative Advantage:
→ Trade encourages countries to specialise in the production of a good they are more efficient at producing (have a comparative advantage in).
This leads to a more efficient allocation of the world’s resources.
→ As a result of specialisation & efficiency productivity levels increase
Specialisation boosts efficiency and productivity, increasing global output.
→ E.g., Australia has a comparative advantage & specialises in the production of iron ore, coal & education (commodities) & then imports goods which they do not have a comparative advantage in such as PMVs & refined petroleum (manufactured goods).
The Benefits of Trade Liberalisation:
Increased World Output & Efficiency:
→ Increased output occurs through trade liberalisation due to increased exports supplying to the world market.
→ Opening trade means exporters are competing against other countries with the same exports.
→ Competition drives efficiency, cutting costs, improving quality, & increasing output.
Increased output & efficiency is a benefit as resources are not wasted with consumers benefiting from low-cost, high-quality goods.
→ Due to increased world output countries move to a new consumption point outside their PPF which would be unattainable without trade
→ E.g., ChAFTA decreases Chinese tariffs on Australian agricultural products such as meat, dairy & wine, this trade liberalisation increases Australian products competitiveness increasing the production & output in these industries.
The Benefits of Trade Liberalisation:
Access to a Wider Variety of Goods & Services:
→ Trade allows countries to obtain goods & services they cannot produce themselves or in insufficient quantities at a lower price to satisfy domestic demand.
→ Limited appropriate resources result in the need for imports.
E.g., a country may lack the appropriate technology to produce specific manufactured goods, other countries may lack land to produce grains & import it from Australia where we have large amounts of land.
E.g., Australia accesses a range of goods such as PMVs which are not produced domestically, as a result of a decrease in the average rate of tariffs from 7.3% in 1986 to >1% in 2016 annual merchandise imports increased from $40billion to $265 billion
Types of Protection, including Tariffs, Subsidies & Quotas:
Types of Protection; Tariffs: INTRODUCTION OF A TARIFF
Tariff: A government-imposed tax on imports.
→ In Australia tariffs are often applied to imported PMVs, clothing & footwear.
→ It raises the price of imported goods making domestic producers more competitive
Resulting in a decrease in total surplus & therefore DWL.
Diagram answer formula:
• Definition & example of a tariff:
• Effect on Price:
• Effect on Domestic Consumption:
• Effect on Imports:
• Effect on Domestic Production:
• Effect on Domestic Producer Revenue:
• Effect on Foreign Producer Revenue:
• Effect on Producer Surplus:
• Effect on Consumer Surplus:
• Effect on Deadweight Loss:
• Effect on Total Surplus:
• Effect on Government Revenue:
• Effect on Market Efficiency:
• Cost Push inflation
• Domestic Output/Employment
• Employment/Production
• COP (Domestic Producers)
• Domestic Output/employment
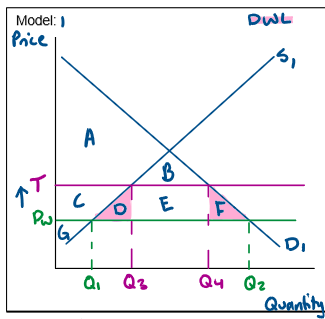
Impacts of a Tariffs Introduction Using the Demand & Supply Model on Trade, Market Efficiency & the Macroeconomy
DIAGRAM
→ Definition of a tariff.
→ Example of a tariff: e.g., during the 1990s tariffs on clothing apparel imported into Australia peaked at 176%.
→ In model _ The implementation of a tariff causes an increase in price from Pw to T.
Moving consumption away from imports to domestic goods causing imports to decrease from Q1Q2 to Q3Q4.
→ Due to higher price domestic consumption decreases from Q2 to Q4, domestic production increases from Q1 to Q3.
→ Domestic producer revenue increases from Pw x Q1 to T x Q3.
→ Foreign producer revenue decreases from Pw(Q1-Q2) to Pw(Q4-Q3).
→ Producer surplus increases from G to CG as they receive a higher price & sell a higher quantity.
→ Consumer surplus will decrease form ABCDEF to AB as they pay a higher price & consume a lower quantity.
Resulting in a net welfare loss to the economy creating deadweight loss of DF.
Consequently, total surplus decreases from ABCDEFG to ABCG meaning the market is inefficient & economic welfare decreases.
→ Government revenue from tariffs is E.
→ Producers who use imported goods as inputs will suffer as tariffs increase their costs of production leading to cost push inflation.
→ Domestic output & employment in non-protected industries will decrease due to higher costs & resources being directed away from these industries to the protected industries.
→ In contrast, as domestic producers increase their production this will result in an increase in employment in these industries.
Types of Protection, including Tariffs, Subsidies & Quotas:
Types of Protection; Tariffs: REMOVAL OF A TARIFF
Tariff: A government-imposed tax on imports.
→ In Australia tariffs are often applied to imported PMVs, clothing & footwear.
→ It raises the price of imported goods making domestic producers more competitive
Resulting in a decrease in total surplus & therefore DWL.
Diagram answer formula:
• Definition & example of a tariff:
• Effect on Price:
• Effect on Domestic Consumption:
• Effect on Imports:
• Effect on Domestic Production:
• Effect on Domestic Producer Revenue:
• Effect on Foreign Producer Revenue:
• Effect on Producer Surplus:
• Effect on Consumer Surplus:
• Effect on Deadweight Loss:
• Effect on Total Surplus:
• Effect on Government Revenue:
• Effect on Market Efficiency:
• Cost Push inflation
• Domestic Output/Employment
• Employment/Production
• COP (Domestic Producers)
• Domestic Output/employment
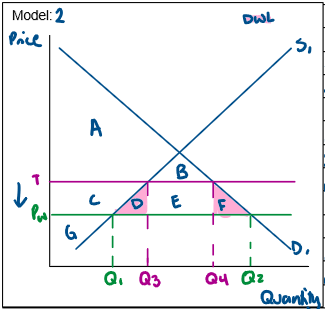
DIAGRAM
Impacts of a Tariffs Removal Using the Demand & Supply Model on Trade, Market Efficiency & the Macroeconomy:
→ Definition of a tariff.
→ Example of a tariff: e.g., during the 1990s tariffs on clothing apparel imported into Australia peaked at 176%.
→ In Model _ the removal of a tariff causes a decrease in price from T to Pw.
→ Switching consumption away from domestic goods to imports, causing imports to increase from Q3Q4 to Q1Q2.
Due to the lower price, consumption increases from Q4 to Q2.
→ Domestic production decreases from Q3 to Q1 & domestic producer revenue decreased from T x Q3 to Pw x Q1.
→ Foreign producer revenue increases from Pw (Q4-Q3) to Pw (Q1 – Q2).
→ Producer surplus decreases form GC to G as they receive a lower price & sell a lower quantity.
→ Consumer surplus will increase from AB to ABCDEF as they pay a lower price & consume a larger quantity.
Resulting in a net welfare gain to the economy eliminating deadweight loss of DF.
Consequently, there is an increase in surplus from ABCG to ABCEDEFG meaning the market is efficient & economic welfare increases.
→ Government revenue from the tariff E, is eliminated.
→ Producers who use the imported goods as inputs will benefit as the removal of the tariff decreases their cost of production.
→ Domestic output & employment will increase as resources are allocated to the most efficient industries resulting in an increase in production.
Types of Protection, including Tariffs, Subsidies & Quotas:
Types of Protection; Subsidies: INTRODUCTION OF A SUBSIDY:
Subsidy: Cash payments from governments to business to encourage the production of goods & services.
Financial assistance to domestic producers enabling them to reduce their selling price & compete with imported goods
E.g., In Australia the Automotive Transformation Scheme provided $1billion (between 2016-2020) to car manufacturers who designed & produced cars in Australia.
DIAGRAM
Introduction of a Subsidy:
→ Example of a subsidy: e.g., the Austomotive Transformation scheme for Australian car producers like holden & ford.
→ The implementation of a subsidy to domestic producers shifts the supply curve to the right from Sd to SS as they receive payment from the government & their cost of production decreases.
→ As a result, price remains the same at Pw
→ Domestic consumption remains unchanged at Q2 & imports decrease from Q1Q2 to Q3Q2.
→ Domestic producer increases from Q1 to S X Q3.
→ Foreign producer revenue decreases from Pw (Q2 – Q1) to Pw (Q2 – Q3).
→ Government expenditure on the subsidy is SbcPw & producer surplus increases from Pwaø to Sbø.
Therefore, the increase in producer surplus is less than the size of the subsidy creating DWL at abc – as there is DWL present – the market is inefficient & economic welfare decreases.
→ Subsidies result in resource distortion as resources are diverted towards protected industries.
creating a high opportunity cost as it may not be the most efficient use of those resources.
→ As domestic producers increase production this will result in an increase in employment in these industries.
Types of Protection, including Tariffs, Subsidies & Quotas:
Types of Protection; Subsidies: REMOVAL OF A SUBSIDY:
Subsidy: Cash payments from governments to business to encourage the production of goods & services.
Financial assistance to domestic producers enabling them to reduce their selling price & compete with imported goods
E.g., In Australia the Automotive Transformation Scheme provided $1billion (between 2016-2020) to car manufacturers who designed & produced cars in Australia.
DIAGRAM
→ Example of a subsidy: e.g., the Austomotive Transformation scheme for Australian car producers like holden & ford.
→ The removal of a subsidy to domestic producers will shift the supply curve to the left from Ss to Sd as they no longer receive the payment from the government & COP increases.
→ Consequently domestic consumption remains unchanged at Q2 & imports increase from Q3Q2 to Q1Q2.
→ Domestic production decreases form Q3 to Q1 & domestic producer revenue increases from Pw (Q2 – Q3) to Pw ( Q2 – Q1).
→ Government expenditure on the subsidy of sbcpw is eliminated & producer surplus decreases from sbø to Pwaø eliminating DWL present at abc.
Therefore, the market is efficient & economic welfare increases.
→ The removal of a subsidy results in the efficient allocation of resources as they are allocated to the most efficient industries.
→ Short term removal of a subsidy will result in structural unemployment as businesses seek to compete with the global market.
→ In the long term these workers will retrain & enter into their efficient industries promoting economic growth.
Types of Protection, including Tariffs, Subsidies & Quotas:
Types of Protection, Including Quotas: Description of Quotas
Quotas: A quota is a limit on the quantity of a particular good that can be imported into a country.
→ It provides certainty to domestic producers as to the exact quantity of imports they must compete against.
E.g., In Australia, most fresh fruits (planning prior to growing) from trading partners have import quotas to protect local producers.
→ Quotas can be country-specific or global in scope.
A larger quota allows for a larger quantity of imports therefore protects domestic industries less.
→ Quotas result in higher prices for both domestic & imported goods consequently consumer surplus decreases, producer surplus increases & DWL is created as total surplus is not maximised (economic welfare decreases).
Other Types of Quotas:
→ Embargo Quotas: The total ban on an imported product meaning consumers can only buy locally produced goods.
→ Local Contents Rule: The number or percentage of the components of a product that are manufactured in a specific country.
Types of Protection, including Tariffs, Subsidies & Quotas:
Types of Protection, Including Quotas: ARGUEMENTS FOR QUOTAS
Protectionism: A government action aimed at giving domestic industry some artificial advantage over a competing foreign industry.
→ Forms include tariffs, quotas & subsidies.
→ Protection aims to increase domestic production in the protected industries & decrease the consumption of imported goods & services.
Argument 1 – Prevention of Dumping:
Some Validity as it is prohibited by the WTO but hard to prove
→ Dumping: When a company exports a product at a price lower than the price it normally charges on its own home market.
→ Can occur when countries with excess supply sell their goods in another country below cost, forcing local firms out of business if done for prolonged time.
→ Can occur if a firm/domestic market is large enough to sustain short term losses by selling their products below cost forcing other, smaller, foreign producers out of the market.
→ Some countries apply short-term protection measures to prevent/deter dumping & protect industries against foreign firms selling below cost.
→ Counter: It is very hard to prove as foreign goods may be lower prices due to specialisation & production efficiencies, there is also little access to production data by the public.
→ E.g., China – Australia trade dispute: China accused Australia of dumping barley & wine, they used this argument to increase tariffs by 80% on Australian agricultural exports.
Argument 2 – Infant Industries Argument:
Some validity for short-term protection until infant industry matures.
→ Infant Industries: Newly established industries will be protected until they are mature, efficient & can take advantage of economies of scale.
→ Overtime industries become internationally competitive developing a comparative advantage.
→ Counter: The industry can become dependent on protection (i.e., subsidies) due to little connection & no incentive to innovate increase efficiencies even as they mature.
→ Overall, this argument is justifiable but must be implemented correctly, with frequent reviews & progressive reductions in protection overtime.
→ E.g., The Australian PMV sector: During the mid-20th century tariffs were introduced on imported vehicles to protect Australian PMV manufacturing.
Argument 3 – National Security (Defence) Argument:
Some validity as securing takes priority over economic benefits however every industry could make a case for being strategic
→ National Security: Some industries are vital for national protection & should be protected ensuring a country can defend itself if war was to outbreak.
→ Industries such as banking, communication & agriculture are important for national security & should be protected from trade liberalisation.
→ Counter: Challenge to identify what industries are considered important for national interest, most interests would say they’re vital.
→ This argument was popular in the world war era & can still be valid since security takes priority over economic benefit.
→ E.g., Australian Defence manufacturing sector, development of the “Bushmaster” army vehicles was heavily subsidised by the Aus government.
Argument 4 – Diversification Argument:
Generally invalid as its arguing against the gains from specialisation.
→ Diversification: If a country completely applied the principle of a comparative advantage, it may only specialise in a narrow range of one or two products.
→ If there was a sudden decline in global demand or a decrease in global prices this could seriously harm economies who specialise in only a few products.
→ Protection should be given to sectors in the economy which don’t have a comparative advantage to diversify its industry.
→ Counter: This argument is weak as there are no countries with a comparative advantage in only 1 or 2 products.
Argument 5 – Protection of Domestic Employment Argument:
Invalid as employment in non-protected industries will decline & other countries will retaliate.
→ Buying imports means employing foreign workers, whereas buying domestic goods employs domestic workers.
→ Protection policies shift consumer spending away from imports to buying domestic goods increasing domestic production.
→ Counter: Other industries will suffer as domestic employment is protected in certain industries & hurt in others
E.g., price of inputs decrease for domestic firms since there are fewer imports therefore price increases & households have lower purchasing power.
→ E.g., protecting the Aus car manufacturing holden & ford meant other industries like transport companies suffered as they had higher vehicle costs.
Argument 6 – Cheap Foreign Labour Argument:
Invalid since specialisation based on comparative advantage allows both countries to gain
→ It is an unfair playing field when high wage countries (like Aus) where the minimum wage is $915.90 a week are forced to compete with low wage countries like China where minimum wage is $112 a week.
→ Therefore, industries in high wage countries should be protected.
→ Counter: This fails to recognise its unfair for countries with low levels of capital equipment & technology (Indonesia) to compete with countries with high levels of capital equipment & tech (Aus & Germany).
Argument 7 – Favourable Balance of Trade Argument (Balance of Payments Argument):
Invalid as countries aim to increase both exports & imports
→ Asserts a trade deficit (when net imports are greater than net-exports) is unfavourable & a trade surplus (when net exports are greater than net imports) is favourable.
→ Consequently, this argument states that protectionist policies should be implemented to restrict imports
→ Counter: There are no good/bad balance countries should aim to increase both exports & imports
Protectionist policies designed to decrease imports cause exports to decrease as well as they raise the cost of other domestic industries reducing their competitiveness & therefore exports
The Balance of Payments
Structure of Australia’s Balance of Payments Accounts Including Examples of Transactions occurring in each category:
The Balance of Payments consists of: The Current Account + the Capital & Financial Account
The Current Account Consists of:
→ Net Goods:
Goods for Export Credit: E.g., iron ore receipts form China
Goods for Import Debit: E.g., Computer import payments to Japan
→ Net Services:
Services for Export Credit: E.g., education export receipts from a Chinese student
Services for Import Debits: E.g., Personal travel payments from Australians travelling abroad.
→ Primary Income:
Primary Income Credit: E.g., Australian Investor receiving dividend from an overseas investment
Primary Income Debit: E.g., Overseas investor receiving interest payments from an Australian investment
→ Secondary Income:
Secondary Income Credit: E.g., Italian pensioner living in Australia & receiving the Italian pension.
Secondary Income Debit: E.g., Australia providing foreign aid to Ukraine
Capital Account:
→ Capital Transfers:
Capital Transfer Credit: E.g., USA Building a Hospital in Aus
Capital Transfer Debit: E.g., Aus building a hospital in the USA
→ Acquisition of non-produced non-financial assets:
Aq n-p n-f Asset Credit: E.g., US Pharmaceutical company purchasing a patent from Australia
Aq n-p n-f Asset debit: E.g., Taylor Swift selling her copyright to shake it off to an Australian Investor.
Financial Account:
→ Direct Investment (+10% Ownership):
Direct Investment Credit: E.g., A Chinese firm buying 30% of S.Kidman Cattle Station from Gina Rinehart
Direct Investment Debit: E.g., An Australian resident buying 15% of Singapore Airlines.
→ Portfolio Investment (-10% ownership):
Financial Derivatives Credit: E.g., US resident buying 5% of RioTinto
Financial Derivatives Debit: E.g., Australian resident buying 2% of Apple
→ Other Investment
Other Investment Credit: E.g., AUD exported from an Aus resident to an overseas resident.
Other Investment Debit: E.g., AUD imported from an overseas resident to an Aus resident.
→ Financial Derivatives
Financial Derivatives Credit: E.g., US resident buying a share option of an ASX listed company.
Financial Derivatives Debit: E.g., Aus resident buying a share option of an NYX listed company.
→ Reserve Assets
Reserve Asset Credit: E.g., RBA selling monetary gold to an overseas resident.
Reserve Asset Debit: E.g., RBA buying monetary gold from an overseas resident
The Balance of Payments
The Concept of the Double Entry System:
Double Entry System Definition: Every transaction is represented by two entries of equal & opposite value reflecting the inflow & outflow element of each exchange.
→ Every transaction is recorded twice, once as a debit & once as a credit
Credit Transaction: Result in an inflow of money into Australia from a foreign resident
→ E.g., exports of goods & services, income receivable, increase in foreign liabilities & the export of currency
Debit Transaction: Result in an outflow of money from Australia to a foreign resident.
→ E.g., imports of goods & services, income payable, increase in foreign assets & the import of a currency.
Example Response: Outline how a transaction will be recorded if an Australian firm purchases cars from Germany for $AUD 1 million
The import of the good (cars) will be recorded in the Current Account; Net Goods as a $1 million debit, in exchange for the cars there is an export of Australian currency to Germany of $1 million recorded in the Financial Account; Other Investment as a credit, the sum of the credit entries $1 million are offset by the sum of the debit entries -$1 million therefore the balance of payments are balanced.
Example Response: Describe the double entry system of recording transactions in Australia’s Balance of Payments:
The double entry system means that for every transaction is represented by 2 entries of equal & opposite value reflecting the inflow & outflow of each exchange whereby every transaction is recorded twice: once as a debit & once as a credit.
e.g., if Australia buys $1 million worth of cars from Germany, this import is recorded as a $1 million debit in the current account; net goods while simultaneously being recorded as a $1 million credit in the financial account; other investment due to the export of Aud.
The Balance of Payments
The Concept of the Balance of Payments:
Balance of Payments: The balance of payments is a record of all economic transactions between the residents of Australia & the residents of the rest of the world including individuals, firms & the government.
→ It is reliant on the double entry system meaning it must sum to zero.
Composition of the Balance of Payments:
→ The Current Account
→ The Capital & Financial Account
→ BOP = Current Account + Financial Account = 0
The Balance of Payments:
The Current Account:
The Current Account: Records all transactions involving the exchange of net goods, net services & net income between Australian residents & foreign residents.
The Current Account Balance Formula:
→ Balance on the Current Account = Balance of Goods & Services + Net Income
Outcomes of the Current Account:
→ Current Account Deficit (CAD): When debits for net goods, net services & net income exceeds credits for not goods, net services & net income
→ Current Account Surplus (CAS): When credits for net goods, net services & net income exceed debits for net goods, net services & net income.
Trends in Australia’s Current Account:
→ Traditionally records a Current Account deficit
Due to the reliance on foreign investment to supplement domestic savings
(Debits in Primary Income)
i.e., savings investment gap
→ From 2019 to the end of 2023 Australia recorded a Current Account surplus
→ Since 2024 Australia has once again recorded a current account deficit of $12,546 million
→ The total balance of the Capital & financial Account is a surplus of $12,546 million
Structure of the Current Account:
Net Goods:
→ Largest component of the current account including imports (debit) & exports (credit) of raw materials, manufactures, minerals & fuel, food & rural products.
→ Australian exports (credits) are concentrated in the agricultural & mining sectors (commodities)
E.g., Iron ore receipts to China
→ Australian imports (debits) consist mainly of intermediate & capital goods used by industry & consumer goods.
E.g., Computer import payments from Japan
Net Services:
→ Accounts for around 1/4 of the current account however it is trending upwards (long term trade).
→ Australia often records a deficit of services (debits>credits)
→ Includes transactions in the transport of goods (freight/shipping), travel by students & tourists, tourism related services & other business services
E.g., ict & financial services
→ Australian service exports (credits) are dominated by education & tourism.
E.g., Education export receipts from Chinese students
→ Australian service imports (debits) consist of businesses & services
E.g., Personal travel payments of an Australian resident travelling overseas
Trade Balance/Balance of Goods & Services: Not Part of the structure just a relative explanation
→ Trade balance is equal to net goods + net services
→ A positive trade balance means there is a trade surplus & credits exceed debits.
→ A negative trade balance means there is a trade deficit & debits exceed credits.
→ Trade Balance (December 2024): $7494million (trade surplus)
Net Primary Income:
→ Primary income refers to income earnt by Australian residents from foreign residents (credit):
E.g., Australian investor receiving a dividend payment from an overseas investment.
→ & Primary income refers to income paid to foreign residents from Australian residents (debit).
E.g., Overseas investor receiving an interest repayment from a loan to an Australian investor.
→ Greatest of the two income accounts, predominantly associated with investment flows in & out of Australia.
→ Primary income consists of two categories:
Compensation of Employees for the use of Labour: The payment of wages & salaries to workers who are employed in an overseas company.
Investment Income for the use of Financial Capital: Australian residents receive income payments from overseas investments & make income payment to foreign investors, there are two main types of investment (foreign equity) & interest payments associated with loans (foreign debt).
Net Secondary Income:
→ Secondary Income is relatively small making no real significant difference to the current balance.
→ Secondary income involves transactions where real or financial resources are provided (goods, services, or financial assets) but nothing of economic value is received in return.
→ It includes transactions in foreign aid, gifts, donations & pensions.
→ A credit in this account is an inflow of one of the previous transactions:
E.g., Italian Pensioner living in Australia receiving the Italian pension
→ A debit in this account is an outflow of one of the previous transactions:
E.g., Australia providing foreign aid to Ukraine
Income Balance/Net Income: Not Part of the structure just a relative explanation
→ Income Balance = Net Primary Income + Net Secondary Income.
→ A positive income balance means there is an income surplus where credits exceed debits.
→ A negative income balance means there is an income deficit where debits exceed credits.
→ Income balance (December 2024): $2040million (income deficit)
The Balance of Payments:
The Capital & Financial Account:
The Capital & Financial Account: Is comprised of two sub-accounts being the capital account & the financial account.
→ The financial account has a larger balance compared to the capital account which has a smaller balance.
→ The capital & financial account balance (KAB) is traditionally in surplus.
Structure of the Capital & Financial Account:
Capital Account: The Capital account records financial transactions that do not affect income or production. It is comprised of capital transfers & the acquisition & disposal of non-produced, non-financial assets. The size of transactions in the capital account are small & insignificant – the balance is always less than $1billion.
It consists of:
→ Capital Transfers:
Capital transfers include migrant funds & types of aid related to capital formation.
It is the most dominant component of the capital account
A credit in this account could be:
E.g., USA building a hospital in Australia
A debit in this account could be:
E.g., Australia building a hospital in the USA
→ Acquisition of Non-Produced Non-Financial Assets:
Non-Produced, Non-Financial Assets are intangible.
Examples would include copyrights, patents & franchises.
A credit in this account could be:
E.g., Guy Sebastian selling copyright to ‘Battle scars’ to a US investor.
A debit in this account could be:
E.g., Taylor Swift selling copyright to ‘Shake it Off’ to an Australian investor.
Financial Account: Comprised of transactions associated with changes of ownership of Australia’s foreign financial assets & liabilities, including investments made y overseas residents or Australian companies & Australian residents buying overseas companies.
It consists of:
→ Direct Investment:
Direct investment occurs when a firm establishes a new subsidy i.e., 100% ownership or if an investor obtains a share of 10% or more in a company or asset.
The objective of direct investment is to gain a lasting interest in a foreign enterprise so you can exercise a significant influence in its management.
A credit would be an overseas resident investing in an Australian firm or asset:
E.g., Chinese firm buying 30% of S.Kidman Cattle Station from Gina Rhinehart.
A debit would be an Australian resident investing in an overseas firm or asset:
E.g., Australian resident buying 15% of Singapore Airlines.
→ Portfolio Investment:
Portfolio investment involves all foreign investment in securities bonds & other financial assets involving an investor obtaining a share less than 10% or a company or asset.
Portfolio investment is more short-term in nature & speculative as the investor is not assumed to have any influence in the operation or decision making of the enterprise.
A credit would be an overseas resident investing in an Australian firm or asset.
E.g., An overseas resident buying 5% of RioTinto
A debit would be an Australian resident investing in an overseas firm or asset.
E.g., An Australian resident buying 5% of Singapore airlines.
→ Other Investment:
Other investment is a residual category of transactions that don’t fit into one of the other investment categories.
Other investment transactions can include:
Currency: The export (credit – e.g., Aud exported from Aus to an oversea resident) & import (debit – e.g., Aus imported from an overseas resident to an Australian resident) of currency associated with transactions involving trade & foreign investment.
Deposits: Money is deposited or withdrawn from banks across boarders.
Trade Credits: An importer purchases goods from overseas & does not pay for the goods until they’re received.
→ Financial Derivates:
Financial derivatives involve contracts whose values is derived from the price of an underlying financial asset or index e.g., future or option contracts.
Example of a credit:
E.g, An American purchasing share options in an ASX listed company.
Example of a debit:
E.g., An Australian purchasing share options in an NYSE listed company.
→ Reserve Assets:
Financial assets controlled by the RBS
E.g., monetary gold, foreign exchange currencies & government bonds.
Example of a credit:
E.g., RBA selling monetary gold to overseas resident
Example of a debit:
E.g., RBA purchasing monetary gold from an overseas resident
The Balance of Payments:
Reasons for Australia’s Current Account Balance:
The Trade Balance:
Definition: The difference between the value of a country’s exports & imports of goods & services.
Formula:
→ Net Goods + Net Services
→ Total Exports – Total Imports
Factors Affecting the Trade Balance:
1. Commodity Prices: Mining/Mineral Resources & Agricultural Products.
→ Australia is a significant exporter of commodities including minerals (iron ore & coal), agricultural products & energy resources
→ Fluctuations in global commodity prices significantly impact Australia’s export earnings & consequently the trade balance
E.g., if world commodity (iron ore) prices increase the value of Australia’s exports increase (increase in Net Goods), increasing the trade balance & CAB
2. Global Demand of Exports/Global Economic Conditions:
→ The level of global demand for Australian exports plays a key role in determining the trade balance.
→ Economic conditions in major trading partners such as China & other Indo-Pacific countries influence the demand for Australia’s goods & services.
E.g., If China was in a period of high economic growth, they would demand more Australian commodities increasing the value of our exports (increase credits in Net Goods) increasing the trade balance & CAB as a result.
3. Exchange Rates:
→ Exchange rates impact the competitiveness of Australian goods in global markets.
→ If the AUD strengthens, Australian exports become more expensive for foreign buyers (decreasing credits) while imports become cheaper for Australian buyers (increasing debits).
This results in a decrease in the trade balance & the CAB.
E.g., AUD depreciation decreases import demand (PVS/outbound tourism) due to higher costs for Australians increasing export demand (inbound tourism/education) as it's cheaper for foreigners, boosting credits (exports), reducing debits (imports), & improving the trade balance & CAB.
4. Domestic Economic Conditions:
→ The strength of the domestic economy effects both import & export levels.
→ Strong domestic demand may lead to increased imports while a robust economy can also boost the production & export of goods & services.
E.g., if strong domestic GDP grows in Australia, production increases boosting national income (due to decreased labour demand), therefore demand for imports (PMVs/outbound tourism) rises (increasing debits) as Australian households experience higher disposable incomes leading to a decrease in the trade balance & CAB.
Simultaneously, strong domestic GDP growth enhances the production of goods & services for exports (increasing credits) contribution to an increase in the trade balance & CAB.
5. Free Trade Agreements:
→ International FTAs & changes in tariffs influence the trade balance.
→ The reduction of trade barriers or signing of FTAs enhance the market for Australian exporters increasing exports.
E.g., ChaFTA 2015: Tariffs on Australian commodities exported to China were eliminated, positively impacting the trade balance & by generating more credits (exports) in the Net Goods category of the current account (increasing the CAB).
6. Technological Change:
→ Advances in technology impact trade patterns by influencing what goods & services are demanded.
E.g., Advancement in technology enhances the efficiency of export production i.e., Australia’s transition from exports centred on agricultural goods (wool) to high-value commodities (LNG & gold) was influenced by technological advancements in the mining sector increasing the value of credits due to increased export value in Net Goods increasing the trade balance & the CAB.
7. Transportation & Infrastructure:
→ The efficiency of transportation & logistical infrastructure affects the speed & cost of transporting goods & services overseas.
→ Infrastructure improvements enhances the competitiveness of Australian exports.
E.g., Improvements in Australia’s infrastructure enhances (decreased COP) the international competitiveness of Australia’s exports, increasing the trade balance & CAB through the increase in credits (increased exports) in Net Goods & Net Services.
These factors are interconnected, changes in one factor have a cascading effect on others.
The Balance of Payments
The Income Balance:
Income Balance Definition: Reflects net income earned by Australian residents/firms from foreign investment minus the income paid to foreign investors by Australia residents/firms.
Calculation of the Income Balance:
→ Net Primary Income + Net Secondary Income
Or
→ Total Income Inflow – Total Income Outflow
Factors Affecting the Income Balance:
1. Interest & Dividend Payments:
→ Australia traditionally has a savings investment gap therefore having a net foreign investment liability position (total foreign investment inflows > total foreign investment outflows).
→ Since foreign investment needs to be repaid in either dividend (for foreign equity) or interest (for foreign debt) repayments which are recorded in primary income the income balance is affected by increases &/or decreases in foreign investment.
E.g., If Australia increased foreign investment (FDI/Portfolio/Other investment) more debits in the current account’s primary income would occur (due to increased dividends & interest payments) leading to a decrease in the Income balance & CAB.
2. Foreign Aid Remittances (Income – wage & salaries):
→ Foreign aid provided by Australia to overseas countries & remittances (wages & salaries) from Australin residents working abroad influence the income balance/
E.g., If Australia increased the amount of foreign aid provided to Ukraine a decrease in the income balance due to increased debts in the secondary income category would occur, decreasing the income balance & CAB.
Alternatively int Australian residents received increased wages & salaries from international businesses, the income balance & CAB would increase as there are more credits in the primary income category.
3. Exchange Rates:
→ Since the amount of interest & dividends provided to foreign investors in return for investments is converted into foreign currencies the exchange rate influences the income balance.
E.g., if AUD appreciates Australian residents who have borrowed from overseas will have to pay less Aud to service their debt or less AUD as dividends on equity.
This results in fewer debits in primary income therefore increasing the income balance.
4. Global Economic Conditions:
→ The overall economic conditions in Australia & its trading partners can influence the income balance.
→ Economic growth, interest rates & business profitability are interconnected factors affecting income flows.
E.g., During an economic boom in Australia there are more debits in primary income (decreasing the income balance & CAB) as more dividends must be paid overseas due to the higher profits in Australian firms.
Some of these profits especially in the mining sector are returned to foreign investors as dividend payments, decreasing the income balance.
The Balance of Payments:
The Current Account Balance & the Savings/Investment Gap:
Definition of the Savings Investment Gap: The difference between the domestic supply of savings & the domestic demand of investment.
Formula used to calculate the savings investment gap:
→ Savings/Investment Gap = Savings (S) – Investment (I)
Relation between the Current Account & Savings Investment Gap: the current account balance is equal to the savings/investment gap.
→ Current Account Balance – Savings/Investment Gap
E.g., if Australia’s economic growth increases investment rises relative to savings decreasing the CAB,
conversely if economic growth decreases investment falls relative to savings increasing the CAB
What this means:
→ If a country’s savings exceeds its investment (S>I) it will have a current account surplus
Or if a country’s savings increases relative to investment the current account balance will increase toward a surplus.
→ If a country’s savings is less than investment (S<I) it will have a current account deficit.
Or if a countries savings decreases relative to investment the current account balance will decrease toward a deficit.
I.e., Australia’s demand for domestic investment is traditionally greater than its supply of domestic savings, consequently, until 2019 Australia’s investment exceeded its saving indicating its negative investment gap resulting in a current account deficit.
Australia has a strong want for domestic investment in the mining & resources sector however due to its low population the pool of potential domestic savings is low – therefore a gap between the availability of savings & need for investment exists.I.e., 2020 – 2023: Australia’s investment was less than savings meaning it had a positive savings investment gap resulting in a current account surplus due to increased domestic savings during the pandemic period (consumer negative sentiments & boarder closures reducing consumption levels) allowing Australia to increase their ability to meet domestic demand for investment allowing for a reduction in Australia’s investment gap.
I.e., Since 2024 Aus’s investment has been more than savings indicating a negative savings/investment gap resulting in a CAD due to Australia ran down its domestic savings accumulated during Covid & it experienced an increase in foreign investment inflows
The Balance of Payments
Forms of Foreign Investment to Fill the Savings Investment Gap:
Australia’s reliance on foreign investment: Australia relies on foreign investment (foreign equity & foreign dent) to fill the savings/investment gap.
Foreign Equity: Inflows:
→ Foreign equity is the total value of Australian assets (companies, shares & land) owned by foreign residents/firms.
→ These investors seek dividend/rent repayments in return.
E.g., An increase in foreign equity increases primary income debit in the form of dividends in the current account decreasing the income balance & the CAB.
Foreign Debt: Outflows:
→ Foreign debt is the total value of loans provided to Australian residents/firms by foreign residents/firms.
→ These foreign investors seek internal repayments in return.
E.g., An increase in foreign debt increases primary income debits in the form of interest in the current account decreasing the income balance & the CAB
The Balance of Payments:
Trends in Australia’s Current Account Over the Last 10 Years:
Patterns in the Current Account Balance (CAB):
→ The trade balance is more volatile than the income balance
→ The trade balance fluctuates from deficit to surplus responding to changes in domestic & global economic activity.
→ The income balance is usually in a deficit due to Australia’s reliance on foreign investment.
→ The trade balance & current account balance have a strong positive relationship.
2015 – 2019 Current Account Deficit Falling: (Increase in CAB)
→ The trade balance is increasing due to the increase in credits in net goods as a result of:
Rising commodity prices: Increasing the price of exports
Higher iron ore prices due to shortages caused by a dam collapse in Brazil.
Increased overseas growth:
Growth of overseas countries (including China) increased the international competitiveness of Australian exports.
→ The income balance was rising due to an increase in credits & a decrease in debits in primary income. This is the result of:
Low Global interest rates reducing servicing costs (interest payments) on foreign debt (Decreasing Debits)
Increased profitability of Australian businesses increasing dividend payments on foreign equity (Increasing Credits)
2020 – 2023: Current Account Surplus (increase in CAB):
Increase in the trade balance surplus as a result of increased net goods credits, this is a result of:
→ Rising Commodity Prices:
High mineral & energy prices driven by the supply shortage as a result of the Ukraine war.
Agriculture prices rising due to tight global supply as a result of poor global growing conditions & the Ukraine war.
→ Rising World Growth:
High demand for key exports like iron ore & coal significantly boosted the value of Australian commodity exports – largely driven by demand from China, boosted by the Beijing infrastructure building stimulus.
→ Domestic Growth:
Covid recession resulted in a slow recovery slowing demand for the import of goods.
→ Strong Growth in Services Post Pandemic
Notable growth in education & tourism.
→ Depreciation of the AUD:
Improved international competitiveness for exports.
→ Increase in the net income balance (decrease in the deficit) due to increased credits & decreased debits this is a result of:
Australia relied on cumulative savings from the pandemic period resulting in a decrease in foreign investment inflows decreasing interest & dividends paid overseas.
Increased foreign investment outflows due to high domestic savings increasing interest & dividends received by Aus.
2023-2024: Current Account Deficit (Decrease in CAB):
→ A decrease in the trade balance occurred as a result of decreased credits & increased debits in net goods. As a result of:
Falling commodity prices particularly of iron ore & coal due to lower global demands leading to a decrease in credits in net goods.
Domestic economic recovery increased the import of consumer goods, capital goods & services (in particular travel) increasing debits in net services.
→ The income balance increased slightly due to small increases in credits and decreases in debits. As a result of:
Strong returns on Australian foreign equity assets increasing credits in primary income.
Reduction of dividends paid to overseas portfolio investors decreasing debits in primary income.
Savings investment gap results in increased investment & a fall in the stock of domestic savings as the economy recovers
The Balance of Payments:
Trends in Australia’s Financial Account over the Past 10 Years:
Financial Account Trends:
→ Australia traditionally has a savings investment gap meaning the level of domestic savings does not match or meet the domestic demand for investment.
This is reflected through a financial account surplus.
→ From 2019 – 2023 Australia’s financial account balance has been consistently decreasing recording a deficit.
This trend can be attributed to the elimination of the savings investment gap due to the high growth in the pool of savings
→ Since 2020, Australia’s financial account has been returned to a surplus, as the Australian economy runs down the domestic savings & the level of foreign investment inflow increases
Foreign Investment:
Concept of Foreign Investment in Terms of Australia’s Foreign Investment Flows: OVERVIEW
Definition of Foreign Investment: The stock of financial assets in Australia owned by foreign residents & the financial transactions in the Balance of Payments that increases or decreases this stock. E.g., Overseas investors purchasing an Australian asset or sending money to an Australian firm.
Distinction between Investment & Foreign Investment:
→ Investment: It is a component of aggregate expenditure and refers to the purchase of capital investment.
→ Foreign Investment: Is the stock of financial assets in Australia owned by foreign residents & the financial transaction in the balance of payments that increase or decrease this stock.
When economists refer to foreign investment, they are often referring to the inflow of investment from overseas – this then becomes foreign liabilities.
E.g., Overseas investors purchasing an Australian asset or lending money to an Australian firm.
→ Australia’s foreign investment is primarily used to fund domestic business investment for productive purposes.
→ Foreign investment allows Australia to achieve strong economic growth.
Australia’s Negative Savings Investment Gap:
→ Australia has a high demand of domestic investment (due to the mining industry) & a small population (low stock of savings) relative to other developed nations.
This high demand can be attributed to the rich endowment of natural resources requiring capital equipment in production to exploit
→ Consequently, there is a deficiency of savings & a small pool of investment funds available to firms in Australia.
→ This results in a negative savings investment gap where investments > savings.
Foreign Investment:
Concept of Foreign Investment in Terms of Australia’s Foreign Investment Flows: Types of Foreign Investment:
Foreign Investment Inflows: Credit in the Financial Account:
→ Foreign investment transactions where foreign residents/firms load debt to Australian residents/firms or purchase Australian equity (an asset).
→ Increases credits in the financial account
→ E.g., A Chinese bank lending to an Australian firm will be a credit transaction in other investment within the financial account.
Foreign Investment Outflows: Debit in the Financial Account:
→ Foreign investment transaction where Australian residents/firms loan debt to foreign residents/firms or purchase foreign equity.
→ Increases debits in the financial account.
→ E.g., An Australian firm purchasing 15% of Singapore airlines will be a debit transaction in direct investment in the financial account.
Foreign Investment:
Concept of Foreign Investment in Terms of Australia’s Foreign Investment Flows: Forms of Foreign Investment:
Each type of foreign investment inflows & outflows can be classified in two forms; foreign debt & foreign equity. They are recorded in the Financial Account.
Foreign Debt (Loans):
→ The level of outstanding loans owed by Australian residents to overseas residents & loans provided by Australian residents to overseas residents.
→ Recorded in other investment in the financial account.
→ E.g., An Australian resident takes out a loan from a Chinese resident.
Foreign Equity (Investment):
→ The total value of Australian assets (e.g., land shares & companies) In foreign ownership & the total value of foreign assets in Australian ownership.
→ Recorded in direct or portfolio investment in the financial account.
E.g., An Australian resident owns part of Apple.
Foreign Investment:
Concept of Foreign Investment in Terms of Australia’s Foreign Investment Flows:
Categories of Foreign Investment:
Foreign Direct Investment:
→ When a foreign investor obtains a significant controlling interest of a domestic firm (10% or more ownership) or an overseas firm establishing a subsidiary.
E.g., A Chinese firm buying 30% of S.Kidman & Co Cattle Station.
Portfolio Investment:
→ All forms of borrowing & all forms of equity investment in which less than 10% ownership is purchased by a foreign investor.
→ Generally, it is speculative & short term.
E.g., An overseas investor buying 3% of Quantas Airways.
Foreign Investment:
Concept of Foreign Investment in Terms of Australia’s Foreign Investment Flows:
Return on Foreign Investment:
The return on Foreign Investment is recoded in the Current Account under Primary Income.
Dividends:
→ Share of profits that are disturbed to owners of equity (foreign investors)
E.g., A Chinese firm receiving a portion of the profit from the equity they hold in S.Kidman & Co Cattle Station.
→ Recorded in Primary Income in the Current Account.
Interest:
→ The renumeration received by foreign investors for providing foreign debt.
E.g., An Australian firm repaying interest to a Chinese bank they borrowed money from.
→ Recorded in Primary Income in the Current Account.
Foreign Investment:
Concept of Foreign Investment in Terms of Australia’s Foreign Investment Flows:
Foreign Investment Inflows:
→ Foreign investment transactions where foreign residents/firms loan foreign debt to Australian residents/firms or purchase Australian equity.
→ Increase credits in the Financial Account.
E.g., A Chinese Bank lending to an Australia firm will be a credit transaction in Other Investment in the Financial Account.
→ Foreign investment inflows are considered foreign liabilities – the foreign equity & foreign debt owned by foreign residents – an inflow of money into Australia.
Foreign Investment:
Concept of Foreign Investment in Terms of Australia’s Foreign Investment Flows:
Foreign Investment Outflows:
→ Foreign investment transactions where foreign residents/firms loan foreign debt to Australian residents/firms or purchase Australian equity.
→ Increase debits in the Financial Account:
E.g., An Australian firm purchasing 15% of Singapore Airlines will be a debit transaction in direct investment in the Financial Account.
→ Foreign investment outflows are considered foreign assets – the foreign equity & foreign debt owned by Australian residents in an overseas market – an outflow of money from Australia.
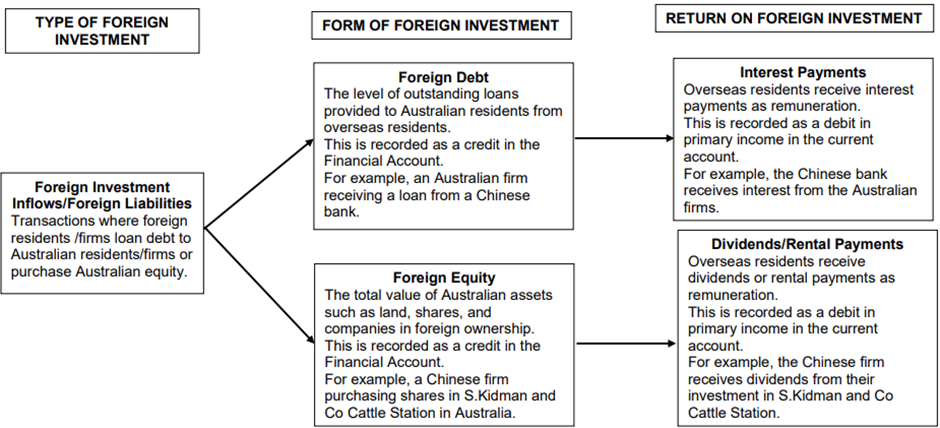
Foreign Investment:
Concept of Foreign Investment in Terms of Australia’s Foreign Investment Flows:
Foreign Direct Investment (FDI):
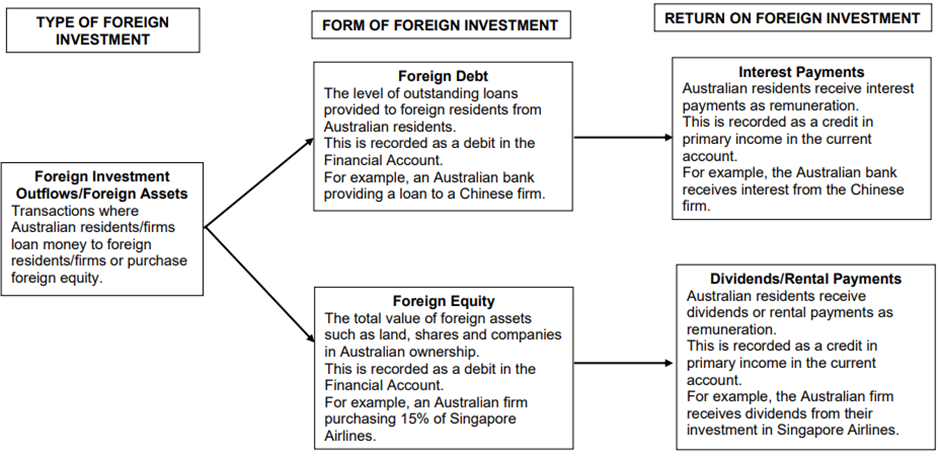
Foreign Investment:
The Distinction Between Foreign Direct & Portfolio Investment:
OVERVIEW
Definition: When a foreign investor obtains a significant controlling interest (10% or more) of a domestic firm or an overseas firm establishes a subsidiary in Australia.
Example:
→ A Chinese Firm Buying 30% of S.Kidman & Co Cattle Station.
Nature of Investment:
→ An investor gains control & becomes actively involved in the management & decision-making process of the company.
→ It is characterised by a long-term interest & the desire to influence the day-to-day operation of the invested entity.
Level of Control:
→ Implies a higher level of control as the investor actively participates in the management & strategic decision of the foreign entity & may be involved in the day-to-day operations of the invested entity.
Foreign Investment:
The Distinction Between Foreign Direct & Portfolio Investment:
Foreign Direct Investment (FDI):
Definition: All forms of borrowing & all forms of equity investment where less than 10% of ownership is obtained by the foreign investor, it is generally speculative & short term.
Example:
→ Overseas Investor buying 3% of Quantas.
Nature of Investment:
→ Involves the purchase of financial assets (stocks & bonds) without obtaining significant ownership or a direct influence on the management of a company.
→ Portfolio investors seek financial returns but not control or active management of the invested entity.
→ More short-term in nature.
→ Investors may buy & sell more frequently based on market conditions, economic outlook or other short-term factors.
Level of Control:
→ Minimal or no control over the management of the companies in which they invest.
→ Primarily concerned with financial returns & do not participate in the operational aspects of the invested entities.
Foreign Investment:
The Concept of Australia’s Foreign Assets, Foreign Liabilities & International Investment Positions:
Foreign Assets – Foreign Investment Outflows:
Definition: Foreign equity & foreign debt owned by Australian residents in overseas markets which is an outflow of money from Australia, meaning foreign investment abroad increases Australia’s foreign assets.
Formula:
→ Foreign Assets: Foreign Equity Outflows + Foreign Debt Outflows
Foreign Investment:
The Concept of Australia’s Foreign Assets, Foreign Liabilities & International Investment Positions:
Foreign Liabilities – Foreign Investment Inflows:
Definition: Foreign equity & foreign debt owned by foreign residents which is an inflow of money into Australia, meaning foreign investments into Australia increases Australia’s foreign liabilities.
Formula:
→ Foreign Liabilities = Foreign Equity Inflows + Foreign Debt Inflows
Foreign Investment:
The Concept of Australia’s Foreign Assets, Foreign Liabilities & International Investment Positions:
International Investment Position IIP:
Definition: Measurement of the stock of Australia’s foreign financial liabilities & foreign financial assets at a point in time, the difference between foreign financial liabilities & foreign financial assets is referred to as Australia’s international investment position.
→ As of December 31st, v2024, Australia’s IIP was a liability of $653.2billion (receiving more investment out of Australia than investment into Australia.
Formula:
→ International Investment = Foreign Liabilities – Foreign Assets
Foreign Investment:
The Concept of Australia’s Foreign Assets, Foreign Liabilities & International Investment Positions:
Net Foreign Debt:
Definition: The difference between a country’s foreign debt liabilities (inflows) & their foreign debt assets (outflows).
It is an indicator of a country’s financial vulnerability reflecting the difference between the amount a country owes foreign creditors & the debt instruments held by a country.
Formula:
→ Foreign Liabilities (Debt) – Foreign Assets (Debt)
→ Foreign Investment Inflows (Debt) – Foreign Investment Outflows (Credit)
Foreign Investment:
The Concept of Australia’s Foreign Assets, Foreign Liabilities & International Investment Positions:
Net Foreign Equity:
Definition: Difference between a country’s foreign equity liabilities (inflows) & their foreign equity assets (debts).
It is an important indicator reflecting the difference between the value of a country’s assets owned by overseas & the value of overseas investments.
Formula:
→ Foreign Liabilities (Equity) – Foreign Assets (Equity)
→ Foreign Investment Inflows (Equity) – Foreign Investment Outflows (Equity)
Foreign Investment:
The Concept of Australia’s Foreign Assets, Foreign Liabilities & International Investment Positions:
Net Foreign Liabilities or Gross Foreign Liabilities:
Definition: Australia’s stock of foreign liabilities (inflows) (both debt & equity) minus Australia’s stock of foreign assets (outflows) (both debt & equity).
Australia’s net foreign liabilities is usually positive due to the large amount of foreign investment (foreign liabilities) into Australia.
Formula:
→ Foreign Liabilities – Foreign Assets
→ Net Foreign debt + Net Foreign Equity.
Foreign Investment:
The Link between Foreign Investment & the Current Account Balance:
OVERVIEW
The Current Account records all transactions involving net goods, net services & the net income between Australia & the rest of the world.
When Australia attracts foreign investment, it often results in an influx of capital, contributing to a surplus in the Financial Account
This surplus in turn tends to offset the Current Account deficit.
→ Investments in Australian assets (businesses, real estate or government bonds) lead to capital inflows.
→ This creates a credit entry in the Financial Account.
→ Profits, dividends & interest payments generated by foreign investments may positively contribute to the income account (creating a debit or credit in the current account) helping balance or mitigate the deficit.
Summary:
→ Foreign Investment Inflows (Foreign Liabilities):
Increase in Foreign Investment inflows increase the Capital & Financial Account balance therefore decreasing the Current Account balance.
Decrease in Foreign Investment inflows decrease the Capital & Financial Account balance therefore increasing the Current Account balance.
→ Foreign Investment Outflows (Foreign Assets):
Increase in Foreign Investment outflows decrease the Capital & Financial Account balance increasing the Current Account balance.
Decrease in Foreign Investment outflows increase the Capital & Financial Account balance therefore decreasing the Current Account Balance.
Foreign Investment:
The Link between Foreign Investment & the Current Account Balance:
Increase in Foreign Liabilities (Increase in Foreign Investment Infows):
Foreign Debt – Liabilities/Inflows (Loans):
→ Due to low levels of domestic savings there is a higher need to borrow from overseas increasing foreign debt.
This is recorded as an increase in credits in other investment in the financial account.
This increases the Capital & Financial Account balance.
→ This causes an increase in interest payments paid overseas as this is the return on foreign debt.
This is recorded as an increase in debit transactions in Primary Income in the Current Account.
Foreign Equity – Liabilities/Inflows (Investment):
→ Investment can come in the form of selling Australian equity leading to an increase in Australian assets purchased by overseas investors.
This is recorded as an increase in credits in direct and/or Portfolio Investment in the Financial Account.
This increases the Capital & Financial Account.
→ This will cause an increase in dividends, profits & rent payments owed to overseas investors in return for foreign equity.
This is recorded as an increase in debits in Primary Income in the Current Account.
This decreases the Current Account Balance
Foreign Investment:
The Benefits & Costs of Foreign Investment:
Benefits:
1. Grows Domestic GDP & Employment while Helping to Supplement Australia’s Low Levels of Savings:
→ Foreign Investment supplements Australia’s domestic savings to fund a higher level of investment.
→ Australia is a resource rich nation (accounting for its high demand for investment) dependent on the inflow of foreign investment to develop its mineral & energy resources.
→ Consequently, foreign investment helps close the savings-investment gap, allowing for greater investment in various domestic sectors, especially the mining sector.
→ This boosts Australia’s GDP growth (due to increased production levels) creating domestic employment (due to increased demand for labour & a decreased unemployment rate) through increased production capacity.
→ This increase in employment & GDP increases Australia’s living standards.
2. Helps Domestic Producers Exploit Comparative Advantages:
→ Helps create capacity in industries where Australia has a comparative advantage (can produce at a lower opportunity cost)
E.g., mineral & energy production, agriculture
→ Meaning foreign investment funds can be used to build or upgrade capital/infrastructure enhancing the productive capacity of these sectors (increased production results in increased international competitiveness results in increased exports).
→ This contributes toward an increase in net exports in the resource sector.
3. Triggers in the Multiplier Process:
→ Foreign investment promotes growth indirectly as a result of the multiplier process.
→ This is when an increase in investment spending transmits a greater spending effect throughout the macro-economy through greater consumption.
4. Encourages Technology Transfers:
→ Foreign investment allows access to new technologies as foreign companies transfer technology to Australia when they undertake investments.
→ New technology is embedded in the new capital equipment paid by foreign investment.
→ This increases Australia’s international competitiveness (therefore increasing exports & decreasing the cost of goods) & provides Australian firms with opportunities to participate in global value chains.
→ Additionally improving the efficiency (decreased cost of production) of Australian industry & aid in the long term growth of the economy,
5. Raises Government Revenue (Fiscal Dividend):
→ Multinational corporations (MNCs) provide revenue (increased production & profits) for the Federal & State governments.
E.g., through company tax & royalty payments.
→ The increased employment in these industries further contribute towards an increase in government revenue helping fund public & merit goods & services.
E.g., Public healthcare, transport, infrastructure & education.
→ This produces benefits for a broad section of the community
6. Improvements in Infrastructure:
→ Inward foreign investment helps to increase the economy’s public & private infrastructure (wider societal benefits) including transport & communication networks.
→ Infrastructure refers to the basic structures & systems that enable an economy to function such as water supply & power grids.
7. Drives Productivity & Growth:
→ Foreign investment promotes productive efficiency.
E.g., The use of new management & work practices, the introduction of new technologies & an increase in competition.
→ By increasing the capital-labour ration (decreased cost of production) through foreign investment it can increase labour productivity leading to higher real incomes.
Foreign Investment:
The Benefits & Costs of Foreign Investment:
Costs:
1. Loss of Economic Sovereignty (Loss of Control of Australian Assets):
→ Foreign investment reduces economic sovereignty as key decisions affecting our economy are made overseas.
→ Foreign control, as a result of foreign investment may conflict with government economic policy & profits would be siphoned back to the foreign company.
(Australia doesn’t benefit from the profit)
→ Counter Argument: However over 95% of small & medium-sized businesses continue to by Australian owned.
2. Loss of Economic Opportunity:
→ There is concern that foreign ownership of vital domestic assets (ports & farmland) poses a threat to our economic & national security.
E.g., the 99 year lease of the Darwin port to a Chinese company in 2015.
→ Counter Argument: Australia produces more food than it consumes, our farmers are substantial exporters. Furthermore, all foreign investments used to acquire such assets must be approved by a government department, the Foreign Investment Review Board which ensures foreign investments align with our National Interest.
3. Outflows of Dividends & Profits:
→ There is an outflow of dividends & profits associated with foreign investment, contributing to the outflow (increased debits) of primary income in the current account of the balance of payments.
→ This reduces the level of income that flows to Australians from our production of GDP.
→ Counter Argument: Many foreign investors choose to reinvest their profits in Australia, approximately half of the income from FDI over the past five years has been reinvested into Australia.
4. Distortion of the Real-Estate Market:
→ Housing Affordability has become an issue in many Australian cities as foreign investors contribute to the demand of housing (the shortage of housing) by purchasing properties in cities like Sydney & Melbourne.
→ Counter Argument: The strong demand for housing also acts as a stimulus for new housing developments, foreign buyers only make up 1% of all real estate purchases in Australia.
5. Bad Behaviour by MNC’s:
→ Multinational corporations have the ability to minimise their Australian tax obligations (decreased tax revenue received by the government) through transfer pricing activities (decreased levels of profits to benefit Australia’s economy).
→ This is where profits generated in Australia can be diminished by utilising tax havens in foreign nations
Foreign Investment:
Trends In Australia’s Foreign Investment Flows over the Last Ten Years:
Australia’s Foreign Assets as of June 2024:
Foreign Assets Debt + Foreign Assets Equity = $3963billion
Australia’s Foreign Liabilities as of June 2024:
Foreign Liabilities Debt + Foreign Liabilities Equity = $4683billion
Australia’s Net Foreign Debt as of June 2024:
Foreign Liabilities Debt – Foreign Assets Debt = $1266billion
Australia’s Net Foreign Equity as of June 2024:
Foreign Liabilities Equity – Foreign Assets Equity = $546billion
Australia’s Net Foreign Liabilities as of June 2024:
Foreign Liabilities – Foreign Assets = $720billion
Australia’s International Investment Position as of June 2024:
Foreign Liabilities – Foreign Assets = $720billion
Total Percetage of GDP:
Debt as a percentage of GDP + Equity as a percentage of GDP = 27%
Overall Trends in Foreign Investment:
→ Over the last 10 years Australia has experienced a slow in foreign investment inflow & an increase in foreign investment outflows
This means foreign investment inflows relative to outflows have increased
→ As a percentage of GDP this has cumulatively decreased net foreign liabilities from 55% of GDP to 27% of GDP & simultaneously decreased Australia’s international investment position by the same margin.
→ There are two primary reasons for this.
The reduction/removal of the savings investment gap due to high savings by Australian firms/residents during the pandemic. In turn there was less demand for foreign investment inflows since Australia has been able to meet investment domestically.
An increase in foreign investment outflows as Australian investors who have savings are buying up foreign assets since they seek higher rates of return overseas.
→ In 2024 there has been a slight increase in net foreign liabilities due to an increase in foreign liabilities as Australia turns to foreign investment inflows on account of the rundown of savings accumulated over Covid.
Inflow Specific Trends:
→ US continues to contribute the most to foreign investment in Australia (25.1% of total foreign investment inflows) with the UK, Japan & Hong Kongs making up the top 4 sources.
→ The mining sector is still the highest recipient of foreign investment into Australia (33% of total foreign investment inflows) with finance & insurance being second (12.5%) & real estate activities being their (12%).
Outflow Specific Trends:
→ US & UK remain the two largest economies for Australian investment abroad.
→ At the end of 2023, Australia’s investment in the US totalled $119.6billion & out investment in the UK was $732.1billion.
→ Australia’s investment in Asia has increased dramatically over the past decade.
→ Between 2012 & 2023 investments into major Asian economies (China, Hong Kong (SAR or China), India, Japan, Republic of Kores & all ASEAN members) have increased from $165billion to $416.3billion.
Foreign Direct Investment Trends:
→ Australia’s net FDI is normally positive representing the inflow of investment tp support Australia’s mining, finance & housing sectors.
→ FDI is normally stable as it’s made with a long-term commitment.
→ In the Covid period (2019-2022) FDI inflows declined from an annual inflow of 60billion to an outflow of 40billion due to the global recession caused by the pandemic.
→ After 2022 FDI returned to pre-Covid levels.
Foreign Portfolio Investments:
→ FPI is more volatile, fluctuation from a net inflow to a net outflow dur to the short-term & speculative nature of this type of investment.
→ The levels of portfolio investment are related to business profitability, share market performance & relative interest rates
Terms of Trade:
The Concepts of the Terms of Trade and the Terms of Trade Index:
Terms of Trade
Definition of the Terms of Trade: An index measuring the relative movements in the prices of imports & exports.
→ It provides a measure of the quantity of imports a country can obtain from a given volume of exports.
Favourable Movement in the Terms of Trade (Increases the Terms of Trade):
A favourable movement (increase) in the Terms of Trade occurs because of two reasons:
→ Export prices rise relative to import prices
→ Import prices fall relative to export prices
When export prices are higher than import prices, standard of living increases (a given volume of exports now buys a larger quantity of imports) – the terms of trade is improving.
Unfavourable Movement in the Terms of Trade (Decrease in the Terms of Trade):
An unfavourable movement (decrease) in the terms of trade occurs because of two reasons:
→ Export Prices fall relative to import prices
→ Import prices rise relative to import prices
When import prices are higher than export prices, standard of living decreases (a given volume of exports now buys a smaller quantity of imports) – the terms of trade is worsening.
Terms of Trade Index:
Definition of the Terms of Trade Index: A numerical figure comparing the price of Australian exports to the price of Australian imports.
Formula:
→ TOT = Export Price Index (XPI) / Import Price Index (MPI) X 100
Export Price Index:
Definition: Calculated by selecting representative groups of exports & determining the weighted average of their prices taking into account the relative importance of the item in the index.
→ Base year is always selected & assigned an index value of 100.
Formula:
→ XPI = Current Year Price / First Year Price X 100
Most Important Category in the XPI: Commodities
Examples: Iron Ore, Coal, Liquid Natural Gas & Wool
Import Price Index:
Definition: Calculated by selecting a range of representative groups of imports, determining the weighted average of their prices taking into account the relative importance of the item in the index.
→ Base year is always selected & assigned an index value of 100
Formula:
→ MPI = Current Year Price / First year (Base Year) Price X 100
Most Important Category in the MPI: Manufactured Goods
Examples: PMV’s & White Goods
Terms of Trade:
Factors that Affect the Terms of Trade, Including Changes in Commodity Prices:
Factors Affecting the Prices of Exports (XPI):
Commodity Prices:
→ Australia has a comparative advantage in the production of primary commodities form the mining & agricultural sectors.
→ Therefore, the most important determinant of Australia’s export price index is commodity prices.
If commodity prices rise Australia’s export price index rises, ceteris paribus, so will the Terms of Trade.
→ Demand Side:
Changes in global demand for commodities result in changes in the XPI.
Higher demand for commodities increases the price of exports & the XPI.
E.g., high demand from China or Australian commodities increases the prices of commodities increasing Australia’s XPI, therefore increasing the TOT.
→ Supply Side:
Changes in the availability of commodities results in changes in the XPI.
Negative supply side shocks decrease global supply & cause an increase in export prices increasing XPI.
E.g., The Ukraine war restricted global supply & increased energy & food prices increasing Australia’s XPI & therefore increasing the TOT.
Composition of Trade:
→ Australia has shifted from rural exports to primary exports (iron ore, coal, gold) with relatively higher market prices compared to other exports.
This increases the price of exports & the XPI, in turn increasing the TOT.
→ Additionally an increase in Elaborative Transformed Manufactures exports (pharmaceuticals & ICT equipment) facilitated by microeconomic reform increased XPI as EMTs tend to increase in price overtime.
Factors Affecting the Prices of Imports (MPI):
Trade Liberalisation:
→ Decreasing import prices due to trade liberalisation (EMTs e.g., car industry) i.e., the removal of artificial trade barriers (e.g., tariffs, subsidies, quotas) between economies contribute to decreases in MPI increasing the TOT.
→ Emergence of fast growing, low-cost producers (comparative advantage) such as China have pushed down the prices of manufactured goods decreasing our MPI increasing the TOT.
Movements in the Australian Dollar (Exchange Rates):
→ When the AUD appreciates, it takes fewer Australian Dollars to purchase the same amount of foreign currency needed to pay for imported goods, decreasing the price of imports decreasing the MPI, increasing the TOT.
→ When the AUD depreciates, it takes more Australian Dollars to purchase the same amount of foreign currency needed to pay for imported goods, increasing the price of imports increasing the MPI, decreasing the TOT.
World Oil Prices:
→ One of Australia’s most important imports is refined petroleum.
→ If world oil prices increase, MPI increases, and ceteris paribus, decreasing the TOT.
→ E.g., during 2022-2024 oil prices spiked due to the Russia-Ukraine war & tensions in the Middle East increasing the cost of production for manufactured goods decreasing MPI & the TOT.
Terms of Trade:
Effects of Changes in Australia’s TOT:
→ There are various positive effects of a high terms of trade/favourable movement in the Terms of Trade including;
Increase in the Current Account Balance
Appreciation of the AUD
Increase in Aggregate Demand
Primary Effects:
Increase in Economic Growth (GDP Growth):
→ An increase in the TOT due to higher commodity prices leads to an expansion in the economy, stimulating the business cycle.
→ Due to these higher commodity prices, profits in the mining sector rise, encouraging more investment in their sector to exploit the opportunity for greater profits.
→ This increases production creating more domestic employment (due to the increased demand for labour) opportunities, increasing productive capacity & GDP growth.
→ GDP growth will continue to increase due to the positive multiplier effect creating greater consumption & income in the economy due to increased employment.
Increase in the Trade Balance & the Current Account Balance:
→ There is a direct relationship between the TOT & Trade Balance.
→ An increase in the TOT increases export values, increasing the Trade Balance (only if the volume of exports & imports does not change).
→ Causing the Current Account Balance to increase as the value of credits (exports) increases marginally higher than the value of debits (imports) in Net Goods & Net Services (the Trade Balance).
→ E.g., Since 2020 XPI has increased significantly due to an increase in commodity prices increasing the value of iron ore exports to overseas markets increasing credits in net goods, increasing the Trade Balance & the Current Account Balance.
Exchange Rates:
→ Favourable TOT leads to an appreciation of AUD, as high export prices such as increased prices for Australia’s export commodities increases the demand for AUD (increased credits in the Trade Balance).
→ High AUD is beneficial for consumers as it reduces the prices of imported goods & services.
→ However, it creates a ‘two-speed’ economy (Dutch Disease) where producers & exporters in the non-mining sector are disadvantaged by the higher exchange rate.
Due to a decrease in their international competitiveness.
E.g., During the mining boom, ‘Dutch Disease’ resulted from Australia’s two-speed economy with strong growth & output in mining & slow output & growth in other sectors like tourism & manufactured goods.
Increased demand for Australia’s commodities increased demand for the Australian dollar causing AUD to appreciate.
While the mining sector thrived, other sectors struggled as appreciating AUD causes a lack of international competitiveness.
Output & growth fell in most sectors, but Aus’ GDP growth increased due to the mining industry’s high output.
Secondary Effects:
Increased Aggregate Demand (AD = C + I + G + (X – M):
→ An increase in the XPI (increase in the TOT) relative to the MPI also increases aggregate demand – caused by:
Increase in consumption (through higher incomes for households)
Increase in Investment (due to higher profit incentives in the mining sector)
Increase in net exports (since export values increase)
Increased National Income & Living Standards:
→ An increase in the TOT increases national income & living standards in Australia.
→ Higher profits from the mining sector & increased employment increases wages.
→ Living standards increase as the same volume of exports purchases a greater volume of imports.
→ Since 2020, Australia’s XPI caused an increase in real national income & increased Australia’s living standards.
Increased Government Revenue:
→ An increase in the TOT increases government revenue due to increased export receipts leading to increased company tax.
→ The increase in national income & employment results from a favourable terms of trade movement increases personal income tax payments to government.
→ The budget balance increases due to increased revenue.
Increased Inflation:
→ A favourable TOT can increase inflation.
→ A favourable terms of trade results in higher national income due to increased export receipts.
→ This has an expansionary effect on the domestic economy increasing the level of investment & spending putting pressure on prices (demand pull inflation).
Terms of Trade:
Trends in Australia’s Terms of Trade Over the Last Ten Years:
Trends in Australia’s Terms of Trade:
→ Australia’s TOT increased 1.7% from 89.4 in the September quarter 2024 to 91.0 in December 2024.
This is the first favourable movement in 2024
→ The TOT reached an all time high of 144.2 in the second quarter of 2022 & a decade low of 69.8 in the first quarter of 2016.
→ Overall, the decade trend has been favourable.
2014 – 2016: Decrease/Unfavourable Movement in the TOT:
Fall in the XPI: Decrease in Australian Export Prices due to;
→ Decrease in Commodity Prices: Large fall in the price of mineral commodities – a decrease in oil prices decreased demand for energy substitutes such as coal & LNG which are major Australian exports.
→ Increased Global Supply of Major Mineral & Energy Commodities: Increased investment in mining companies globally increasing output in the global market.
→ Decrease in Global Demand: Slow down in China’s Growth in industrial production., decreasing demand for commodities.
MPI was Stable with a Slight Increase due to:
→ Main changes caused by global volatile price movements:
E.g., In 2016 there was a large increase in US oil supply increasing global price of oil, as global supply exceeded demand.
2016 – 2022: Increase/Favourable movement in the TOT:
Increase in the XPI: Increase in the Price of Australia’s exports as a result of:
→ Increase in Commodity Prices: Energy commodity prices rose significantly reaching historical highs.
→ Decrease in Global Supply: Decrease in global supply of iron ore due to a dam collapse in Brazil & the Ukraine war resulting in sanctions against Russia.
The Ukraine war also contributed to supply issues globally for agricultural goods & supply chain issues that constrained trade flows.
→ Increased Global Demand for Iron Ore: High demand from China as they demand imports to be used in large infrastructure projects.
Slight Increase in the MPI: Increase in Import Prices due to;
→ High Oil Prices: In 2021/2022 the price of Oil was at its highest in more than a decade due to sanctions placed on Russia – the worlds second largest oil producer.
→ Rising Freight Costs: Imported consumer capital & intermediate goods faced higher transportation & production costs due to increased oil prices.
2022 – 2024: Decrease/Unfavourable Movement in the TOT:
Decrease in the XPI: Decrease in export prices due to;
→ Decrease in Commodity Prices: Commodity Prices have decreased including rural exports & iron ore.
→ Increased Global Supply:
Good growing conditions increased supply of agricultural goods, increase in the supply of commodities (i.e. lithium & coal).
Increase energy production taking advantage of higher prices.
→ Decrease in Global Demand: Weaker global demand due to geopolitical issues (e.g., Ukraine War, Middle East) & higher monetary policy slowing growth in China due to the China Property market slump.
Slight Fall in the MPI: As a result of:
→ Increase in Freight Costs: Reducing global demand has put pressure on freight supply raising shipping prices increasing the price of imports – increasing the MPI.
→ Decrease in Oil Prices: Fall in global demand particularly in China due to a slowdown in growth leading to a decline in global prices decreases the price of imports – decreasing the MPI.
Exchange Rates:
The Concept of an Exchange Rate, Including Australia’s Exchange Rate:
Exchange Rate Definition: The relative price of the Australian Dollar expressed in terms of another country’s currency (or in terms of the Trade Weighted Index), determined by supply & demand.
→ Exchange rates are necessary because exporting firms want to be paid in their own currency.
E.g., an Australian wheat farmer wants to be paid in Australian dollars for their produce.
→ The foreign exchange market is the market in which the currencies of different countries are bought & sold.
→ Importers (in the foreign market) must convert their domestic currency into AUD currency to make payment.
→ Foreign exchange turnover in Australia is currently around AUD$160Billion a day, meaning AUD$160Billion worth of AUD is converted every day into other currencies.
→ Since 1983 Australia has used a floating exchange rate system (where the exchange rate fluctuates).
This means price of the $AUD is decided by overseas currency buyers (demanders of $AUD) & local currency sellers (suppliers of $AUD).
→ In a fixed exchange rate (or pegged exchange rate), government determines the price of a country’s currency in terms of another’s currency.
E.g., before 1971 the $AUD was pegged to the Great British Pound at a rate of GBPD0.40 = AUD1.00
From 1971 it was pegged to the UAD until the AUD was floated in 1983 by the Hawke-Keating Government.
Calculating Exchange Rates Examples:
Assume 1AUD = 0.71 USD:
→ Calculate how much it would cost an Australian Citizen to purchase a computer from the US worth $2,000 USD:
$2000 / 0.71 = AUD$2816.90
→ Express the exchange rate in terms of the USD:
1 / 0.71 = AUD$1.41, therefore, USD1 = AUD1.41
→ State how much it would cost a US citizen to purchase a term of Australian education worth $3,000 AUD:
3,000 X 0.71 = USD$2,130
Exchange Rates:
The Concept of the Trade Weighted Index (TWI):
Trade Weighted Index Definition: Measures the Australian Dollar against a basket of 17 currencies of Australia’s main trading partners.
→ It reflects the global economic conditions & demonstrates the importance of our trading partners.
→ The Twi provides a broader measure of whether the Australian dollar is appreciating or depreciating against its trading partners currencies than frequently quoted bilateral exchange rates.
It is a better measure of general trends in the exchange rate.
Bilateral exchange rates tend to be more volatile whereas the TWI is often less volatile since the AUD is being compared to a basket of 17 currencies rather than just one.
Highest Weighted Trading Partners:
1. Chinese Renminbi
2. United States Dollar
3. Japanese Yen
4. European Euro
5. South Korean Won
Calculating the TWI:
→ Based on a weighted geometric average of a basket of currencies chosen to account for at least 90% of Australia’s two-way merchandise & services trade.
→ Base period for the TWI is May 1970 = 100.
→ Weights are updated annually, with the TWI spliced together at every period in which the weights change.
Exchange Rates:
The Determination of, and Movements In, the Exchange Rate Using the Demand & Supply Model:
→ A floating (varying/changing) or free exchange rate is one whose value is determined by the market forces of demand & supply.
→ Value of a country’s currency changes frequently.
→ The market rate depends on the demand for & supply of that currency in the foreign exchange (Fortex) market.
E.g.., When an Australian exporter sells their iron ore to a US importer, the Australian exporter will demand for Australian dollars.
→ When there is no intervention in the free market operations by government it’s a clean float.
→ When there is intervention in the free market operations by government or its agency the central bank (e.g., RBA), a dirty float existed.
Demand for Currency (Credits in the BOP):
The demand for AUD represents people who wish to buy AUD, the demand for currency is determined by credits in the BOP – meaning its concerned with:
→ Exports of goods & services
→ Receipts of income from overseas
→ Foreign investment inflows
Effect of a Change in Credits on the Exchange Rate:
1. Increase in Credits: Increase in demand for AUD, shifting the demand curve to the right, this causes AUD to appreciate.
2. Decrease in Credits: Decrease in demand for AUD, shifting the demand curve to the left, causing AUD to depreciate.
Supply of Currency (Debits in the BOP):
The supple of AUD represents all people who wish to sell AUD, the supply of currency is determined by debits in the BOP – meaning its concerned with:
→ Imports of goods & services
→ Payments of income overseas
→ Foreign investment outflows
Effect of a Change in Debits on the Exchange Rate:
1. Increase in Debits: Increase in supply of AUD shifting supply curve to the right, causes AUD to depreciate.
2. Decrease in Debits: Decrease in supply of AUD, shifting supply curve to the left, causing AUD to depreciate.
Models for an Appreciation of the AUD:
An appreciation is a rise in the value of the $AUD against other currencies, there are two ways to show an appreciation:
Demand Side (Increased Credits in the BOP):
An increase in credits in the BOP increases demand for AUD & an appreciation of the AUD - this occurs for three reasons:
1. Increased Demand for Australia’s Exports
2. Increase in Income Receipts from Overseas Residents/Firms
3. Increase in Foreign Investment Inflows into Australia
→ Diagram:
An increase in demand for AUD leads to a shift of the demand curve to the right from D1AUD to D2AUD.
This causes an increase in the Equilibrium price from 0.65USD to 0.67USD & an appreciation of the AUD.
Supply Side (Decreased Debits in the BOP):
A decrease in debits in the BOP decreases the supply of AUD causing an appreciation of AUD – This occurs for three reasons:
1. Decrease in the Demand for Australian Imports
2. Decrease in Income payments to Overseas Residents/Firms
3. Decrease in Foreign Investment Outflows to Foreign Countries
→ Diagram:
A decrease in supply of AUD leaves to a shift of the supply curve to the left from S1AUD to S2AUD.
This causes an increase in the equilibrium, price from 0.65USD to 0.67USD & an appreciation of the AUD.
Models for a Depreciation of the AUD:
A depreciation is a decrease in the value of the $AUD against other currencies, there are two ways to show a depreciation.
Demand Side (Decrease in Credits in the BOP):
A decrease in credits in the BOP decreases demand for AUD & a depreciation of the AUD – this occurs for three reasons:
1. Decreased Demand for Australia’s Exports.
2. Decrease in Income Receipts from Overseas Residents/Firms
3. Decrease in Foreign Investment Inflows to Australia
→ Diagram:
A decrease in demand for AUD leads to a shift of the demand curve from D1AUD left to D2AUD.
This causes a decrease in equilibrium price from USD0.65 to USD0.63 causing a depreciation of the AUD.
Supply Side (Increase in Debits in the Balance of Payments):
An increase in debits in the BOP increases the supply of AUD, causing a depreciation of the AUD – this occurs for three reasons:
1. Increase in the Demand for Australia’s Imports
2. Increase in Income Payments to Overseas Residents
3. Increase in Foreign Investment Outflows to Foreign Countries
→ Diagram:
An increase in supply of AUD leads to a shift of the supply curve to the right from S1AUD to S2AUD.
This Causes a decrease in the equilibrium price from USD0.65 to USD0.63 & a depreciation of AUD.
Simultaneous Shifts (Change in Demand & Supply for AUD):
Appreciation of the AUD:
→ Increase in Credits & Decrease in Debits in the BOP.
→ An increase in Credits will cause an increase in demand for the AUD & a decrease in Debits will cause a decrease in the supply of AUD.
→ This will result in an appreciation of the AUD.
→ Diagram:
An increase in demand for AUD causes a shift in demand right from D1AUD to D2AUD.
A decrease in supply of AUD causes a shift of the supply curve left from S1AUD to S2AUD.
This causes an increase in equilibrium price from USD 0.65 to USD 0.67 & an appreciation of the AUD.
Depreciation of the AUD:
→ Decrease in Credits & Increase in the BOP.
→ A decrease in credits causes a decrease in demand for the AUD & an increase in debits causes an increase in supply of the AUD.
→ This will result in a depreciation of the AUD.
→ Diagram:
A decrease in demand for AUD causes a shift in demand left from D1AUD to D2AUD.
An increase in supply of AUD causes a shift of the supply curve left from S1AUD to S2AUD.
This causes a decrease in equilibrium price from USD0.65 to USD0.63 & an depreciation of the AUD.
Exchange Rates:
Factors that Affect the Exchange Rate:
Simultaneous Shifts: Inflation, interest rate differential & Foreign Investment
Singular Shift: Global economic conditions, terms of trade/commodity prices & speculators (& expectations).
The following factors are explained to show an appreciation of the AUD, the opposite would cause a depreciation of the AUD
1. Inflation Rate Relative to Trading Partners – Simultaneous Shift
→ Demand for Australia’s exports is influenced by the degree of international competitiveness of domestic exports.
E.g., is Australia’s inflation rate is relatively low compared to its trading partners, exports are relatively cheaper & more attractive to foreign buyers.
→ A low inflation rate also improves the competitiveness of domestic producers competing with imports as domestically produced goods are relatively cheaper.
→ If Australia’s inflation rate is relatively low compared to its trading partners, there will be an increase in the demand for exports & a decrease in the demand for imports as domestic consumers purchase the cheaper Australian alternative.
→ DIAGRAM:
An increase in the demand for exports causes: Credits in the trade balance to increase.
This will increase the demand for AUD & cause a shift of the demand curve to the right from D1AUD to D2AUD.
A decrease in the demand for imports causes: Debits in the trade balance to decrease.
This will decrease the supply of AUD & cause a shift of the supply curve to the left from S1AUD to S2AUD.
This causes an increase in the equilibrium price from USD0.65 to USD0.67 & an appreciation of the AUD.
2. Interest Rate Differential Relative to Overseas Competitors – Simultaneous Shift
→ The interest Rate Differential is the difference in interest rates between one country to another.
→ The interest rates reflect the return on financial assets.
→ This means the level of capital inflow is affected by the level of Australia’s interest rates as well as the level of confidence in the Australian economy.
→ If Australia’s interest rates rise relative to foreign interest rates, then the Australian interest rate differential increases.
→ The higher the interest rate differential the greater the demand for Australian assets.
→ Relatively higher interest rates compared to overseas competitors causes an increase in the interest rate differential & makes Australian assets more attractive to foreign investors.
→ At the same time, it makes overseas investment for Australians less attractive as they get a higher rate of return domestically.
→ If Australia has a relatively higher interest rate compared to its overseas competitors, there will be an increase in foreign investment inflows (due to a higher rate of return for foreign investors investing into Australia) & a decrease in foreign investment outflows (as Aus investors will invest domestically due to a higher rate of return).
→ Diagram:
An increase in foreign investment inflow causes: an increase in credits in direct portfolio &/or other investment in the financial account.
This will increase the demand for AUD & cause a shift of the demand curve to the right from D1AUD to D2AUD.
A decrease in foreign investment outflows causes: A decrease in debits in direct portfolio &/or other investment in the financial account.
This will decrease the supply of AUD & cause a shift of the supply curve to the left from S1AUD to S2AUD.
This causes an increase in equilibrium price from US0.65 to US0.67 & an appreciation of the AUD.
3. Foreign Investment – Simultaneous Shift
→ Foreign investor confidence in Australia & expectations about the performance of the Australian economy will influence investment decisions.
→ Political stability is an example of the fundamental strength of the Australian economy & acts as incentives for foreign investment.
→ This increases capital inflow into Australia & less Australians invest overseas.
→ If foreign investor confidence in the Australian economy increases there is an increase in foreign investment inflows & a decrease in foreign investment outflows.
→ DIAGRAM:
An increase in foreign investment inflows causes: An increase in credits in direct, portfolio &/or other investment.
This will increase the demand for AUD & cause a shift of the demand curve to the right from D1AUD to D2AUD.
A decrease in foreign investment outflows causes: A decrease in debits in direct, portfolio &/or other investment.
This will decrease the supply of AUD & cause a shift of the supply curve to the left from S1AUD to S2AUD.
This causes an increase in the equilibrium price from USD0.65 to USD0.67 & an appreciation of the AUD.
4. Global Economic Conditions – Singular Shifts
→ The demand for Australian commodity exports is highly dependent on the level of income of our trading partners such as China & Japan.
→ When world economic activities increase (i.e., increased economic growth in trading partners countries), this results in an increase in demand for Australian exports (credits) particularly Australian commodities such as iron ore & coal.
→ An increase in world economic activities/growth will increase demand for Australian exports:
→ DIAGRAM:
An increase in the demand for exports causes: An increase in credits in the trade balance.
This increases the demand for AUD & cause a shift of the demand curve to the right from D1AUD to D2AUD.
This causes an increase in the equilibrium price from USD0.65 to USD0.67 & an appreciation of the AUD.
5. Terms of Trade/Commodity Prices – Singular Shifts
→ If the price for Australia’s exports rises by a greater rate than that of its imports, there has been a favourable movement in Australia’s terms of trade.
→ An increase in the TOT shows a greater demand for Australian exports & results in rising revenues from exports.
→ A favourable movement in the TOT or an increase in commodity prices increases the value of Australia’s exports.
→ DIAGRAM:
An increase in the value of exports causes: An increase in credits in the Trade Balance.
This will increase the demand for AUD & cause a shift of the demand curve to the right from D1AUD to D2AUD.
This causes an increase in the equilibrium price from USD0.65 to US0.67 & an appreciation of the AUD.
6. Speculators – Singular Shifts
→ ONLY USE AS A FACTOR IF REQUESTED
→ The majority of foreign currency purchases & sold is done by speculators, buying & selling currencies, with the aim of making relatively short-term gains.
→ If speculators think the AUD will appreciate, they will buy the currency & increase the demand of AUD causing an appreciation of the AUD.
→ If speculators think the AUD will depreciate they will sell the currency & increase the supply of the AUD causing a depreciation of the AUD.
→ If speculators expect the AUD to appreciate they will buy the currency.
→ DIAGRAM:
Speculators purchasing currency causes: Demand for currency to increase.
This will increase the demand for AUD & cause a shift of the demand curve to the right from D1AUD to D2AUD.
This cases an increase in the equilibrium price from USD0.65 to USD0.67 & an appreciation of the AUD.