Introduction to confidence intervals
1/14
There's no tags or description
Looks like no tags are added yet.
Name | Mastery | Learn | Test | Matching | Spaced | Call with Kai |
|---|
No analytics yet
Send a link to your students to track their progress
15 Terms
what are confidence intervals and margins of error good for?
vitally important to interpreting political polls and surveys
key toold in inferential stats. for relating stats about our sample to the population of interest
confidence intervals
margin of error
confidence levels
margin of error
the degree of uncertainty around the relationship of our sample mean to the population mean, due to random sampling error.
how is the margin of error expressed as?
as a range of values below or above the sample mean
confidence level
percentage that indicates how confident we are that a population parameter lies within a specified margin of error
for example, a 95% confidence level means that if we are conducting the sample survey 100 times, we would expect the true population value to fall within the margin of error in 95 of those surveys
what happens to the margin of error when analyzing subgroups in polls?
the margin of error for subgroups is larger due to smaller sample sizes, leading to less precision in estimates
T/F: you need to check for the normla distribution of your data before consstructive the margin of error
TRUE: these stats are built on an assumption of normality
(if the data is not normally distributed, the results will be innacurate)
3 reasons to undertand the steps when calculating the margin of error
to make informed decisions about the trade-offs for different confidence levels given your sample size and desired precision of esetimate
to accurately interpret the stats and identify any errors in their calculation and application to your study
even using excel’s “confidence.t” function to calculate confidence intervals will require you to enter the alpha level, standard deviation, and sample size into the function (GOOGLE SHEETS ODES NOT INCLUDE THIS FUNCTION)
2 key stats to calculate the margin of error
critical value
standard error
critical value
a test statistic that translates your chosen confidence level into a standardized score marking the difference from the sample mean to that level of probability
what do you need to know to find t-score critical value?
degrees of freedom
alpha leve and critical probability
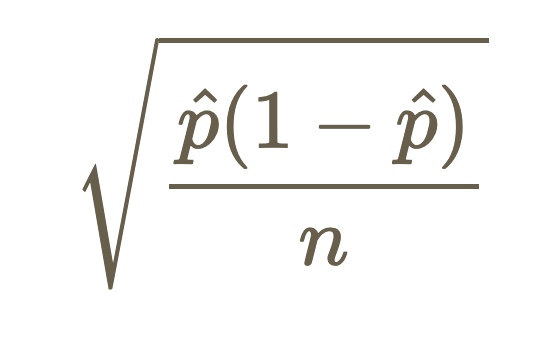
standard error of sample proportions
no meeaningful mean (categorical data)
estimate of the standard error called Standard error of sample proportion
formula for the standard error of sample proportion
Margin of error = ________ * _________
Margin of error = Critical value * standard error of proportion