Fourier Transforms and Spectroscopy
1/21
There's no tags or description
Looks like no tags are added yet.
Name | Mastery | Learn | Test | Matching | Spaced | Call with Kai |
|---|
No analytics yet
Send a link to your students to track their progress
22 Terms
Signal to Noise ratio
General goal getting the ratio as large as possible
Or achieve equal S/N in less time
Fellget Advantage
Two Experiments to Lower S/N
Can get signal by getting peak height or area, and get the noise by getting flat section of baseline and take the standard deviation and get the noise.
The sum of the two peaks creates a peak that is twice as big due to constructive interference and the noise < double the noise whereas the signal is doubled, running the experiment twice causes the time to take twice as long.
Achieve the same improvement in S/N without increasing time
Need to increase the amount of data we collect in a fixed-time interval: achieve a greater flow rate of useful data. → multiplex
Fellget/Multiplex Advantage
This improves the S/N by a factor of sqrtN → is number of repetitions (objects being weighed at once)
Fellgets advantage is only realized for noise sources that are detector limited rather than source limited
Detector Limited
function of the equipment being used, and independent of the sample and it’s size
Source Limited
function of the sample and it’s size
Multiplex Weighing
Means weighing multiple objects at once, which means that the mass on the pan is higher.
If the uncertainty of the weighing procedure gets larger with the mass increase, you nullify your Fellgett’s advantage
Not really an issue with the balance
Infrared Spectrophotometry
Light→ monochromator→ sample → detector→ data system
Fourier Transform Infrared Spectrophotometry
Beam is made out of KBr
Impact of this: Thrown out 50% of our incoming beam intensity
Starting position is the Beam Stop, translates to the ZPD, then reverses and moves back to the Beam Stop
Old Way
-scan the monochromator from 4000 cm-1 to 600 cm-1, collecting an analog stream of %T data as the instrument scanned cm-1
Took 2-3 mins
Revising the Old Method
Involved in a single data point at a time in series
Need to multiplex (increase flow of information) to achieve Fellgets advantage
How? Remove monochromator and work with all the wavelengths of light at once
major multiplexing, so no linearly independent equations
Have a spectrum that consists of one data point
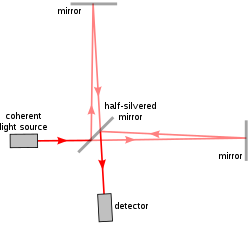
Zero Path Difference
At this point, the moving mirror is equidistant from the beam splitter compared to the fixed mirror
At ZPD, 2 beams are split by the beam splitter, travel equal distances to the mirrors and back, and are recombined to go to the detector
Since the paths are exactly the same, the light waves are exactly in phase
The position of ZPD +/- ¼ wavelength varies with every different wavelengthFrequency Do
Interferogram
Output of the summed light beams as the mirror moves
Frequency Domian
signal gathered when plotting cm-1 on the X axis in IR
Interferogram
Is not an IR spectrum, but it contains all the information to produce one
Since the translating mirror moves at a constant rate, the X axis is equivalent to time (time domain signal)
Fourier transform Algorithm
Best results, sum together the multiple scans as interferograms, then take the FT of the sum at the end, to get good data for the multi-scan, the interferometer must be able to reproduce exactly the movement of the translating mirror - speed and pathlength
To ensure reproducibility, a He-Ne laser is bounced off the moving mirror to allow precise monitoring of its movement
FT application (chemometric methods)
Smoothing of noisy data - common for chromatography
“Boxcar” averaging: averages multiple points in a certain data set (11 points) eliminated high frequency noise
Smoothing with FT
Takes advantage of the fact that most analytical signals are low-frequency effects
Bulk of noise is high frequency variety
Transition Point
(vertical line from a multiplier 1 to 0) is referred to as the frequency cutoff
Low frequency bandpath
lets low frequencies pass, meaning the high frequencies are filtered out
How to do smoothing
Take the noisy data set, apply FT algorithm
Converts time domain to the frequency domain, draws resultant trace
Take the post FT trace, and apply a low frequency bandpass filter
Normally this is an optical piece or an electronic circuit, but in this case with the algorithm a digital filter
The FT data is multiplied by the digital filter and then inverse FT algorithm is applied, converts back to the time domain