Principles of Analytical Techniques Used in Clinical Laboratories
1/45
Earn XP
Description and Tags
Both part 1 & 2 lectures, Notes, Definitions, Concepts, Must KNOW
Name | Mastery | Learn | Test | Matching | Spaced |
|---|
No study sessions yet.
46 Terms
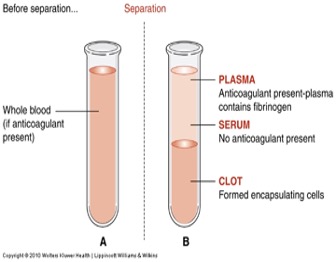
Types of Samples for Chemical Analysis
Whole Blood -- Cells and liquid not separated.
Serum -- Centrifuged liquid from clotted blood
Plasma -- Centrifuged liquid from anticoagulated blood.
Urine -- Random vs. timed (usually 24 hrs)
Other Fluids – Cerebrospinal fluid (CSF), Amniotic fluid, saliva etc
Gold vs Red Blood Collection Tubes
Gold tubes contain a gel separator to allow for serum separation, while red tubes do not contain any additives and are used for serum collection without separation.
When are red tops preferred over gold?
collection of certain hydrophilic hormones that can attach to the surface of the gel in gold tubes. This adherence can lead to inaccurate results due to low hormone counts.
important in drug monitoring, where precise measurements and volumes are critical for effective treatment.
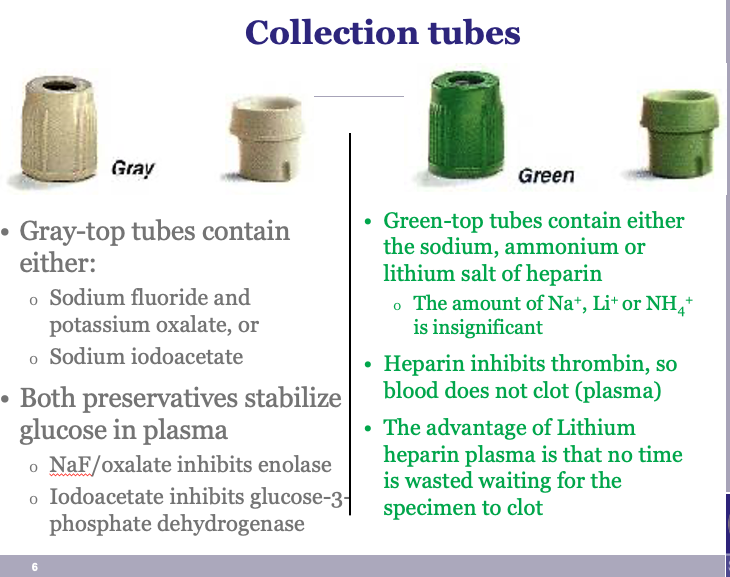
Gray vs.Green Blood Collection Tubes
Gray tubes contain sodium fluoride, which acts as a glycolytic inhibitor to preserve glucose levels in the sample, making them ideal for glucose testing and may also contain potassium oxalate as an anticoagulant.
Green tubes contain heparin, which is used as an anticoagulant to prevent blood clotting and facilitate plasma collection. Green tubes are commonly used for tests that require plasma, such as certain chemistry tests (CMP, BMP, etc.) due to their rapid ability to separate plasma from blood cells.
Gray and Green Top Similarities
Both gray and green tubes preserve sample integrity (glucose) and preventing clotting (plasma).
Why is a green top used instead of gray when dealing with lactic acid? Give an example
A green top is used for lactic acid testing because it contains heparin, preventing blood clotting and maintaining the integrity of lactate levels.
Ex: In sepsis patients, accurate lactate measurements are used to assess the severity of the condition. Gray tops, which contain sodium fluoride, are not used because they can inhibit glycolysis and falsely lower lactate levels, leading to inaccurate results
Lavender vs Royal Blue Blood Collection Tubes
Lavender tubes contain EDTA as an anticoagulant, commonly used for complete blood counts (CBC) and blood smears. Royal blue tubes can contain either no additive or EDTA, and are often used for trace element testing and toxicology.
How could a green top tube contaminate a lavender or royal blue tube?
ORDER of DRAW: A green top tube could contaminate a lavender or royal blue tube if heparin from the green tube mixes with the blood sample in the other tubes, potentially affecting test results by introducing anticoagulant effects that alter coagulation profiles or trace element measurements.
Main Variables Affecting Select Chemistry Analytes:
Diurnal Variation
Stress
Require ICE (immediate cooling)
Hemolysis
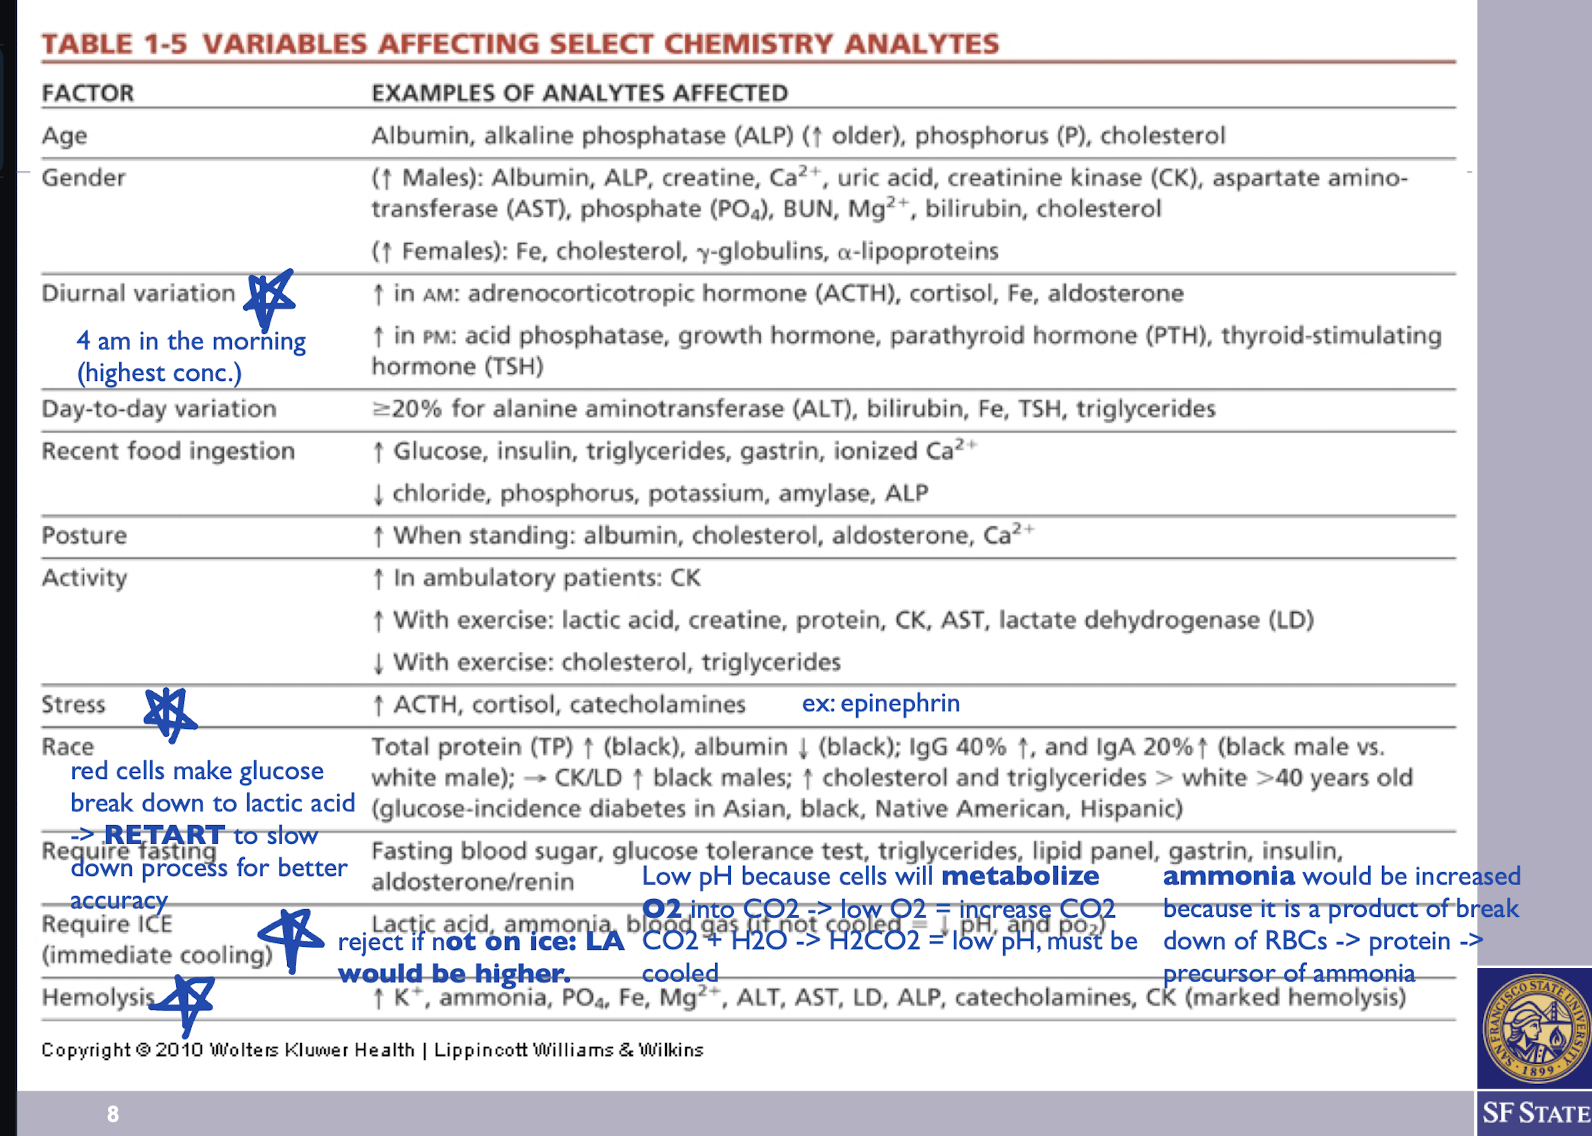
Diurnal Variation
Increase in AM: adrenocorticotropic hormone (ACTH), cortisol, Fe, aldosterone
4 am in the morning (highest levels)
Increase in PM: acid phosphatase, growth hormone, parathyroid hormone (PTH), thyroid-stimulating hormone (TSH)
Stress
Increased ATCH, cortisol, catecholamines. Ex: epinephrin and norepinephrine levels, which can impact various physiological responses and laboratory test results.
Require ICE (immediate cooling)
Lactic acid, ammonia, blood gas (if not cooled = decreased pH and po2) tests that require immediate cooling to preserve sample integrity and prevent metabolic changes.
What happens to Lactic Acid levels when test is not done on ICE?
When lactic acid testing is not conducted on ICE, RBCs continue to metabolize glucose, leading to the production of additional lactic acid. If the sample is not immediately cooled, it is rejected due to the likely elevation in lactic acid levels
Why does pH lower when the sample is not cooled?
cells metabolize O2 into CO2, resulting in low levels of O2 and increased levels of CO2. The reaction CO2 + H2O forms carbonic acid (H2CO3), leading to a decrease in pH.
Why does ammonia increase when the sample is not cooled?
when samples are not cooled because RBC breakdown continues, leading to protein catabolism, which produces ammonia as a byproduct of this metabolic process.
What are the differences in reference and critical ranges
Reference ranges are the values typically expected in a healthy population, while critical ranges indicate values that are life-threatening and require immediate medical intervention.
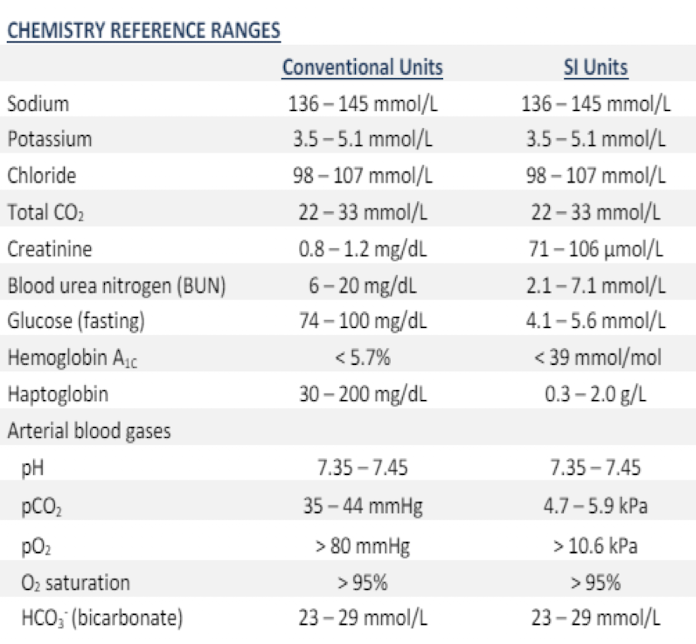
Chemistry Reference Ranges: pt 1
Sodium
Potassium
Chloride
Total CO2
Creatinine
Blood Urea Nitrogen (BUN)
Glucose (fasting)
Hemoglobin
Haptoglobin
Conventional Units:
Sodium: 136-145 mmol/L
Potassium: 3.5-5.0 mmol/L
Chloride: 98-107 mmol/L
Total CO2: 22-33 mmol/L
Creatinine: 0.8-1.2 mg/dL
Blood Urea Nitrogen (BUN): 6-20 mg/dL
Glucose (fasting): 74-100 mg/dL
Hemoglobin: < 5.7%
Haptoglobin: 30-200 mg/dL
Chemistry Reference Ranges: pt 2
Arterial blood gasses
pH
pCO2
pO2
O2 saturation
HCO3 (bicarbonate)
Conventional Units:
Arterial blood gasses
pH: 7.35-7.45
pCO2: 35-45 mmHg
pO2: >80 mmHg
O2 saturation: 95-100%
HCO3 (bicarbonate): 23-29 mmol/L
Properties of Light
Reflection
Absorption
Transmission
Relationship between absorption of light and concentration vs Relationship between log %T and concentration
According to Beer-Lambert Law, as the concentration of a substance increases, the absorption of light increases proportionally/directly. Conversely, there is an inverse logarithmic relationship between transmittance (%T) and concentration, where higher concentrations result in lower %T.
Reflection vs Transmission in relation to concentration measurements
Transmission:
Higher sample conc, leads to increased light absorption, resulting in less transmitted light.
Based on Beer's Law: absorbance is directly proportional to concentration.
Example: ELISA tests measure transmitted light to determine analyte concentration.
Reflection:
Non-absorbed light may be scattered or reflected by sample particles.
High scattering can interfere with readings, making concentrations appear lower.
Example: Turbidimetric and nephelometric assays measure light scattered to assess protein concentrations.
Spectrophotometry vs Photometry
Spectrophotometry involves measuring the amount of light absorbed by a sample, while photometry measures the intensity of light emitted or transmitted. Both techniques are essential for determining concentration in clinical analyses, but spectrometry is more commonly used for analyzing specific wavelengths.
Urine Dipstick Photometry Example
A method using urine dipsticks to measure analyte concentrations based on color changes, often indicating the presence of substances like glucose or proteins.
Spectrophotometry based on two principles
These principles are summarized by Beer’s Law
substances absorb light at unique wavelengths
the amount of light absorbed is proportional to the amount substance that is present.
Beer’s Law: A= εbc
A = Absorbance
c = concentration in moles/L
b = length of light path through sol’n in cm (width of cuvet)
ε = a = proportionality constant in L/mol.cm
(extinction coefficient or molar absorptivity, ε )
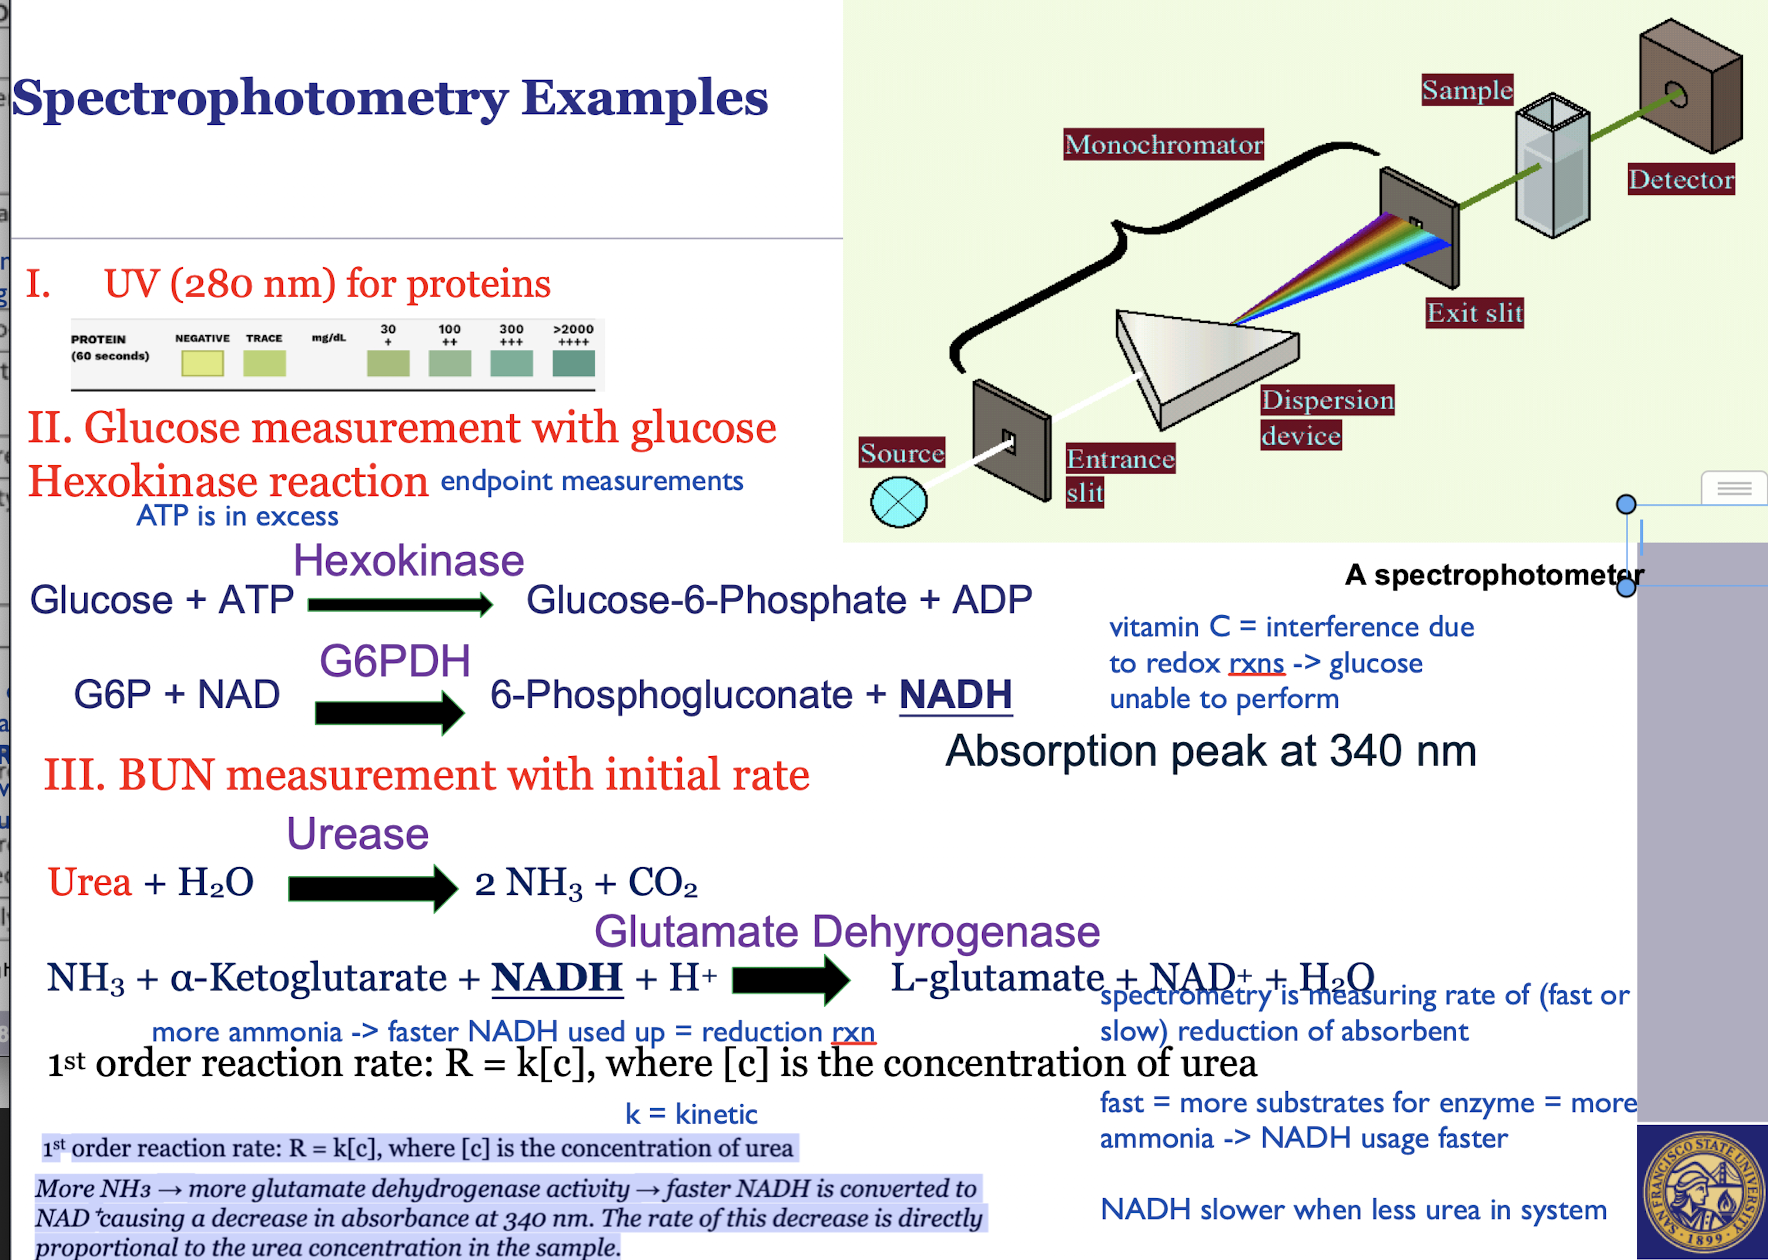
Spectrophotometry: Method
Colorimetric - Ex: urine dipstick tests
Endpoint - Ex: measuring blood glucose using hexokinase methods
Initial Rate - Ex: BUN measurement
Spectrophotometry: Measurements
Colorimetric: Directly measures the intensity of color in a solution, which is proportional to the concentration of the analyte
Endpoint: Measures the final product of a chemical reaction after it has gone to completion
Initial Rate: The rate of a reaction at its beginning is proportional to the concentration of the analyte
Spectrophotometry: Advantages
Colorimetric: Fastest and Easiest
Endpoint: Easier to blank for interferences and allows times for interfering rxns to be completing
Initial Rate: Easiest to blank, faster than endpoint and can be highly specific if the initial rate is measured before interfering reactions become significant
Spectrophotometry: Disadvantages
Colorimetric: Hard to blank or control for unknown interferences
protein affecting bilirubin -> results incorrect (ex: if urine is orange)
Endpoint: Need to wait for rxns to finish
slower, ex: for glucose measuring
Initial Rate: Need to delicately control for variables like temperature and timing
enzymes
Spectrophotometry Examples
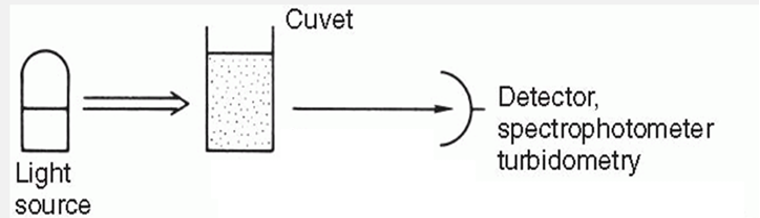
Turbidity (Turbidimetry)
Measures particulate matter concentration in a sample using a spectrophotometer
Reduces light intensity as it passes through sample.
Measures reduction in incident light due to scattering, absorbance, reflectance.
Light scatter amount is proportional to insoluble particle concentration.
Light blockage varies with particle concentration and size.
Effective for measuring large products (e.g., proteins, immunoglobulins).
Measured at 180 degrees from the incident beam.
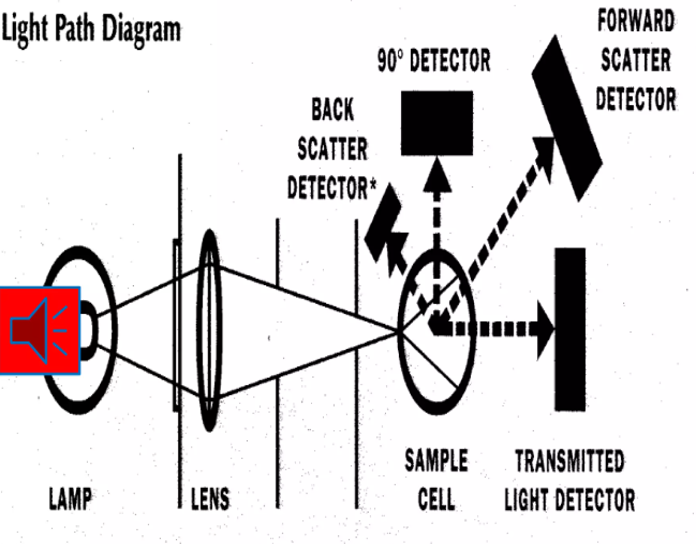
Nephelometry
Measures light scatter at 90 degrees to the incident beam.
Common instruments measure scattered light at right angles.
Light scatter amount is directly proportional to insoluble particle concentration.
Factors affecting scatter: wavelength and particle size.
Sensitive to small particles like microalbumin and ceruloplasmin.
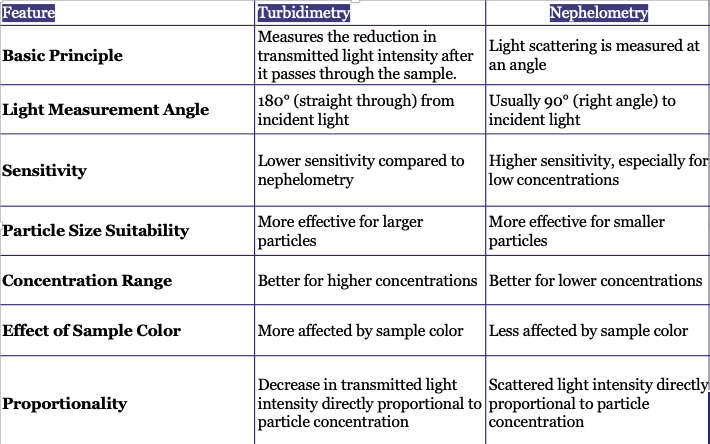
Nephelometry and Turbidity Key Similarities
Both nephelometry and turbidimetry measure particle concentrations in solutions by analyzing light interactions with the sample, with turbidimetry being used for common assays and nephelometry focused on microalbumin and specific plasma proteins.
Nephelometry and Turbidity Limitations
Pre-Analytical factors
Avoid lipemic, hemolyzed, or contaminated specimens.
proper centrifugation to prevent interference.
Use clean cuvettes free of scratches or residues.
Nephelometry and Turbidity Key Differences
Nephelometry measures scattered light at a specific angle, while turbidimetry measures the intensity of transmitted light. Nephelometry is more sensitive to small particles, whereas turbidimetry is less specific.
Fluorometry
A technique that measures light emitted from a sample after absorption, with fluorescence absorbed at one wavelength and emitted at a longer wavelength. often used in flow cytometry to analyze cell size and granularity
Chromatography
molecules in mixture applied onto the surface or into the solid, and fluid stationary phase (stable phase) is separating from each other while moving with the aid of a mobile phase.
Ex: HLPC - ion exchange column used to separate hemoglobin & confirmatory urine drug testing
Disadvantage: requires extensive sample preparation and can be time-consuming.
Electrophoresis
Migration or separation of charged compounds based on electric charge.
Charged particles move toward oppositely charged electrodes.
Used for separating serum proteins, identifying variant hemoglobins, detecting monoclonal gammopathies, and analyzing CSF proteins.
Disadvantage: Chemicals must be separated based on their differential physical characteristics.
Mass Spectrometry
Analytical technique for determining molecular weight and structural info.
Analyzes peptides, proteins, and post-translational modifications.
MALDI-TOF improves accessibility in clinical labs.
High sensitivity and specificity for microorganism identification.
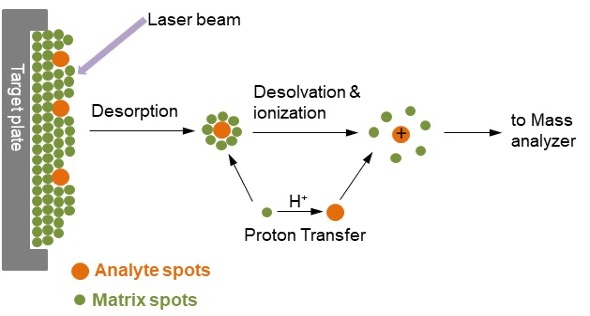
Mass Spectrometry Process
Sample analyte mixed with matrix material.
Laser strikes the mixture, causing vaporization (desorption).
Vaporized molecules become charged through proton transfer.
Mass analyzer separates charged ions by mass-to-charge ratio.
Application: Beer’s Law
Conc. and Abs. of calibrator is known, Abs. of the unk. is obtained by spectrophotometry and conc.is calculated.
[A(unknown)/ A(calibrator)] = [C(unknown)/C(calibrator)]
Monochromator Filter: Complementary Colors
In spectrophotometry, complementary colors are pairs that produce white light when combined. A monochromator filter isolates specific wavelengths, enhancing analysis of chromagens' absorbance.
Bichromatic Analysis
This method splits a light beam into two wavelengths: one at the peak absorption of the analyte and another at a wavelength that is not absorbed by the analyte but absorbed by an interfering chromogen. The second wavelength's absorption is subtracted from the first to determine the analyte concentration.
Ex: Hemoglobin and Bilirubin
Bichromatic Analysis Calculation
Corrected Absorbance=Aλ1−Aλ2
Where:
Aλ1 is the absorbance at the primary wavelength (where the analyte has maximum absorption).
Aλ2 is the absorbance at the secondary wavelength (where the analyte has minimal absorption but interfering substances absorb significantly)
Bichromatic Analysis Example
Hemoglobin from hemolysis interferes with bilirubin measurement by absorbing light at the same wavelengths. At 460nm (A₄₆₀ = 0.65), both bilirubin and hemoglobin are measured. At 522nm (A₅₂₂ = 0.35), hemoglobin's interference is assessed.
Corrected Absorbance is calculated as A₄₆₀ − A₅₂₂ = 0.30.
When and Why do we use a serum blank for bichromic analysis?
Serum blank can serve the purpose of second λ
Helps account for sample-specific interference
More accurate than water blanks for complex samples
When to Use Serum Blanks: Lipemic samples, hemolyzed, icteric