5.5 Break-even analysis
1/47
There's no tags or description
Looks like no tags are added yet.
Name | Mastery | Learn | Test | Matching | Spaced | Call with Kai |
|---|
No analytics yet
Send a link to your students to track their progress
48 Terms
Contribution
The sum of money that remains after all direct / variable costs have been deducted from sales revenue of a product
The surplus contributs to paing fixed costs
Contribution per unit
Difference betw selling price of a product and its variable costs of production
Aka proportion of SP per unit that goes towards paying FC
Contribution per unit formula
P - AVC
Total contribution
Surplus after all VC have been deduced from revenue, that is used to cover fixed costs
FC / unit contribution (double check)
Quantity of output needed to go towards paying off total fixed costs
Total contribution formula
(P-AVC) X Q
Aka GP for a product
Formula for contribution per unit vs added value
CPU = P - AVC
VA PU = P - ATC
What is used to pay a firms fixed costs?
Positive difference betw SP - AVC
Profit
Positive difference betw TR - TC
On BE chart: all levels of output beyond BEQ
Profit formula
Total contribution - TFC
TR - total costs
Simple- how to increase profit?
Increase revenue (via sales volume or price) → raises total contribution
Reduce VC
Reduce FC
Break-even analysis
Quantitative decision making-tool
Used to calc the level of sales needed to cover all COP
Any sales beyond BEP generate a positive safety margin, hence profit for the business
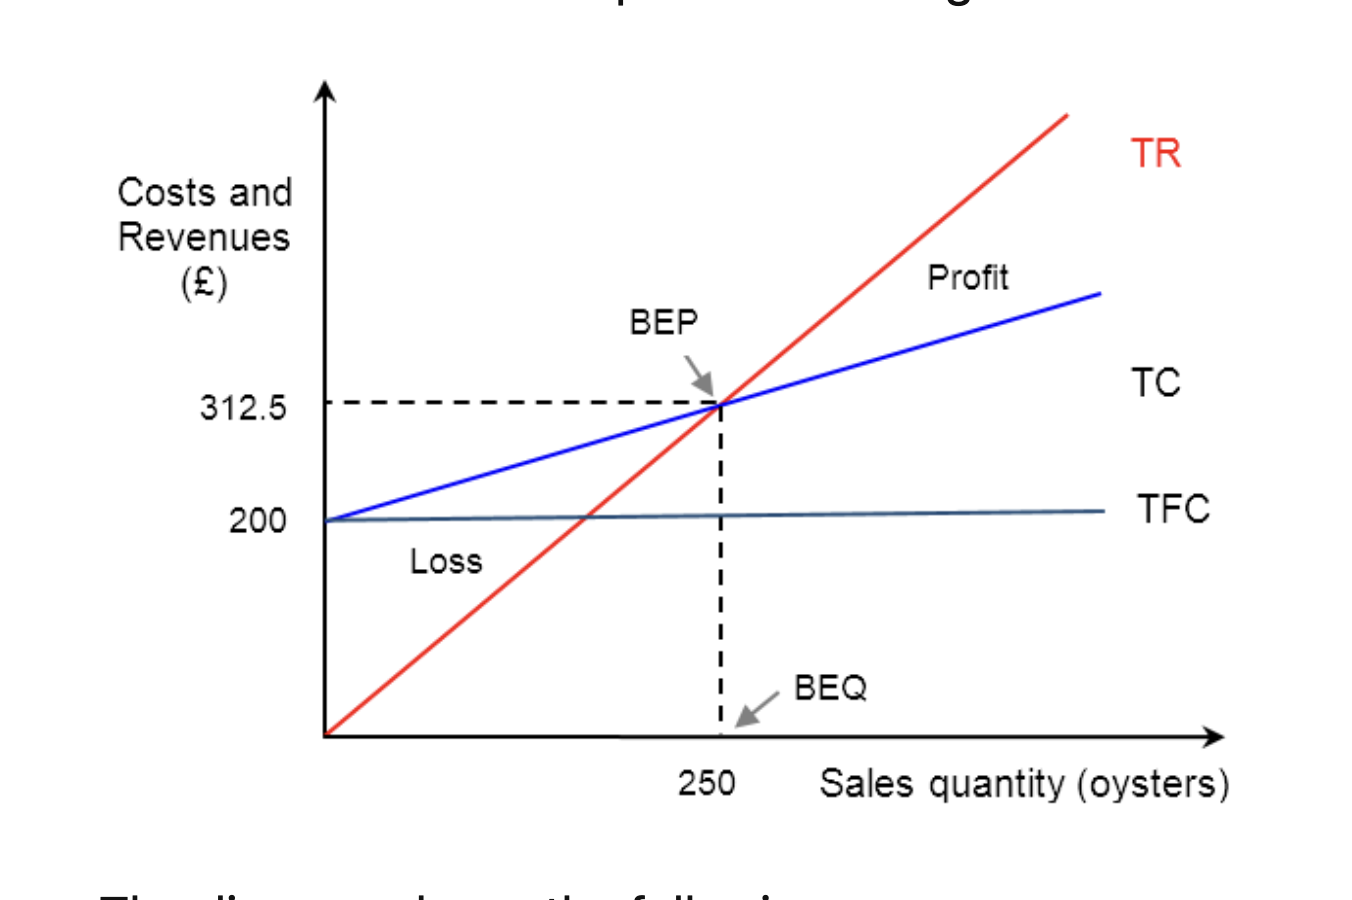
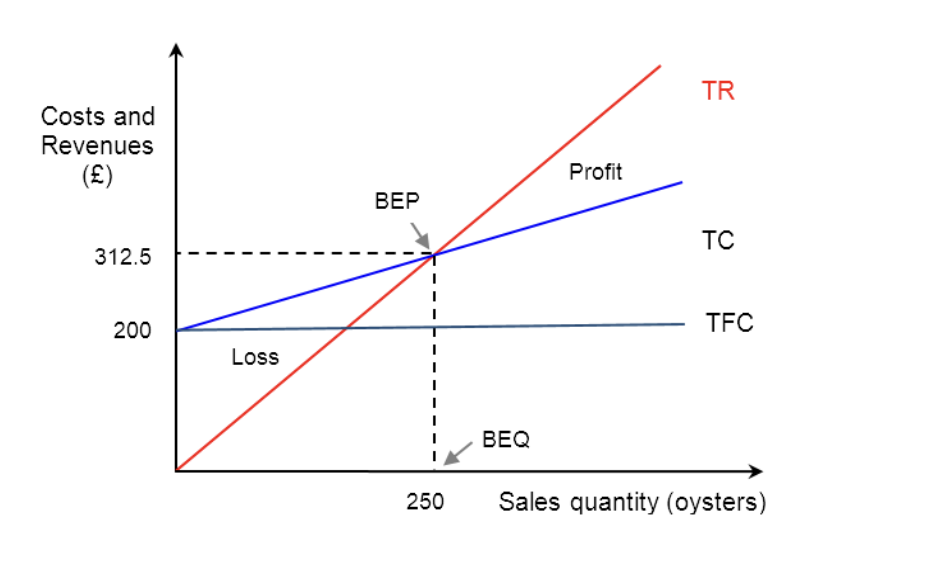
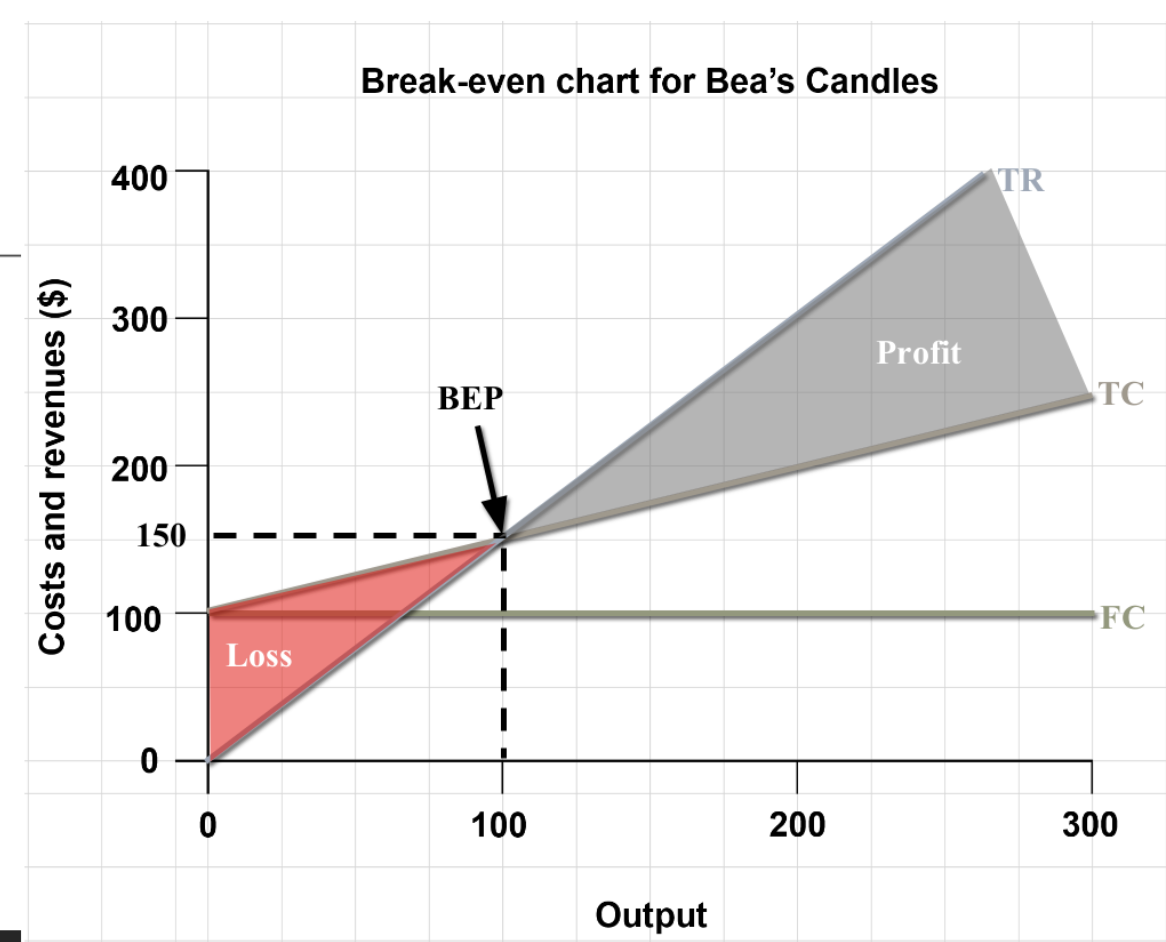
Break-even chart
Represents firms costs, revenues, profits (or loss) at various levels of output
3 diff financial situations a firm can be in (relating to BE)
Loss- TC > TR
Break-even- TR = TC
Profit- TR > TC
Purpose of contribution analysis
Determine pricing strategies
Prioritise products in their portfolio
Decide whether to make / buy in products
Perform BE analysis
Break even
When a firm’s sales revenues cover all of its production costs
When a firm makes neither a profit nor a loss
TR = TC
Break-even point
Position of BE chart where TC line intersects TR line
TR = TC
Break-even quantity
Sales vol needed for a firm to reach
BEQ = FC / (P – AVC)
What does BE analysis inform managers?
hether a product is financially worthwhile to produce.
How much profit can be earned if the business idea goes to plan.
3 methods to determine BE point
Unit contribution method
TR = TC method
Draw + interpret BE chart
Unit contribution method to calculate BE point
BEQ = TFC / contribution per unit
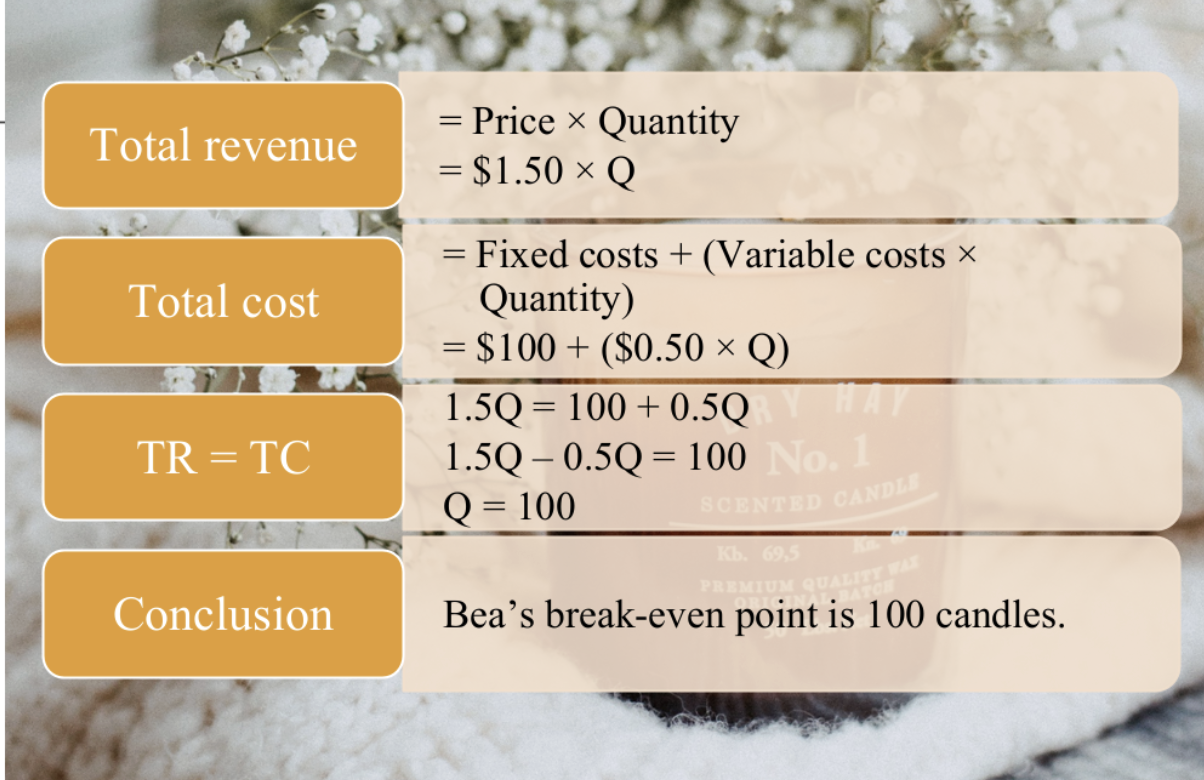
TR = TC method to calculate BE point
Work out TR and TC
Equate them
Sub in values
Solve for Q
TR = TC
P x Q = TFC + TVC
30Q = 3500 + 10Q
20Q = 3500
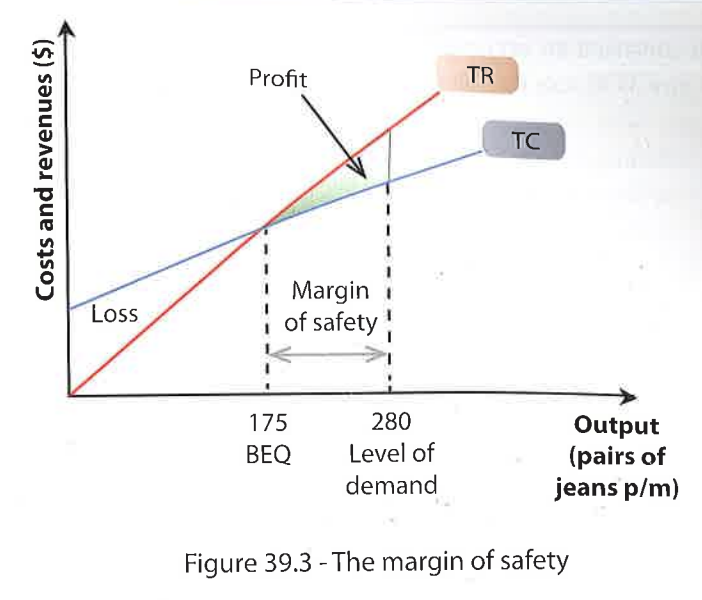
BEQ = 175 jeans
BE chart method to calculate BE point
Draw BEC
Level of output on x axis at BEP
Loss
When firms TC > TR
At all levels of output below BEQ
Break even chart
Which businesses is BE analysis especially useful for?
Business that:
Produce / sell 1, standardized product
Operate in 1 market
Make products to order → all output sold
Margin of safety (MOS)
Numerical difference betw firms actual sales quantity and its BE quantity
Positive MOS → firms can reduce output by that amt w/o making a loss
V high positive MOS → reduce risk if adverse conditions
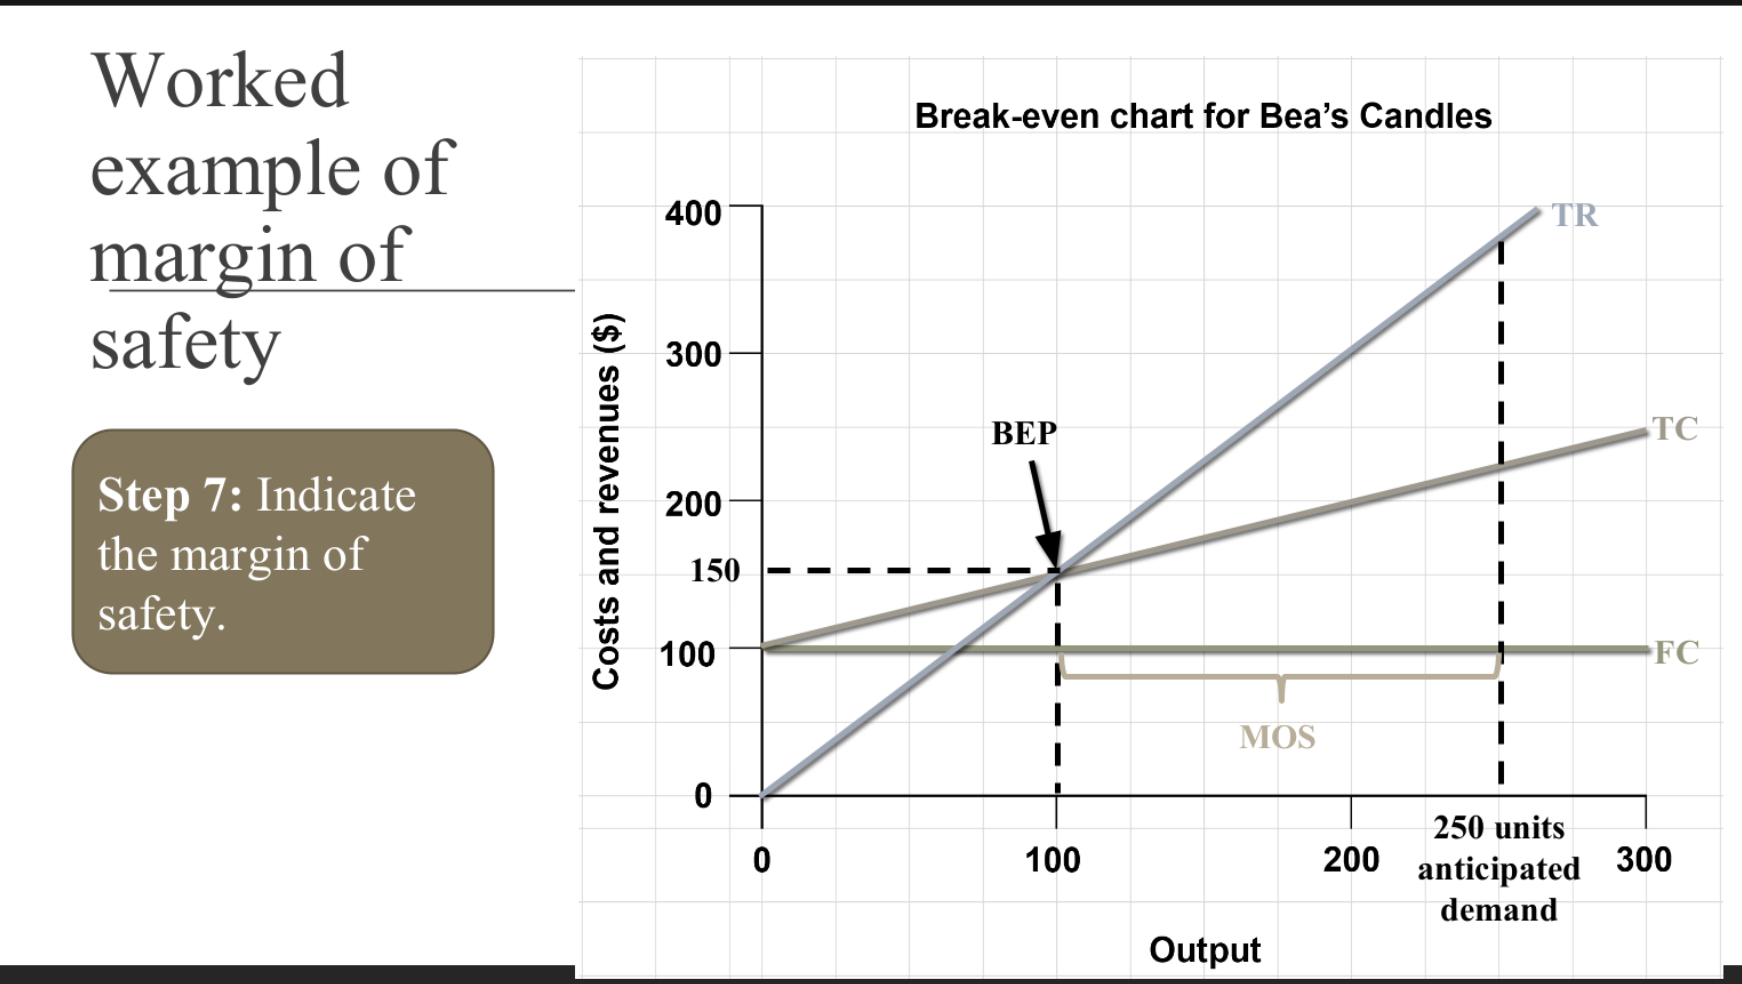
Margin of safety formula
Actual sales quantity - BE quantity
MOS units
The unit of output (ie jeans)
NOT monetary
How to draw a BE chart?
Optional- draw TFC line (horizontal)
Draw TC line (starts at same level as TFC)
Draw TR line (starts at 0)
Label x axis- output (rings per month)
Label y axis- costs AND revenue (give specific currency)
Title
What happens if BE quantity is a decimal?
Always round up
Target profit
Amt of profit (surplus) a firm intends to achieve, in a given time period
Expected SR = TC
Target profit output
The quantity of sales required to reach the firm’s target profit
Target profit output formula
(FC + Target profit) / contribution per unit
How to manually work out target profit output?
Target profit = TR - TC
Target profit = (target price x Q) - TFC - TVC
Solve for Q
Target price
Price set by a firm in order to reach BE Q or certain target profit
Amt customers need to pay per unit, in order for firm to BE or reach target profit
BE revenue
Value of the output needed to break-even
When does a firm generate a profit / loss on BE chart?
Profit- output beyond BEP
Loss- output below BEP
Effect of increase in selling price on firms BE quantity + on chart
Reduces firms BEQ
Greater gradient (steeper) of TR line (1 → 2)
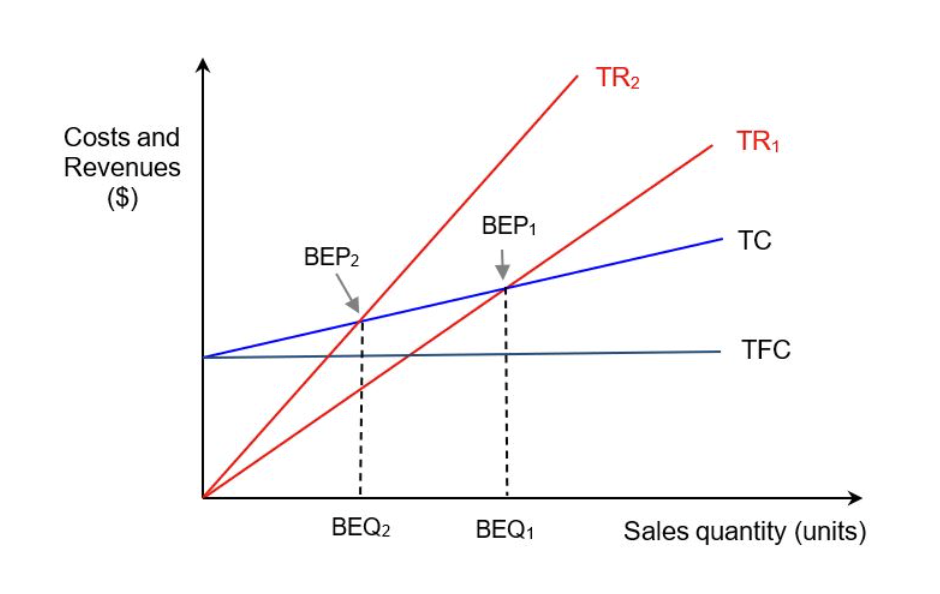
Effect of higher selling price on MOS
Increases MOS (because the firm BEs earlier)
Assumption: inelastic demand
Whether a higher price generates a greater or smaller MOS, depends on what?
PED
Effect of higher cost of production on firms BE quantity + on chart
Increase BEQ
If VC increase → TC line is steeper
If FC increase → TC line shifted upwards
Summary: effect of increase in price on BEQ, profit, MOS
BEQ decreases
Profit increases
MOS increases
Summary: effect of increase in cost on BEQ, profit, MOS
BEQ increases
Profit decreases
MOS decreases
What formulas to use to quantitatively show effect of change in price and cost on BE
BE = FC / CPU
CPU = SP - AVC
Why are actual BE, profits / losses, MOS going to be diff from the predicted ones in BE analysis? (not in spec)
Non price determinants of demand → affects BEQ → affects MOS
fashion tastes change → demand ↑ → profit ↑, MOS ↑, BEQ reached sooner
Innovation / new tech → demand ↑ → revenue ↑ → profit ↑, MOS ↑, BEQ reached faster
ST vs LT pricing
SR- low price to attract customers: contribution ↓ → BEQ ↑, profit ↓, MOS ↓
LR- opposite (once customers are loyal)
External factors (costs, interest, exchange rates)
Increase costs → decrease contribution → BEQ ↑, profit ↓, MOS ↓
Risk level
High risk project → high FC → BEQ ↑, MOS ↓ (but potential profit ↑ if successful)
Assumptions of BE analysis / charts
Costs are constant (linear)
Sales revenue is constant (linear)
All output will be sold
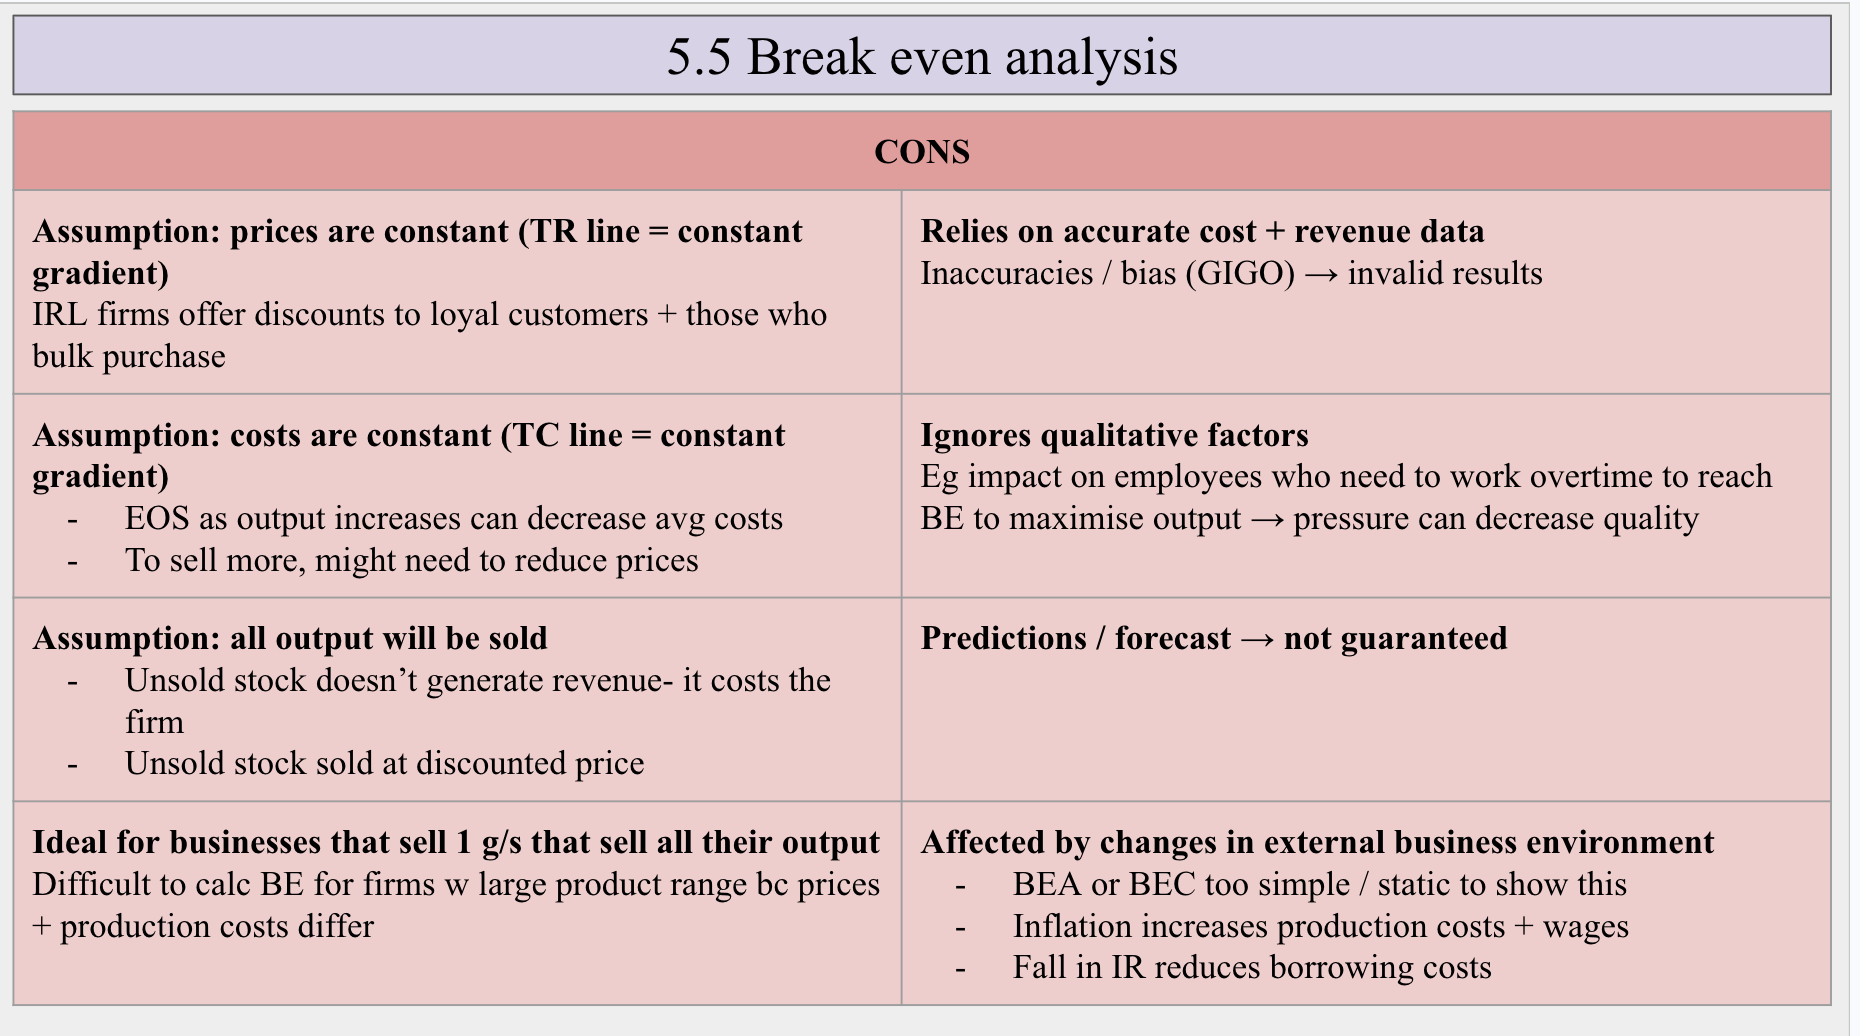
Cons of BE analysis
Assumption: prices are constant (TR line = constant gradient)
Assumption: costs are constant (TC line = constant gradient)
Affected by changes in external business environment
Ideal for businesses that sell 1 g/s that sell all their output
Relies on accurate cost + revenue data
Predictions / forecast → not guaranteed
Ignores qualitative factors
Assumption: all output will be sold
Pros of BE analysis as a planning + decision making tool
Product portfolio management
Helps to assess the expected BEQ prior to the launch of a new product.
Risk assessment
By calc MOS
Helps w make or buy decisions (CTM vs CTB)
Helps w special order decisions
If a one-off orderi s worth accepting