Economics 1.2 - How markets work
1/21
There's no tags or description
Looks like no tags are added yet.
Name | Mastery | Learn | Test | Matching | Spaced |
|---|
No study sessions yet.
22 Terms
What are the assumptions of rational decision making?
Consumers aim to maximise utility - Utility is the satisfaction gained from consuming a product. Consumers make decisions based on calculating the utility gained from each decision.
Firms aim to maximise profit - Economic theory assumes that firms are run for owners and shareholders so aim to profit max.
Governments aim to maximise social welfare - Governments are voted by and work for the public, so should aim to maximise satisfaction.
What is demand, and what causes movements along it?
Demand - The ability and willingness to buy a particular good at a given price and moment in time.
Movements along the demand curve - Caused by a change in price of the good. Contraction is movement up the graph, expansion is down the graph.
What are the conditions of demand which cause the demand curve to shift (PIRATES)?
Population - An increased population would expectedly increase demand for all products so shifts demand to the right.
Income - For goods except inferior, increasing income increases demand
Related goods - If goods are complements or subs, a change in the price of that good can cause a shift in the demand curve. Increasing substitute prices increases demand for a product, increasing complement prices decreases demand.
Advertising - Successful advertising increases demand.
Taste/fashion - If something is more fashionable, demand increases
Expectations - Future expectations influence demand for a good. If people expect a price rise, demand will increase.
Seasons - Some products are seasonal
Gov legislation - Legal requirements increase demand, for example car seats.
What is diminishing marginal utility and how does it explain why the demand curve slopes downward?
Diminishing marginal utility - The demand curve slopes downward. Which can be explained by the law of diminishing marginal utility.
Total utility represents the satisfaction gained by a customer as a result of their overall consumption of a good - Marginal utility represents the change in satisfaction from consuming the next unit of a good. Law of diminishing marginal utility states that marginal utility decreases the more of a good is consumed.
This explains why the demand curve slopes downward - If more of a good is consumed, there is less satisfaction derived from the good. This means customers are less willing to to pay high prices at high quantities since they are gaining less satisfaction.
What is PED and what are the different types?
PED - %change in QD/%change in price - Responsiveness of QD to a change in price
Unitary elastic - PED=1
Relatively elastic - PED>1. QD changes by a larger percentage than price.
Relatively inelastic - PED<1. Price changes by a larger percentage that QD.
Perfectly elastic - PED = infinity. Change in price means QD falls to 0.
Perfectly inelastic - PED=0. A change in price has no effect on output.
What factors influence PED?
Availability of substitutes - Lots of substitutes mean people will switch to them if prices go up, so will be elastic.
Time - The longer the time, the easier it will be for people to find an alternative, so the more elastic the good is. In the short run many goods are inelastic.
Necessity - If something is needed, is inelastic.
% of total expenditure - If a good/service is a small % of a persons total expenditure, they may not care about price changes as much, so it will be more inelastic.
Addictive - Addictive products will be inelastic.
What is the significance of PED?
The PED, along with the PES, determine the effect of the imposition of direct taxes and subsidies.
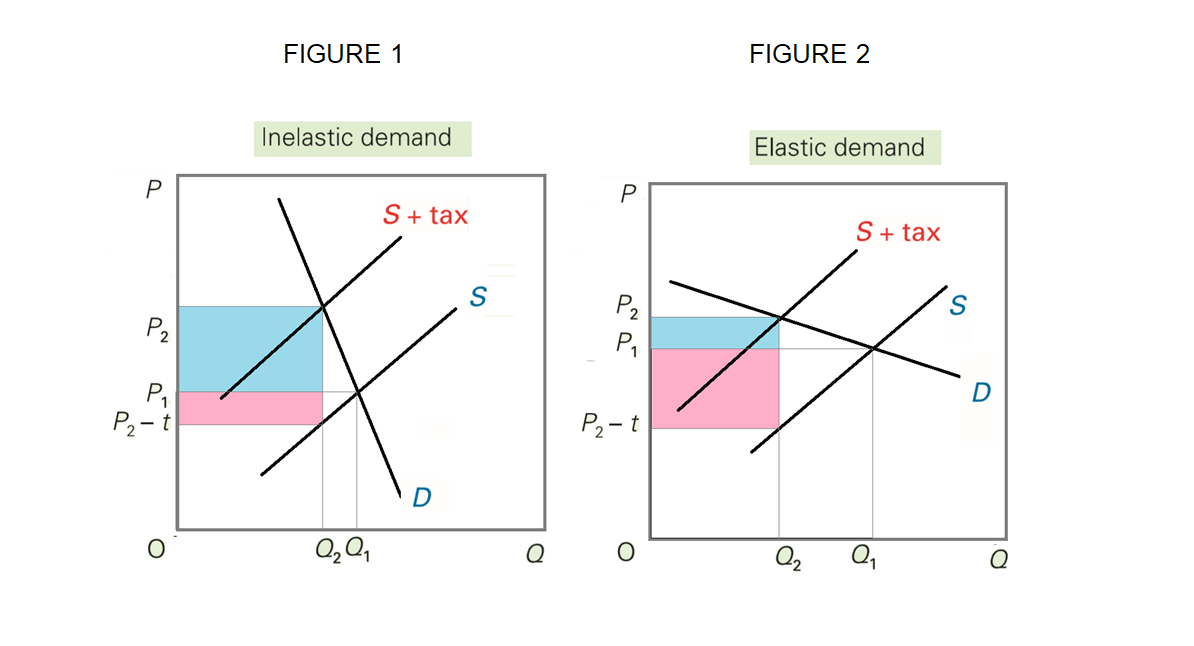
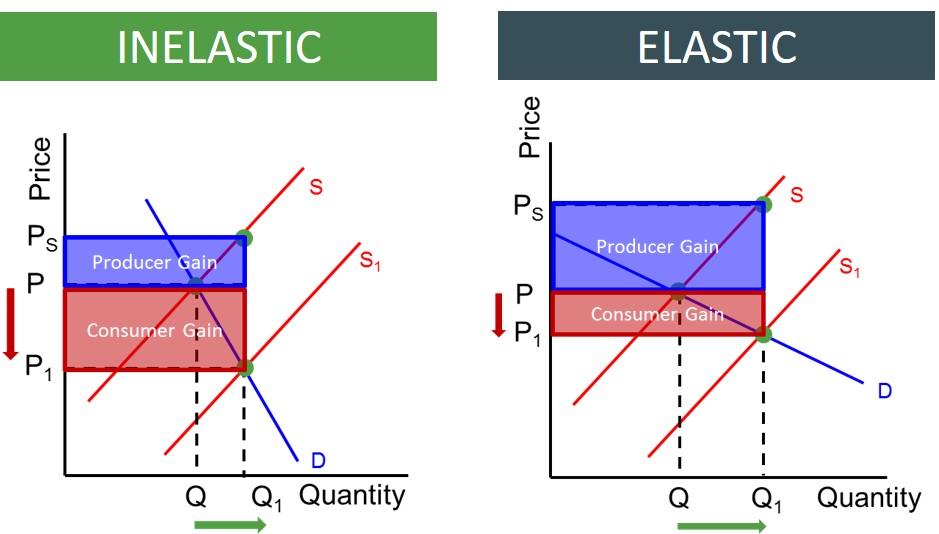
The more elastic the demand curve, the lower the incidence of tax on the consumer - Meaning the more elastic, the lower a tax will effect price.
For inelastic goods, the tax is mainly passed onto the consumer. This means tax will be ineffective at reducing output, but also means there is higher tax revenue for the government. The more inelastic the demand curve, the higher the revenue.
With a subsidy, elastic demand means that consumers see a small fall in price whilst the producer gains more in revenue. The more inelastic demand, the more price falls. Elastic demand means there is a large change in output following subsidies, whilst inelastic means there is little change. Therefore, subsidies on goods with inelastic demand are ineffective at increasing output.
What are the graphs showing the incidence of tax and effects of subsidies on elastic and inelastic goods?
What is the relationship between the different types of PED and revenue?
For an elastic demand curve - A decrease in price leads to an increase in revenue and an increase in price leads to a decrease in revenue.
For an inelastic - A decrease in price leads to a decrease in revenue and an increase in price leads to an increase in revenue.
For a unitary curve - A change in price doesn’t affect revenue.
What is income elasticity of demand (YED), what are the types of what is its significance?
ncome elasticity of demand (YED) - The responsiveness of demand to a change in income (%change in QD/%change in income)
YED<0 - Inferior good - Rise in income decreases QD (inelastic)
YED>0 - Normal good - Rise in income increases QD (Inelastic)
YED>1 - Luxury good (Elastic)
Significant of YED - It’s important for businesses to know how their sales are affected by changes in income of the population. If the economy is improving and people’s incomes rise, it is vital that a business knows about their change in sales. For example, firms may change what they produce, may produce more luxury goods when predicting economic growth.
What is cross elasticity of demand (XED), and what are the types?
Cross elasticity of demand (XED) - The responsiveness of demand for one product (A) to the change in price of another product (B) (%change in QD of A/% change in price of B)
XED>0 are substitutes - An increase in the price of good B increases demand for good A.
XED<0 are complementary good - An increase in price of B decreases demand for good A.
XED=0 - Unrelated goods.
The larger the size of the number, the stronger the relationship.
What is supply, and what are the conditions of supply (Factors shifting supply)
Supply is the ability and willingness to provide a good or service at a particular price at a given moment in time.
Movement of the supply curve - Same as demand, decrease in Quantity is a contraction, increase is expansion
Conditions of supply (Factors effecting supply):
Costs of production - Increase in their costs, at a constant selling price, means less goods/services can be supplied.
Price of other goods - Joint supply is where the production of 1 good causes the production of another good, e.g production of beef automatically produces leather. Therefore, if the price of 1 good rises, more will have to be obtained, increasing the supply of the other. Competitive supply is where the production of 1 good prevents the supply of another, for example killing cows decreases milk production.
Weather - Particularly for agricultural good, supply is dependent on weather.
Technology - If new technology is introduced then it will decrease production costs as there is higher efficiency. This encourages lower prices of more production of goods so the curve shifts to the right.
Taxes and subsidies - A tax decreases supply and a subsidy increases supply.
What is PES and what are the different types?
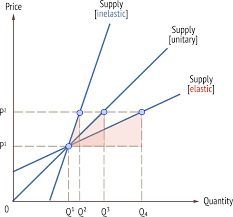
Price elasticity of supply (PES) - The responsiveness of supply to a change in price of the good (%change in QS/%change in price)
Unitary elastic - PES=1, QS changes by the % than price.
Relatively elastic - PES>1, QS changes by a larger % than price.
Relatively inelastic - PES<1, QS changes by a smaller % than price.
Perfectly elastic - PES=infinity, Change in price means QS=0
Perfectly inelastic - PES=0, Change in price has no effect on QS.
What are some factors which affect PES?
Time - Time affects PES because supply becomes more elastic over time, as producers have more opportunity to adjust production in response to price changes.
Working below full capacity - If a business is below full capacity and there is an increase in price, they can easily respond by producing to their full capacity so the supply curve is more elastic.
Availability of FOP - For example, labour may need specific training so can’t instantly be increased so is inelastic.
Availability of substitutes - If a good has a lot of producer substitutes, there is high elasticity.
What does price determination say about the effects of excess demand or supply in the market?
Excess demand - If price is set below equilibrium, there is excess demand. This is because there is an excess demand, as shown by the shaded, and a shortage in the market, meaning firms can charge higher prices and sell their good, causing an extension in supply and a contraction in demand.
Excess supply - If prices are set higher than equilibrium, there is excess supply. As a result, there is excess supply, as shown by the shaded, which means firms have unsold good, encouraging them to sell the excess goods at a lower price. As a result, supply contracts and demand extends.
How does the invisible hand in the free market set prices in the market?
In a free market, the price mechanism allocates resources. Price is determined by the interactions of supply and demand.
The rationing function - The price system is a way of rationing goods because when price increases, some people will no longer be able to afford the product and others may not have the desire to. Therefore the limited resources are rationed and allocated to those who are able to afford them and value them most highly.
The signalling function - The price mechanism acts as a signal where resources should be used. When prices rise, producers move resources into the manufacture of the product. Changes in price indication the market conditions have changed to consumers and producers, so they should change the quantity bought and sold.
The incentive function - Acts as an incentive for people to work hard. The more money buyers have, the more they can buy. The more goods suppliers produce, the more money they can make. Also, low prices incentivise consumers to buy, and high prices incentives suppliers to sell.
What is the difference between consumer and producer surplus, what do they show and how does PED and PES change them?
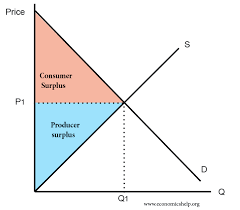
Consumer surplus is the difference between the price the consumer is willing to pay and the price they actually pay.
Producer surplus is the difference between the price the supplier is willing to produce at and the price they actually produce at.
Consumer and producer surpluses show the economic gain from buying and selling goods. Consumer surplus shows the welfare gained by consumers buying the good. Total satisfaction is the CS plus what they spent, what they spent is the quantity x price.
Perfectly elastic demand means no consumer surplus, perfectly inelastic means infinite consumer surplus. When supply is perfectly elastic, producer surplus is 0, when it is perfectly inelastic it is infinite.
How is consumer and producer surplus shown on a supply-demand diagram?
What are indirect taxes, what are the types and what is the incidence of a tax?
Indirect taxes - A tax on expenditure where the person who is charged the tax is not responsible for paying the sum to the government. The business is required to pay but the customer is charged instead. There are 2 types:
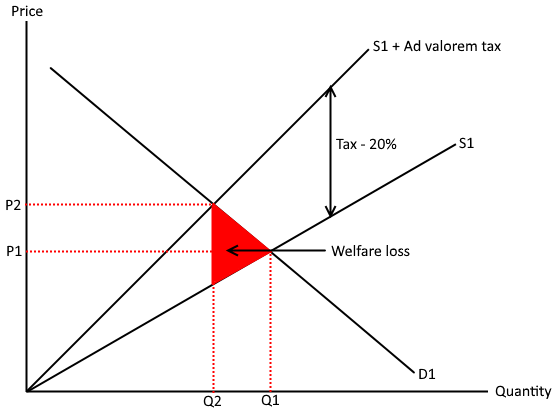
Ad valorem is where the tax payable increases in proportion to the value of the good. The tax is a % of the good, for example VAT.
Specific tax is where a set amount is added to the price, increases with the amount bought rather than the value of good. For example, excise duties on alcohol (£10 per litre)
Incidence of a tax - The burden on the taxpayer. If PED is perfectly elastic, or PES is perfectly inelastic, the supplier pays all of the tax. If PED is perfectly inelastic, or PES is perfectly elastic, all the tax will be passed onto the consumer. The more elastic the demand curve, or inelastic the supply curve, the lower the incidence of tax on the consumer, meaning the supplier pays more. However, the more inelastic the demand curve, the higher the revenue of tax because QD falls less and more goods are bought, increasing tax rev.
What are the diagrams for the 2 types of indirect taxes (Specific and ad valorem)?
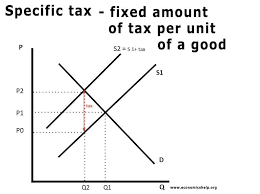
For a specific tax, causes supply to shift because it increases the cost of production, leading to a fall in output. The consumer sees higher prices and suffers from a tax burden as well.
For an ad valorem, the effects are the same but the supply curve shifts and tilts because the tax is a percentage of value.
What are subsidies and how are their effects shown on a supply-demand diagram?
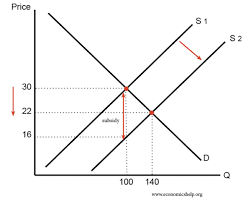
Subsidies - A grant given by the government to encourage increased production/consumption of a good or service.
What are alternative views of consumer behaviour - Why they may not behave as expected?
The assumptions for consumers rational decision making is that customers aim to max utility. However, people don’t always behave like this for 3 main reasons:
Influences of other people - Rationality assumes people act individually to maximise their own benefits but sometimes individuals are influenced by social norms bias, for example buying things just to fit in. This is known as herding behaviour.
Influence of habitual behaviour - Habits create a barrier to decision making since they limit or prevent consumers considering an alternative. Habits include addiction which influence people’s decision, such as feeding their addiction even though they should give up.
Consumer weakness at computation - Many consumers aren’t willing or able to make comparisons between price so will buy more expensive goods than needed. Consumers are also poor at self-control and so do things they know they shouldn’t. May also make decisions without looking at the negative long term effects.