URBAN FEILDWORK ASSIGNMENT - Q6
1/22
There's no tags or description
Looks like no tags are added yet.
Name | Mastery | Learn | Test | Matching | Spaced | Call with Kai |
|---|
No analytics yet
Send a link to your students to track their progress
23 Terms
Geographical enquiry (title)
Does environmental quality improve with distance to the CBD?
Location
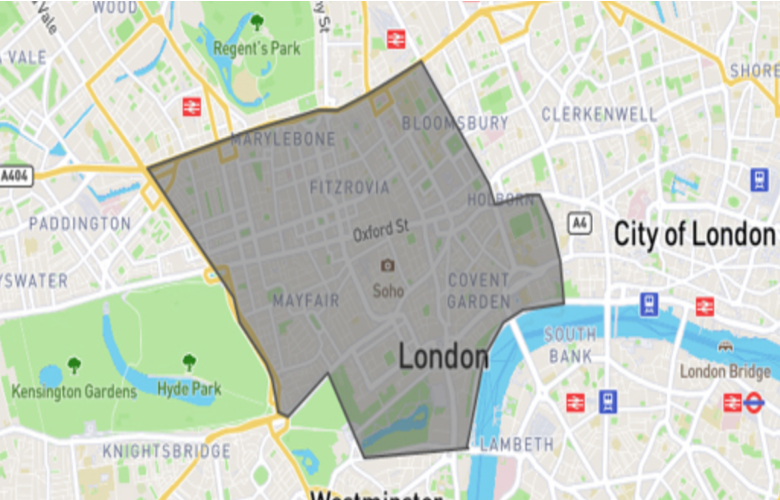
London
Section of London I used for the CBD
The West End area
Aim
To compare the CBD with other areas of the urban environment (london)
Hypothesis 1
Noise and air pollution levels are higher in the CBD compared to more residential
suburban areas
Hypothesis 2
Littering and waste levels are higher in the CBD
Hypothesis 3
Poorer air quality due to traffic congestion and waiting cars.
Sampling strategies
I used systematic sampling
Where did you start and why
WHERE - The roundabout next to Trafalger Square
WHY - It is close to the centre of the CBD and allows me to easily go in different directions with a centre to go from
How many directions did I go from the round about?
6
What distances did I go between collecting data
200m
How far in each direction did I go
2 km
What did I do at turns in the road taking me off course
Taking the one that allowed me to go as straight as possible
How did I show my route using quantitative data
I highlighted the routes I took on a map and used dots in a different colour to show every 200m stop
How did you collect quantitative data
Using a score sheet that included 5 categories
What were the 5 categories
Condition of buildings
Traffic conjestion
Open/green space
Shops and services
Litter
How could results be unreliable?
The results of some of the points (traffic) will differ depending on the time of day, if I had gone out at 11 am on a working Monday morning compared to 3-4 pm on a working Friday traffic would be very different.
I was the only person scoring the area, so results could have been biased
How did you collect quantitative data
Taking a panoramic (360º) photo of where i was standing, and marking litter
Counting number of cars queuing is a traffic light is where I was
How did I use secondary data
Measuring air quality in the area I was in
What site did I use to calculate the air quality
IQair.com
How did I present my data?
Used a spider chart to show my results from the score sheet
Presented my annotated images
Showed my highlighted map
Weaknesses of my study
I did not present much qualitative data, which gives my reults less accurate findings
Strengths
I collected both secondary and primary data and visted the site myself