Chirality, Polymers and Chromatography Flashcards
1/9
Earn XP
Description and Tags
Made on the 24/02/26, using My Notes and OCR A Chemistry A-Level Textbook.
Name | Mastery | Learn | Test | Matching | Spaced | Call with Kai |
|---|
No analytics yet
Send a link to your students to track their progress
10 Terms
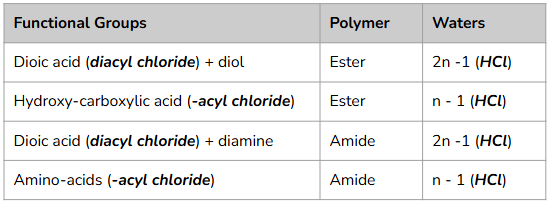
The Condensation Polymerisation Table
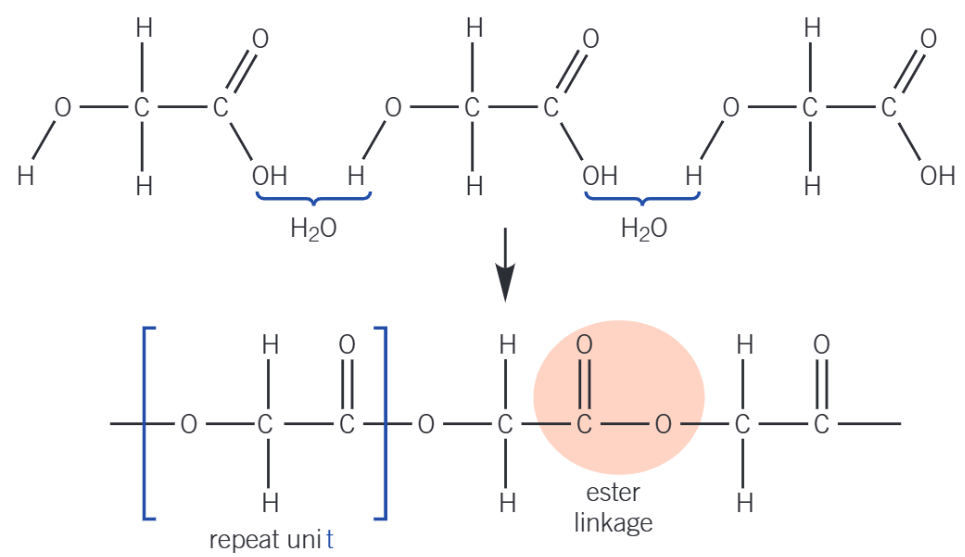
Example: How to draw 2 Repeat Units.
Identify the functional groups on the monomers or monomer (E.g. diol + dicarboxylic acid or amino acid).
Remove -OH from the carboxylic acid group and -H from the alcohol or amine group.
Join the monomers together at those points to form an ester or amide linkage.
Draw 1 complete repeat unit with continuation (dotted, for skeletal) bonds at ends.
Repeat this structure again to create 2 repeat units.
What is Thin Layer Chromatography (TLC)?
Thin layer chromatography (TLC) is a quick and inexpensive analytical technique that indicates how many components are in a mixture. The different components in the mixture have different affinities for the solid stationary phase and bind with differing strengths to its surface.
The mobile phase: Liquid.
The stationary phase: Solid.
Thin layer chromatograms are analysed by calculating the value for the retention factor Rf for each component.
What is Gas Chromatography?
Gas Chromatography is useful for separating and identifying volatile organic compounds present in a mixture. The components of the mixture are separated depending on their solubility in the liquid stationary phase. The compounds in the mixture reach the detector at different times depending on their interactions with the stationary phase column.
The mobile phase: Gas.
The stationary phase: Liquid.
Each component is detected as a peak on the gas chromatogram. Two pieces of information can be obtained from a gas chromatogram.
Retention times can be used to identify the components present in the sample by comparing these to retention times for known components.
Peak integrations (the areas under each peak) can be used to determine the concentrations of components in the sample.
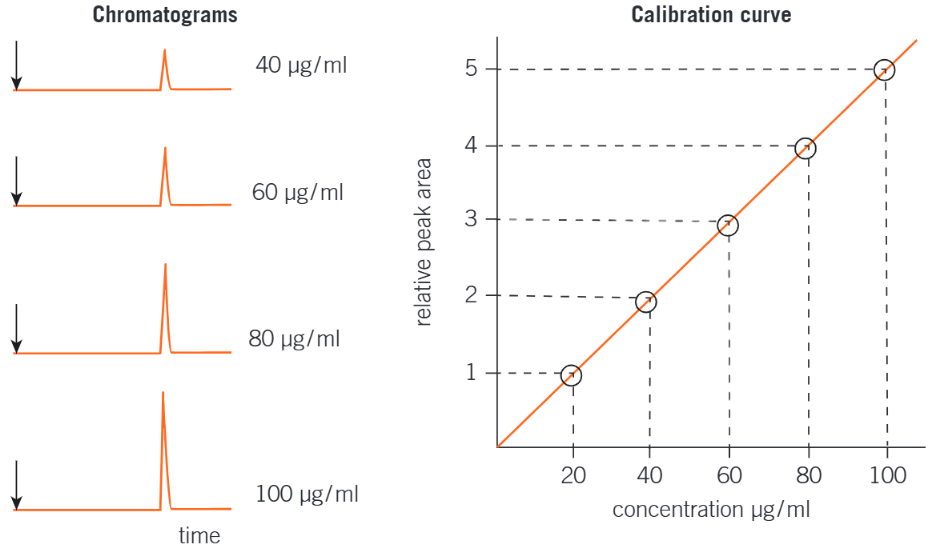
How to plot a Calibration Curve and Why they’re used?
The concentration of a component in a sample is determined by comparing its peak integration (peak area) with values obtained from standard solutions of the component.
The procedure is as followed:
Prepare standard solutions of known concentrations of the compound being investigated.
Obtain gas chromatograms for each standard solution.
Plot a calibration curve of peak area against concentration. This is called external calibration and offers a method for converting a peak area into a concentration.
Obtain a gas chromagram of the compound being investigated under the same conditions.
Use the calibration curve to measure the concentration of the compound.
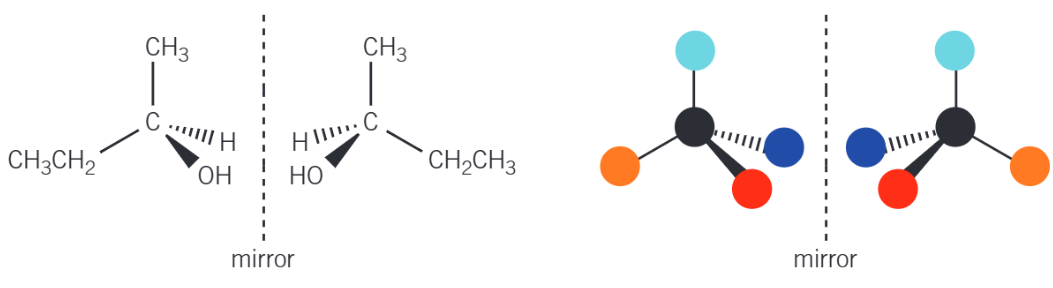
What causes Optical Isomerism?
Optical isomerism is found in molecules that contain a chiral centre. In organic chemistry, the chiral centre is a carbon atom that is attracted to four different atoms or groups of atoms. The presence of a chiral carbon atom in a molecule leads to the existence of two non-superimposable mirror image structures.
What is the definition of Optical Isomerism?
Stereoisomers that are non-superimposable mirrior images of each other.
What is the definition of Stereoisomerism?
Compounds with the same structural formula but with a different arrangements of the atoms in space.
What is a different name for Optical Isomerism?
Enantiomers
Example: How to draw pairs of Optical Isomers?
Optical isomers are drawn to show the 3D tetrahedral arrangement of the four different groups around the central chiral carbon atom. Once one isomer has been drawn, the other is drawn as a mirror image, reflecting the first structure