Psychology data handling and presentation of data
1/32
There's no tags or description
Looks like no tags are added yet.
Name | Mastery | Learn | Test | Matching | Spaced |
|---|
No study sessions yet.
33 Terms
What is qualitative data?
Data that is expressed in words and is non-numerical (although qualitative data may be converted to numbers for the purposes of analysis).
What is quantitative data?
Data that can be counted, usually given as numbers.
Advantages of qualitative data
Has a greater external validity, it provides the researcher with a more meaningful insight into the participant’s perspective.
Disadvantages of qualitative data
Often difficult to analyse. It tends to not lend itself to being summarised statistically so that patterns and comparisons can be harder to identify. So researcher’s often rely on subjective interpretations and these may be subject to bias.
Advantages of quantitative data
Relatively simple to analyse so comparisons can be drawn easily.
Data in numerical forms tend to be more objective and less open to bias.
Disadvantages of quantitative data
Much narrower meaning and detail so it may fail to represent ‘real life’.
What is primary data?
Information that has been obtained first-hand by a researcher for the purposes of a research project. In psychology, such data is often gathered directly from participants as part of an experiment, self-report or observation.
What is secondary data?
Information that has already been collected by someone else and so pre-dates the current research project. For example, the work of other psychologists or government statistics.
Advantages of primary data
It fits the purpose of a particular investigation. E.g. questionnaires and interviews can be designed in a way so that they specifically target the information that the researcher requires.
Disadvantages of primary data
Requires time and effort on the part of the researcher. E.g. requires substantial preparation, planning and resources.
Advantages of secondary data
Inexpensive and easily accessed requiring minimal effort.
Researcher may find the desired information already exists and so there is no need to conduct primary data collection.
Disadvantages of secondary data
There may be substantial variation in the quality and accuracy.
Data may be outdated or incomplete.
The content of the data might not match the researcher’s needs or objectives. This might challenge the validity of any conclusions.
What is content analysis and when is it used?
A research tool used to determine the presence of certain words, themes, or concepts within some given qualitative data (i.e. text).
It is used to quantify and analyse results.
What is meta-analysis?
The process of combining the findings from a number of studies on a particular topic.
The aim is to produce an overall statistical conclusion based on a range of studies.
Define what mean is (one of the measure of central tendency)
The arithmetic average calculated by adding up all the values in a set of data and dividing by the number of values.
Describe what the measures of central tendency are
The general term for any measure of the average value in a set of data.
Define what mode is (one of the measure of central tendency)
The most frequently occurring value in a set of data.
Define what median is (one of the measure of central tendency)
The central value in a set of data when values are arranged from lowest to highest.
Advantages and disadvantages of mean
Advantage: More representative of the data as a whole.
Disadvantage: Data is easily distorted by extreme values.
Advantages and disadvantages of mode
Advantage: Extreme values do not impact the data.
Disadvantage: Less sensitive as the actual values of lower and higher numbers are ignored and extreme values may be important.
Advantages and disadvantages of median
Advantage: Very easy to calculate, sometimes is the only method we can use.
Disadvantage: Not very representative of the whole data set, when there are several modes of data it is not a very useful piece of information.
Define range (one of the measures of dispersion)
It is the distance between the lowest and the highest value in a set of scores.
Define standard deviation (one of the measures of dispersion)
A measure of the variability of a set of scores or values within a group, indicating how narrowly or broadly they deviate from the mean.
State the disadvantages and advantages of standard deviation.
Advantage: shows whether or not data is clustered around the mean, not affected by extreme values or outliers.
Disadvantage: difficult to calculate, does not show full range of data
State the disadvantages and advantages of range.
Advantage: provides a simple and easy-to-understand way to assess the spread of data
Disadvantage: can be sensitive to extreme values and may not be a robust measure in the presence of outliers
Explain when a bar chart would be used.
To show categorical data (quantitative data).
Explain when a histogram would be used.
To show continuous data.
Explain when a scattergram would be used.
To show a relationship between co-variables.
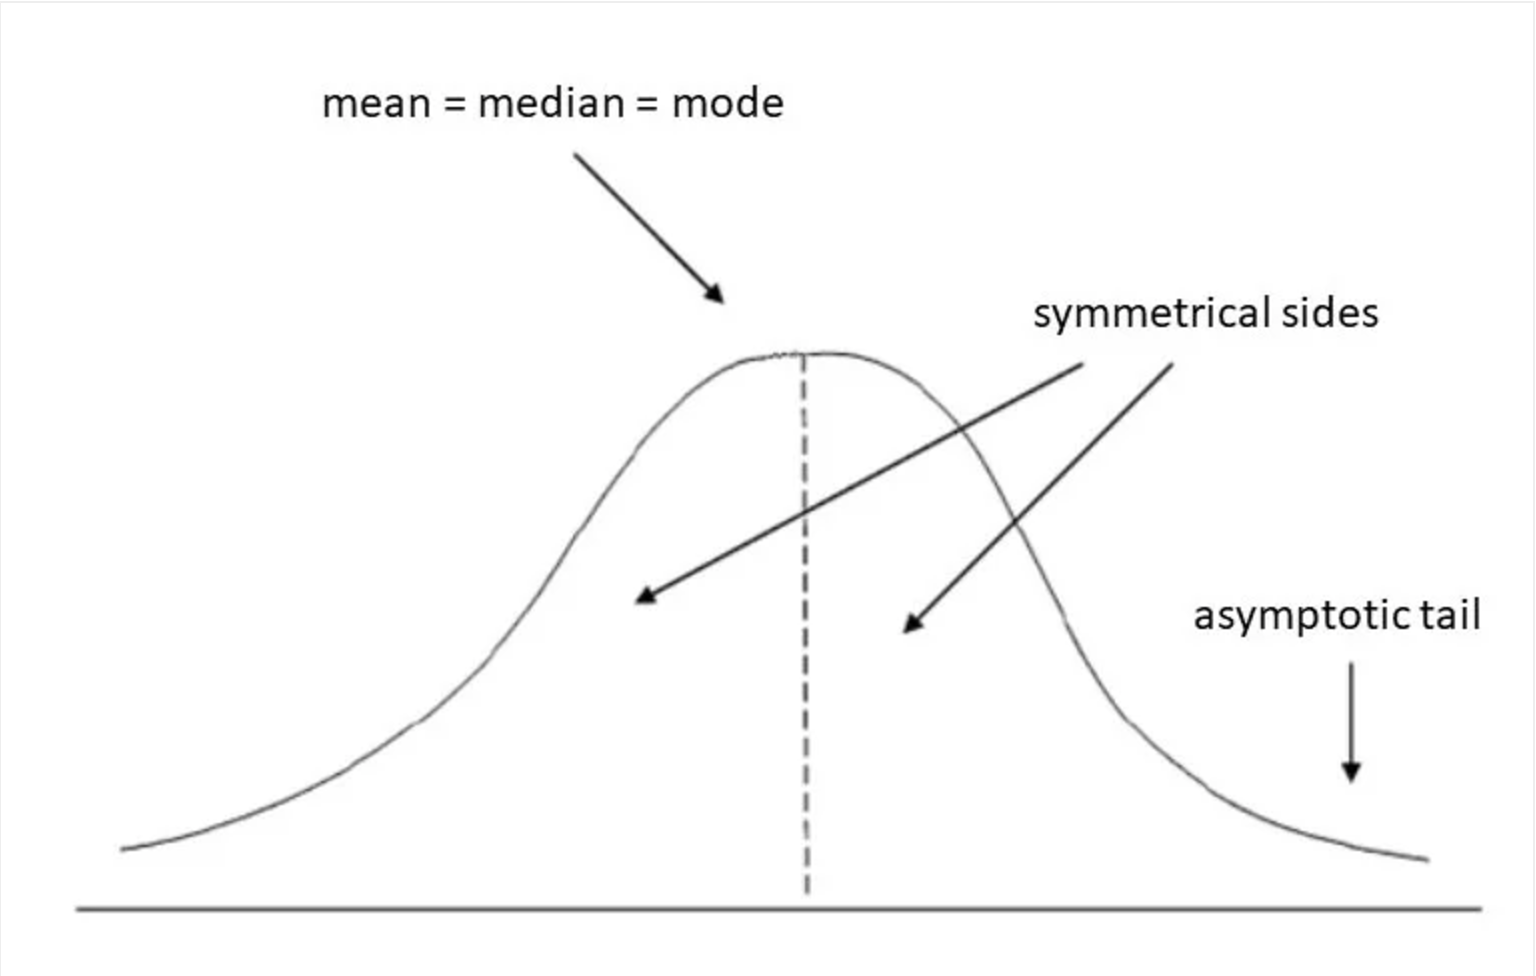
What is a normal distribution?
An arrangement of data that is symmetrical and forms a bell-shaped pattern where the mean, median and/or mode falls in the centre at the highest peak.
What should a normal distribution curve look like and describe the position of mean, mode and median.
When perfect normal distribution occurs the mean, median, and mode will be the same value, visually represented by the peak of the curve.
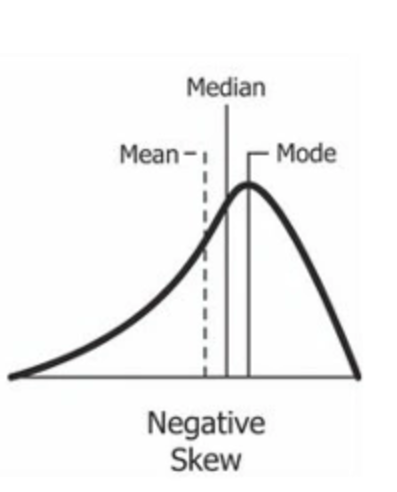
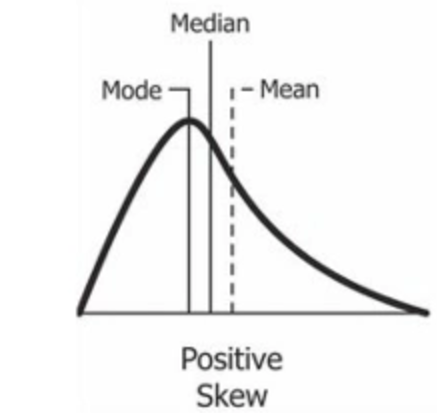
What does a positive skew of a normal distribution curve look like and describe the position of mean, mode and median.
The skewness of the data distribution is on the right; it causes the mean to be greater than the median and eventually move to the right. Also, the mode occurs at the highest frequency of the distribution, which is on the left side of the median. So the graph goes mode, median and mean.
What does a positive skew of a normal distribution curve look like and describe the position of mean, mode and median.
A negatively skewed distribution is the left-skewed distribution with the long tail on its left side. The value of skewness for a negatively skewed distribution is less than zero. So the graph goes mean, median and mode.