Exam 2 Review
1/37
There's no tags or description
Looks like no tags are added yet.
Name | Mastery | Learn | Test | Matching | Spaced | Call with Kai |
|---|
No analytics yet
Send a link to your students to track their progress
38 Terms
Databases
a set of data records (all responses from all participants in a study)
one or more interrelated data files
Data Mining
the process of analyzing data to extract information not offered by the raw data alone
Data coding
the process of assigning labels, tags, or numerical codes to raw data—such as interview transcripts, survey responses, or field notes—to categorize and summarize it for analysis
Prepare the Data: Coding Structured Questions
- the responses to structured questions include those for which answers can be anticipated
- it is possible to precode structured questions (assign variable codes to response categories during the instrument design stage; summarized in a coding scheme.)
- precoding is necessary bc the software tallies data as they are collected
- may decide that the original mapping rule is not as valuable as our preliminary analysis plan predicted
- Recoding: developing new mapping rules and assigning new codes based on the merging of initial variable categories; done during data preparation and examination; reduces the power of the original scale.
>>> useful when trying to understand the patterns in within data
Steps to data collection
The key steps in the data collection phase include:
1. Determine what info you want to collect.
2. Train the data collectors (if applicable).
-Training ensures consistency, reliability, and standardization, minimizing errors and enhancing data quality.
-For survey interviewers, training includes learning instrument pitfalls, following skip directions, selecting participants, and correctly disposing of the completed instrument.
3. Determine the data collection timeline.
-The timeline should include: dates for data collector training, activation (start/stop) times for each task, start/finish times for automated and manual data entry, when data editing starts and finishes, and when the clean data file will be ready for processing.
4. Invite the chosen participants.
-Participants can be invited via phone, email, mail, or in-person for intercept studies, and can also involve prescreening employees.
5. Determine and implement the research processes (Instrument Disposition).
-Instrument disposition includes distributing the measurement instrument (e.g., questionnaire, survey, photo, video, paper/pencil to a dropbox) and returning the completed research task output to the researcher.
6. Activate the research tasks.
-Determine when each task is ready to launch, ensuring everything is error-free and there are no measurement instrument problems before activation.
7. Remind the participant to complete the research tasks (via email, text, or phone).
8. Collect the data.
9. Enter the data
Data Collection Techniques and Tools
-Techniques: Interviews, surveys/questionnaires, observations (direct or indirect), case study, and checklists.
-Tools: Stratification and check sheet.
types of data
-First-party data: Information gathered directly from your audience; high confidence in accuracy and relevance. Provides insights into customer behaviors, preferences, and characteristics.
-Second-party data: The first-party data of another company; provides insights not available solely from your own first-party data.
-Third-party data: Information consolidated by a company from numerous sources into a comprehensive data set.
data record
set of data fields from one case (rows in the data file).
data fields
(variables) should be defined and files linked to simplify storage, retrieval, and updating.
Data Collection Tasks (The "Process" Steps)
Instrument Disposition: How the survey gets to the user and back to you. distributing the measurement instrument (e.g., questionnaire, survey, photo, video, paper/pencil to a dropbox) and returning the completed research task output to the researcher.
Pilot Testing (Pretesting): Always do this before you activate to find errors.pretesting of an instrument provides information abt the variables to test a coding scheme
Data Validation: The "fraud check" to make sure the data isn't fake.
Coding Scheme
- Coding Scheme (codebook): contains each variable in the study and specifies the application of mapping rules (e.g., 1 = Yes, 2 = No). to the response codes of each variable
>>> pretesting of an instrument provides information abt the variables to test a coding scheme
>>> integral to setting up the date file before its entered
>>> contains the variable ID number, variable name and label, location of the variables code in the data record (column designation), response option codes and labels, and type of variable (determines possible statistical procedures)
structured questions
Answers can be anticipated, allowing for precoding (assigning value codes to response categories during instrument design). Precoding is necessary because software tallies data as it is collected.
recoding variables
After data collection, if the original mapping rule is deemed not valuable, new mapping rules and codes can be assigned by merging initial variable categories, which is useful for understanding patterns.
Content Analysis
- Content Analysis: uses a systematic, objective approach to code message characteristics so researchers can treat diverse textual or verbal content quantitatively as they look for patterns and draw inferences
>>> works best with larger samples
>>> can be used to analyze written, audio, video, data from experiments, observations, surveys, and secondary data studies
Coding Textual and Verbal Responses
This involves content analysis
-Content analysis is a systematic, objective approach to code message characteristics so diverse content can be treated quantitatively.
-It looks at word use and meaning, using both software and human interpretation. It can be slow and error-prone due to the volume of open-ended responses
-Content analysis software permits stemming (uses common root words to create aliases), aliasing (searches for synonyms), and exclusion (filters out trivial words)
Coding for content analysis starts by determining which units of data will be analyzed. Three types of data (units of analysis)
Coding for content analysis starts by determining which units of data will be analyzed. Three types of data
1. Context units: the objective of the research (e.g., evaluating an employee performance form).
2. Sampling Units: what text elements the researcher will code (words, phrases, sentences, paragraphs).
3. Recording Units: the ideas embedded in the content. Can be Syntactical, referential, propositional, or thematic (e.g., performance, management potential)
Content Analysis
Recording Units: Syntactical, referential, propositional, or thematic
>>> Syntactical Units: the specific, author-defined words, phrases, sentences, or paragraphs. Words are the smallest and most reliable data units to analyze. We count these units but are more interested in their meaning in context
>>> Referential Units: describe objects by using words and phrases. researchers use these to make inferences abt attitudes, values or preferences
>>> Propositional Units: assertions about an object
>>> Thematic Units: topics contained within (and across) texts; they represent higher-level abstractions inferred from the text and its context
Sample Text for Analysis: > "The local park is a vibrant community hub. However, the broken benches are neglected. The city council must prioritize repairs to ensure resident safety."
Sample Text for Analysis: > "The local park is a vibrant community hub. However, the broken benches are neglected. The city council must prioritize repairs to ensure resident safety."
1. Syntactical Units
These are the literal building blocks of the text. Analysis here is often about frequency or count of specific linguistic structures.
Word Level: Counting how many times the word "repairs" or "safety" appears.
Sentence Level: Analyzing the structure of the specific sentence: "The local park is a vibrant community hub."
Paragraph Level: Analyzing the entire three-sentence block as one unit of "editorial demand."
2. Referential Units
These focus on how a particular "thing" (the referent) is being described. This is used to gauge the "image" or "vibe" of an object.
The Referent (The Park): Described as a "vibrant community hub."
The Referent (The Benches): Described as "broken" and "neglected."
The Referent (City Council): Described as an entity that "must prioritize."
3. Propositional Units
These are specific claims or assertions being made. You are looking for the "thought" or "judgment" within the sentence.
Assertion A: The park serves the community.
Assertion B: The benches are in poor condition.
Assertion C: The city is responsible for safety.
Assertion D: Current maintenance is insufficient.
4. Thematic Units
These are the "big picture" ideas. They often require looking at the text as a whole to see what broader message is being sent.
Theme of Civic Responsibility: The text argues that the government (City Council) has a duty to the people.
Theme of Urban Decay: The mention of "broken" and "neglected" elements points to a broader theme of a deteriorating environment.
Theme of Public Safety: The final assertion connects physical objects (benches) to the well-being of the population.
Content AnalysisIntra-Rater Reliability vs Inter-Rater Reliability
--Reliability and validity are crucial for credible results.
- Intra-Rater Reliability: a measure of the consistency of the application of a coding scheme between raters of context, across texts, when multiple raters are used. (the same rater must assign codes in the same way consistently for each text analyzed)
- Inter-Rater Reliability: a measure of the consistency of the application of a coding scheme by a single rater of content, across texts. (different raters must assign codes in the same way to the same text
Content Analysis
Stemming, Aliasing, and Exclusion Processes
Content analysis software applies statistical algorithms to textual and verbal data.
- Stemming Process: uses derivations of common root words to create aliases (using searching, searches, searched, for search)
- Aliasing Process: searches for synonyms (wise or smart for intelligent)
- Exclusion Process: filters out trivial words (be, is, the, of) in the search for meaning
Editing The Data
-The process of verifying that designated coding schemes have been used and that all collected data are entered correctly.
-Its purpose is to guarantee data are complete, accurate, and appropriately coded.
-It detects and corrects errors and omissions to achieve maximum data quality standards.-The process is complete when all data collected are ready for analysis.
Coding: How would you code that question
1. The Coding Process
Step A: Determine if it is Precoded or Post-coded
--- Precoded (Structured): If the question is multiple-choice. This means assigning numbers to the response categories before the survey is even taken.
--- Post-coded (Unstructured): If the question is open-ended. use Content Analysis.
Step B: Create the "Coding Scheme"
You must explain how you would map the answers. Mention that your categories must meet these three requirements:
--- Mutually Exclusive: A person cannot fit into two categories at once
--- Exhaustive: Every possible answer has a "home" (usually by including an "Other" or "Don't Know" category).
--- Single Dimension: The category only measures one thing.
Step C: Define the Data Field
Explain that the result will be entered into a Data Record (one participant's answers) within a Database (all participants).
2. Handling the "Messy" Data (The "Edge Cases")
--- Scenario 1: The "Don't Know" (DK) Response
Is it Type 1? (Legitimate): The person genuinely doesn't know. Keep it. Code it as a unique value (e.g., "9").
Is it Type 2? (Researcher Error): The question was so confusing they gave up. Exclude it during editing because it biases the data.
--- Scenario 2: Missing Data
If a participant skips a question, you need to name the technique you'd use to fix it:
Listwise Deletion: "I'll delete this person's entire survey." (Use if they missed a lot).
Pairwise Deletion: "I'll ignore the missing answer for this one calculation but keep their other answers for different questions."
Predictive Replacement: "I'll use their other answers to guess the missing one."
--- Scenario 3: Inconsistent/Inaccurate Data
perform Data Validation.
Action: If possible, use a callback to clarify, rather than guessing what they meant
5 Types of Linear Programming Problems
1. Resource Allocation
2. Cost-Benefit Trade Off
3. Mixed Problems
4. Transportation
5. Assignment
Resource Allocation
≤ (bc you have a limit on resources) total resources used cannot exceed what is available
Cost-Benefit Trade Off
≥ (bc you must meet a minimum requirement) total benefit must be at least a certain level
If a project must generate at least $50,000 in benefits:
20x + 30y ≥ 50,000
➡ This means the total benefit from x and y must be greater than or equal to 50,000
Mixed
Combo of 2/more (=, >=, <=)
Transportation and Assignment
= (bc you must ship/assign an exact amount)
The “=” (equal to) symbol represents a strict requirement
It ensures that supply and demand (or assignments) are met exactly—no more, no less
Examples ➜
Transportation:
If a warehouse must ship exactly 200 units:x₁ + x₂ + x₃ = 200
➡ Total units shipped must equal exactly 200
Assignment:
If one worker must be assigned to exactly one job:x₁ + x₂ + x₃ = 1
➡ The worker is assigned to one and only one task
How to Add Solver in Excel
File > Options > Add-ins > Go > Checkmark next to Solver Add-In > Ok
Solver is in Data Tab
Resource Allocation: Super Grain Corp. Ad-Mix Problem
•Goal: Design the promotional campaign for Crunchy Start.
•The 3 most effective advertising media for this product are
•TV commercials on Saturday morning programs for children.
•Ads in food and family-oriented magazines.
•Ads in Sunday supplements of major newspapers.
•The limited resources in the problem are
•Advertising budget ($4 million).
•Planning budget ($1 million).
•TV commercial spots available (5).
•The objective will be measured in terms of the expected number of exposures.
Question: At what level should they advertise Crunchy Start in each of the three media?
given:
TV Commercial
Ad Budget Cost: $300,000 per commercial
Planning Budget Cost: 90,000 per commercial
Expected Exposures: 1,300,000
Magazine Ad
ABC: $150,000 per ad
PB Cost: 30,000 per ad
EE: 600,000
Sunday Ad
ABC: $100,000 per ad
PB: 40,000 per ad
EE: 500,000
1. Algebra 2. Set up in excel
Algebra:
TV = Number of commercials for separate spots on television
M = Number of advertisements in magazines
SS = Number of advertisements in Sunday supplements. Maximize Exposure = 1,300TV + 600M + 500SS subject to
--- Ad Spending: 300TV + 150M + 100SS ≤ 4,000 ($thousand)
--- Planning Cost: 90TV + 30M + 30SS ≤ 1,000 ($thousand)
--- Number of TV Spots: TV ≤ 5
and TV ≥ 0, M ≥ 0, SS ≥ 0.
IN EXCEL:
Set UP:
Step 1: Set Up the Headers and Labels
Cell A1: Type Super Grain.
Cells C3, D3, and E3: Type TV, Mag, and SS (Sunday Supplement).
Cell B4: Type Exposures Per Ad (thousands).
--- this row you will put your given info (1300, 600, 500) and highlight in blue
Cells C7, D7, and E7: Type Cost Per Ad (thousands).
Cell F7: Type Budget Spent.
--- in space btwn these put constraint of <= bc Budget spent will need to be <= to Budget Available
Cell H7: Type Budget Available.
--- this row you will put your given info (4000, 1000) and highlight in blue
Step 2: Define the Cost and Volume Rows
Cell B8: Type Ad Budget.
--- this row you will put your given info (300, 150, 100) and highlight in blue
Cell B9: Type Planning Budget.
--- this row you will put your given info (90, 30, 40) and highlight in blue
Cells C12, D12, and E12: Type TV, Mag, and SS again for the calculation section.
Cell B13: Type Number of Ads.
--- this row will be your changing cells () and highlight in yellow
--- once we put in our formulas imputed we can plug different numbers here to see different outcomes
Cell H12: Type Total Exposures (thousands).
--- this is our objective (max number of exposures possible to increase sales) and highlight in orange
Cell C15: Max Tv Spots: Input 5 and shade in blue
--- in space btwn Number of TV ads and max tv spots put constraint of <= bc number of tv ads will need to be <= 5
Resource Allocation: Super Grain Corp. Ad-Mix Prob CONTINUED
•Goal: Design the promotional campaign for Crunchy Start.
•The 3 most effective advertising media for this product are
•TV commercials on Saturday morning programs for children.
•Ads in food and family-oriented magazines.
•Ads in Sunday supplements of major newspapers.
•The limited resources in the problem are
•Advertising budget ($4 million).
•Planning budget ($1 million).
•TV commercial spots available (5).
•The objective will be measured in terms of the expected number of exposures.
Question: At what level should they advertise Crunchy Start in each of the three media?
given:
TV Commercial
Ad Budget Cost: $300,000 per commercial
Planning Budget Cost: 90,000 per commercial
Expected Exposures: 1,300,000
Magazine Ad
ABC: $150,000 per ad
PB Cost: 30,000 per ad
EE: 600,000
Sunday Ad
ABC: $100,000 per ad
PB: 40,000 per ad
EE: 500,000
3. formulas
4. Solver
1. Budget Spent Formulas (Cells F8 and F9)
--- F8 (Ad Budget Spent): = SUMPRODUCT (C8:E8,C13:E13) (this is multiplying each Ad budget times its number of ads (yellow) and adding them together)
--- F9: (Planning Budget Spent): =SUMPRODUCT(C9:E9,C13:E13)
2. Total Exposures (thousands) (this is the orange objective cell)
--- Cell H13: =SUMPRODUCT(C4:E4,C13:E13) (this is multiplying each exposures per ad by number of ads (yellow) and adding them together)
3. Solver
In Data Tab
Set Objective: $H$13 Total Exposures
Goal: MAX
Changing Cells: $C$13:$E$13 (yellow)
Add Constraint: $F$8:$F$9 (formulas) <= Constraint: =$H$8:$H$9
Add Constraint: $C$13 (Yellow TV) <= 5 (given max tv spots)
OK
Check Box: Make Unconstrained Variables Non Negative
Select Solving Method: Simplex LP
SOLVE
Answer: 0, 20, 10, Total 17000
REVISED SUPERGRAIN
•two audiences should be targeted — young children and parents of young children.
•Two new goals
•The advertising should be seen by at least 5 mil young children.
•The advertising should be seen by at least 5 mil parents of young children.
•exactly $1,490,000 should be allocated for cents-off coupons.
Given:
Young Children:
TV Commercial: 1.2 million
Mag Ad: 0.1 million
Sunday Ad: 0
Minimum Acceptable Level: 5 million total reach
Parents of Young Children:
TV Commercial: 0.5 million
Mag Ad: 0.2 million
Sunday Ad: 0.2 million
Minimum Acceptable Level: 5 million total reach
Coupon Redemption Contribution
Each TV Commercial: $0 toward the requirement
Each Mag Ad: $40,000 toward the requirement
Each Sunday Ad: $120,000 toward the requirement
Total Req Amount: $1,490,000
Set up in excel
Add 6 rows
Step 3: Define Demographic Reach and Constraints
Cell C11: Type Number Reached per Ad (millions).
Cell F11: Type Total Reached.
In the space between Total Reached and Minimum (Column G12:G13), put the constraint >= because your reach must be greater than or equal to your targets.
Cell H11: Type Minimum Acceptable.
Cell B12: Type Young Children.
Input your given info for TV, Mag, and SS reach in C12, D12, and E12 and highlight in blue. (1.2, 0.1, 0)
Cell B13: Type Parents.
Input your given info for TV, Mag, and SS reach in C13, D13, and E13 and highlight in blue. (0.5,0.2,0.2)
Cells H12 and H13: Input your Minimum Target values for each demographic and highlight in blue. (5,5)
Step 4: Define Coupon Redemption Constraints
Cell B16: Type Coupon Redemption (thousands).
Cell F15: Type Total Redeemed.
In the space between Total Redeemed and Required (Column G16), put the constraint = because you must meet an exact required amount.
Cell H15: Type Required Amount
Input your given coupon data for TV, Mag, and SS in C16, D16, and E16 and highlight in blue. (0,40,120)
Cell H16: Input your Required Total for redemptions and highlight in blue. (1490)
REVISED SUPERGRAIN
•two audiences should be targeted — young children and parents of young children.
•Two new goals
•The advertising should be seen by at least 5 mil young children.
•The advertising should be seen by at least 5 mil parents of young children.
•exactly $1,490,000 should be allocated for cents-off coupons.
Given:
Young Children:
TV Commercial: 1.2 million
Mag Ad: 0.1 million
Sunday Ad: 0
Minimum Acceptable Level: 5 million total reach
Parents of Young Children:
TV Commercial: 0.5 million
Mag Ad: 0.2 million
Sunday Ad: 0.2 million
Minimum Acceptable Level: 5 million total reach
Coupon Redemption Contribution
Each TV Commercial: $0 toward the requirement
Each Mag Ad: $40,000 toward the requirement
Each Sunday Ad: $120,000 toward the requirement
Total Req Amount: $1,490,000
Formulas and SOLVER
Formulas
1. Total Reached Formula
--- Young Children: =SUMPRODUCT(C12:E12,C19:E19)
--- Parents: = SUMPRODUCT(C13:E13,C19:E19)
2. Total Redeemed Formula
--- Coupon Redemption: =SUMPRODUCT(C16:E16,C19:E19)
You can see that the yellow numbers dont work anymore bc the constraints are not correct (2000 redeemed does NOT equal 1490 Req Amnt)
Solver
Data tab. Solver
Keep Everything the same
Add Constraint: $F$8:$F$9 <= $H$8:$H$9
Add Constraint: $F$16 = $H$16
SOLVE:
3, 14, 7.75
total exposures: 16175
Allowable Range (allowable range for the right-hand side)
The range of values for the right-hand side of a functional constraint over which this constraint's shadow price remains valid.
It shows how much you can increase or decrease a resource (or requirement)
While still keeping the same optimal solution structure and same shadow price
Key Idea ➜
➡ Within this range, the value of an extra unit (shadow price) stays constant
Example ➜
If a constraint is:
5x + 3y ≤ 100
And the allowable range is:
80 ≤ RHS ≤ 120
➡ As long as the RHS stays between 80 and 120,
The shadow price does not change
The current solution remains optimal (only values adjust slightly)
Why it matters ➜
Helps with sensitivity analysis
Tells you how stable your solution is if conditions change
“How much can I change the RHS (like 100 → ?)
before the solution itself changes?”
Key Insight ➜
You are not re-solving from scratch each time
You are checking how far the constraint limit (RHS) can move
while your current solution is still valid
How to Generate a sensitivity Report
- solver and solve it after adding constraints
- in Solver Report Pop-up:
--- Reports > Sensitivity > OK
- (integer constraints: run the sensitivity report first and then add the integer constraints)
How to Interpret a Sensitivity Report
Variable Cells
- Final Value Variable Cells: Changing units that get solved with solver
- Objective Coefficient Variable Cells: Given Unit Profit
- Purpose of running what if analysis and sensitivity Report: in the real world, often given incorrect data. Look at allowable inc and dec. Allowable Range: Price we can charge before our optimal solution changes when running solver (yellow cells) (Max dec, Max inc)
- Max Decrease= What we are currently making (objective coef) - Allowable Dec
- Max Increase= What we are currently making (objective coef) + Allowable Inc (if it is 1E+30= INFINITY IS YOUR MAX INC) (if you have this but its in the allowable dec section it just goes down to 0 bc it doesnt deal with negative numbers)
- This gives us our ALLLOWABLE RANGE!!
- if you are in the allowable range, then the yellow shouldn't change
Constraints
- Final Value (hours used (your formulas))
- Constraint Right Side (Hours available (right side) (after Hours used <= ____))
- Allowable inc and dec: use the same method you used for variable cells
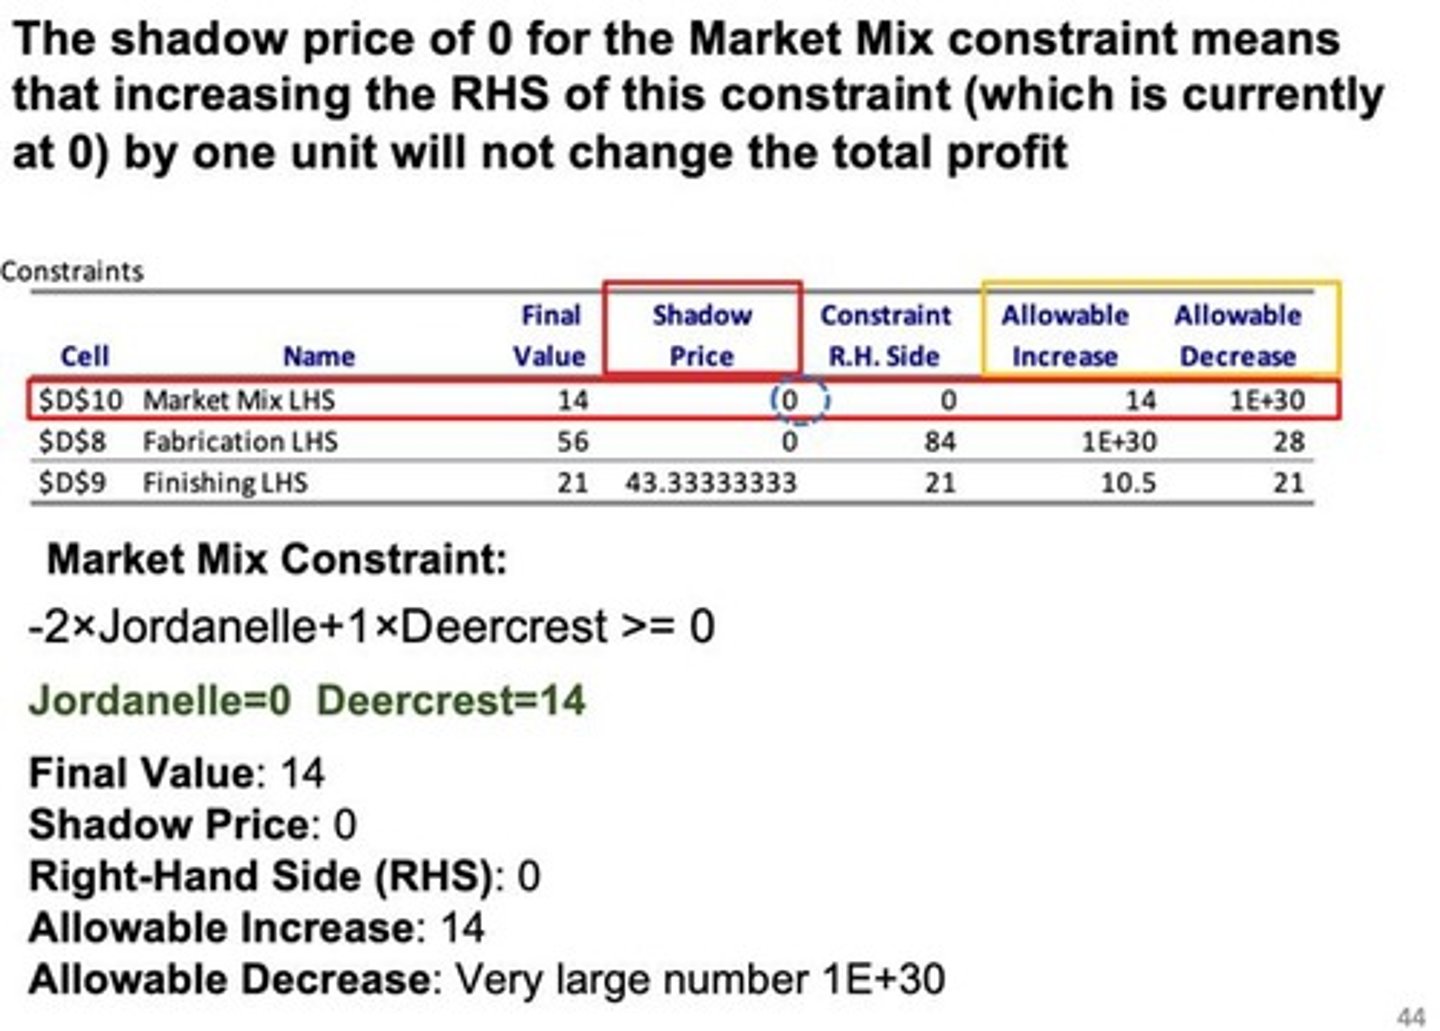
How to Interpret a Sensitivity Report: Shadow Price
Under Constraint section in sensitivity report
- shows us how changing any of this will change our profit
- Represents the marginal gain in the objective value that would occur if one more unit of a resource were added.
-It indicates how much the optimal objective value will increase per unit increase in the RHS of a constraint, provided the change is within the allowable increase
-It is widely used to help management find the best trade-off between costs and benefits.
- The shadow price for a functional constraint is the rate at which the optimal value of the objective function can be increased by increasing the right-hand side of the constraint by a small amount.
***the Shadow Price tells you how much Profit (Objective Value) increases for one additional unit of a resource. If the exam asks, "What happens if we add 10 units?", you multiply the Shadow Price by 10
How to Interpret a Sensitivity Report: 100% Rule
- If we make changes were the total change is less than 100% then our product mix (Final Value Variable Cells: Changing units that get solved with solver) would not change. If more then we dont know what the solution would be and we would have to rerun it
- Actual change/allowable change
---- Change/Allowable Inc
---- Change/Allocable Dec
- Add to be a percent (if less than the product mix would not change. If over, you would have to rerun solver to see if product mix (Final Value Variable Cells: Changing units that get solved with solver) stays the same or changes)
- If you change two things, you add the percentages. If the total is less than or equal to 100%, the optimal solution (product mix) stays the same.
-For each simultaneous change, calculate the percentage of the allowable change (inc/dec).
-If the sum of the percentage changes does not exceed 100%, the original optimal solution definitely will still be optimal.
-The allowable range assumes the original estimates for all other coefficients are completely accurate
How to Graph
Given:
Factory 1:
- 1 hr for framing per door
- 0 hrs to frame window
- hrs available: 4
Factory 2:
- 0 hrs for framing per door
- 2 hrs to frame window
- hrs available: 12
Factory 3:
- 3 hrs for framing per door
- 2 hrs to frame window
- hrs available: 18
1. Write out Algebraically
- Factory 1: 1D <= 4
- Factory 2: 2W <= 12 OR w <= 6
- Factory 3: 3D + 2W <= 18
2. Graph
- graph is positive |__ bc it only produced positive results
- y axis is D and x is W with 10 tick marks on each
- Factory 1: 1D <= 4
--- go up 4 on D-axis and draw dotted line across
--- this tells us that D has to be below this dotted line
- Factory 2: 2W <= 12 OR w <= 6
--- go across 6 on W and draw a dotted line going up
--- this tells us that W has to be to the left of the dotted line
- Factory 3: 3D + 2W <= 18
--- 3D<=18 --> D<=6 (go up to 6D on the axis and make a point. shows us where the diagonal line crosses the D axis)
--- 2W<=18 ---> W<=9 (go across to 9W on the axis and make a point. Shows where the diagonal line is gonna cross the W axis)
- connect the two points and everything under all the lines is the feasible area. any points in it is a possible solution bc it does not exceed the resources that we have
- On the graphing section, if you have a >= constraint (like in the Revised Supergrain reach targets), the area above that line is feasible. If you have <= (like budget), the area below is feasible. The "Feasible Region" is only where all those shaded areas overlap.
- To find Best Solution: "slide" the Objective Function line (the profit line) out from the origin (0,0) until it hits the last possible corner of the Feasible Region. That last corner is your Optimal Solution.