Operations Management - Exam 1
1/147
There's no tags or description
Looks like no tags are added yet.
Name | Mastery | Learn | Test | Matching | Spaced | Call with Kai |
|---|
No analytics yet
Send a link to your students to track their progress
148 Terms
Benchmarking
a process in which one company studies the processes of another company to identify best practices
Benchmarking is important to
investors. it shows the relative cost of providing a good or service closely related to earnings growth
For benchmarking, you want to use a company that is
similar
What business parameters would you want to compare for benchmarking?
size, product, customer market, sector, location
Profit margin =
ratio income to sales revenue
Profit margin equation
annual income / annual sales revenue
Asset turnover is
the amount of sales generated for every dollar’s worth of assets
“Turnover = Revenue” or the rate at which
goods are sold and replaced in a store
Asset Turnover equation
= annual sales revenue / average total assets
Return on assets
income generated by assets
ROA equation
= profit margin x asset turnover = annual income / average total assets
Operations and supply chain management involves specialists in
product design, purchasing, manufacturing, service operations, distributions
Success in OSCM depends on
operations-related strategy, processes to deliver products and services
OSCM definition
the design, operation, and improvement of the systems that create and deliver the firm’s primary products and services
OSCM is concerned with
the management of the entire product production or service delivery system
Operations:
manufacturing and service processes used to transform resources into products
Operations include:
manufacturing produces physical products and services produce intangible products
Supply chain:
processes that move information and material to and from the firm
Supply chain includes:
logistic processes move products, warehousing processes store products, and information makes the process more efficient
Goods are
tangible, less interaction with customers, often homogeneous, and not perishable
Services are
intangible, interaction with customer required, inherently heterogeneous, perishable/time dependent
The Goods-Services continuum has 4 circles
pure goods, core goods, core services, pure services
Pure goods examples
food products, chemicals, mining
Core goods
appliances, automobiles, data storage systems
Core services
hotels, airlines, internet service providers
Pure services
university, medical, investment
Service bundling
refers to a company building service activities into its product offerings
Efficiency
doing something at the lowest possible cost
Effectiveness
doing the right things to create the most value for the customer
Value
the attractiveness of a product relative to its price
Sustaimability
the ability to meet current resource needs without compromising the ability of future generations to meet their needs
Shareholders
individuals or companies that legally own one or more shares of stock in the company
Stakeholders
individuals or organizations who are directly or indirectly influenced by the actions of the firm
Triple Bottom Line
the goal of sustainability means that the scope of the firm’s strategy must focus on these three ares: economic prosperity, environmental stewardship, social responsibility
Environmental means
no harm to the environment
Economic means
prosperity for shareholders
Social means
stakeholders = customers, competitors, suppliers, community you work in
Operations and supply chain strategy
setting broad policies and plans for using the resources of a firm - must be integrated with corporate strategy
corporate strategy
provides overall direction and coordinates operational goals with those of the larger organization
Operations Effectiveness
performing activities in a manner that best implements strategic priorities at a minimum cost
Competitive Dimensions has 3 points of the triangle
cost, quality, delivery or responsiveness
Trade-offs
management must decide which parameters of performance are critical and concentrate resources on those characteristics
Straddling
seeking to match a successful competitor by adding features, services, or technology to existing activities
How do we compete?
cost, quality, delivery or response
Risk is
uncertainty in the environment causes supply chain planners to evaluate the relative riskiness of their operations and strategies in the face of uncertainty in the environment
Supply Chain Risk is
the likelihood of a disruption that would impact the ability of a company to continuously supply products or services
Supply chain coordination risks are
associated with the day-to-day management of the supply chain
Disruption risks are
caused by natural or manmade disasters
3 Steps of Risk management framework
identify the sources of potential disruptions
2. assess the potential impact of the risk
3. develop plans to mitigate the risk
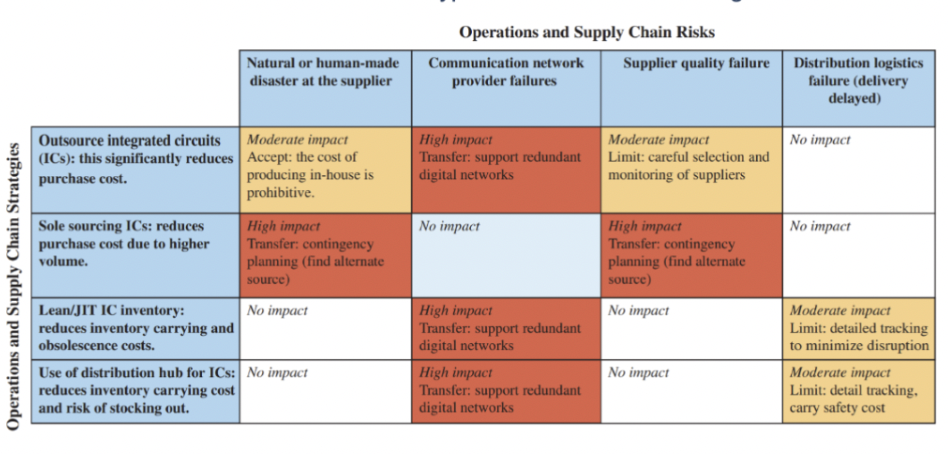
What does the supply chain risk matrix show us?
the level and type of risk for various strategies
Productivity is
a common measure of how well resources are used
Productivity equation
outputs / inputs
Productivity measure is a
relative measure - to compare to something else (similar operations within its industry) (measuring over time within the same operations)
3 Types of Measures
partial productivity, multi factory productivity, total productivity
Partial Productivity
measures the ratio of some output to a SINGLE input
Multifactor Productivity
measures the ratio of some output to a GROUP of inputs
Total Productivity
measures the ratio of ALL outputs to ALL inputs
Forecasting is the basis of
corporate planning and control
2 Different ways of forecasting
Strategic and tactical
Strategic forecast
used to estimate aggregate demand (total demand), informs strategic decisions, medium to long term
Tactical forecasts
use to estimate near-term demand, guide (inputs) to day-to-day demand, short term
Product family forecasts or aggregate forecasts are
more accurate than individual product forecasts
Decoupling points occur when
inventory is positioned in the supply chain to allow processes or entities to operate independently
Forecasts of demand is used to set inventory at
decoupling points to the proper level
2 Types of Forecasting
Quantitative and Qualitative
Quantitative is basically
data and calculations
Quantitative forecasting inclues
time series analysis, casual relationships, simulation
Qualitative forecasting is basically
data and calculations and business judgements
Seasonality can have other cycles like
monthly, yearly, weekly
Cyclicality is
change in demand over many years
Time series analysis is
using the past to predict the future
Short term forecasting time window
less than three months
Short term forecasting is mainly used for
tactical decisions (replenish inventory and scheduling)
Medium term forecasting time window
3 months to 2 years
Medium term forecasting is used to
develop a strategy which will be implemented over the next 6 to `8 months (meeting demand, changing production rates)
Long term forecasting time window
more than 2 years
Long term forecasting is used for
detecting general trends and identifying major turning points
Stationary is where there is
no trend or cyclicality
Other forecasting considerations
accuracy required
2. size of forecasting budget
3. availability of qualified personnel
4. degree of flexibility (can the firm react quickly if the forecast is inaccurate?)
5. consequence of a bad forecast ( important or costly decisions require a good forecast)
Simple moving average forecast is based on
demand over the most recent periods
Simple moving average is useful when
demand is not growing nor declining rapidly and no seasonality is present
Selecting the period length is important because
longer periods provide more smoothing, shorter periods react to trends more quickly
The simple moving average formula implies that
all periods are equally important
The weighted moving average allows
unequal weighting of prior time periods
with the weighted moving average, all the weights must be equal to
one
in weighted moving average, the more recent data is given
more significance than older data
Forecast errors occur when
the forecast value and what actually occurs are different
All forecasts generally contain some
level of error
2 sources of error
bias and random
Bias
when a consistent mistake is made
Random
errors that are not explained by the model being used
Market Research
ask customers needs and purchasing plans with surveys or interviews
useful for demand and product design and planning
may be overly optimistic as customers may act differently than what they say
SURVEYS AND INTERVIEWS
Historical analogy
use demand characteristics from similar related products to create a forecast
Panel of consensus
leverage multiple individuals and more experience to make forecast
“executive judgement” panel when upper management involved in making key forecasts and decisions
could suffer from “group think”
Delphi Method
select experts and develop questionnaire
distribute questions and collect reponses
summarize and distribute results along with new questionnaire
refine forecast by re-cycling through these steps as needed until final result is reached
Capacity
the ability to hod, receive, store, or acommodate
In business, capacity is viewed as
the amount of output that a system is capable of acheiving over a specific period of time
Capacity management considers both
resource inputs and product outputs
3 Capacity Planning Time Durations
long range, intermediate, short range
long range window
greater than a year