Most important terms for exam
1/97
There's no tags or description
Looks like no tags are added yet.
Name | Mastery | Learn | Test | Matching | Spaced | Call with Kai |
|---|
No analytics yet
Send a link to your students to track their progress
98 Terms
Explain risk-return trade-off
Securities that offer greater return also impose greater risk to investors
TIPS bond
Treasury inflation protected bonds
is an indexed bond
R²
Squared correlation coefficient
ratio of total return variance explained by the market return
buying on margin amplifies both upside potential and downside risk
Margin = (value of stock - loan) / value of stock
When buying on margin, an investor borrows money to purchase more shares than would be possible using only their own funds. I
If the stock rises sufficiently it will give a higher return on investments because you initial investment is lower than if you would have bought the stock yourself.
If the stock falls then you have both the loss of the security decreasing in value as well as needing to pay off the loan
Difference between systemic and systematic risk?
Systematic risk
Risk that affects the entire market and connot be eliminated by diversification
Systemic risk
Risk that failure of one or more institutions leads to a breakdown of the financial system due to connectiveness. (crash of 2008)
What is the agency problem
conflict between shareholders and managers (agents)
e.g. managers persuing private benefits
difference between asset allocation and security selection?
Asset allacotion
how to distribute wealth across different asset classes
Security selection
Choice of specific securities within an asset class
Difference between treasury bonds and notes?
Treasury bonds
bonds from the government with maturities > 10 year
Treasury notes
bonds from the government with maturities 2 - 10 year
Call option vs put option
Call option
Right to puchase an asset at a specific exercise (strike) price on or before expiration date
Put option
Right to sell an asset at a specific exercise (strike) price on or before expiration date
Futures contract?
Agreement to buy/sell an asset at a future date for a set price
Money market vs capital market?
money market
short term low risk
T bills
Capital market
long term securities
Bonds, stocks
ask price, bid price and bid-ask spread
ask price
minimum price at which a seller is wiling to sell
bid price
maximum price at which a buyer is willing to buy
ask-bid spread
difference between ask price and bid price
YTM
Yield to maturity
Total annual return earned on a bond if held until maturity
Capital gain?
Profits earned from selling an asset at a higher price than purchase price
Asset vs security
Asset
An asset is anything that has economic value and can generate future benefits.
Security
A security is a tradable financial claim on an asset or on future cash flows.
P/E ratio?
ration of firm’s stock price to it’s earnings per share
high P/E => growth stock
Low P/E => value stock
Buying on margin
Borrowing money to buy more securities than can be purchased with one’s money alone.
If margin accounts falls below the maintenance level, the investor will get a margin call from the broker
Short selling
Selling securities that the seller does not own. The short seller borrows it from a broker, sells them and may be required to cover the short position at any time on demand.
broker usually requires that the seller deposit additional cash or securities as collateral
SEC
Securities and Exchange Commission
IPO
Initial Public Offering
First sale of company”s shares on the public market
Insider information
Non-public information about a firm
limit order
Buy or sell at certain price or better
Unit investments trusts vs managed investments companies
Unit investments trust are essentially unmanaged => portfolio is fixed once established
managed investments companies => portfolio manager may change portfolio composition
Closed-end fund vs open-end funds (mutual funds)
Closed-end funds
are traded like other securities
do NOT redeem shares for their investors
Open-end funs
trade like other securities
WILL redeem shares for NAV (net asse value) at the request of the investors
Net Asset Value (NAV)
NAV = (market value of assets - liabilities) / shares outstanding
Pro’s & contra’s of mutual funds (open end funds)
PRO
Advantage of large scale investors
lower trading costs
easier diversification
CONTRA
management fees and other expenses reducing rate of return
front end loads: sales charges
back end loads: redemption fees
12b-1 charges: marketting
Turnover rate
rate at which a fund buys and sells within it’s portfolio
Nominal rate of interest
equilibrium rate + expected rate of inflation (we can only observe nominal interest rates)
LPSD
Lower partial standard deviation
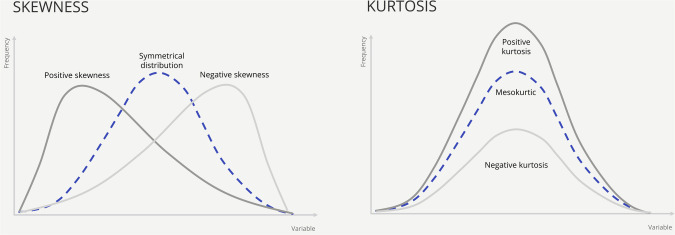
Skew

Kurtosis
Leptokurtic(>3) > mesokurtic (=3) > platykurtic (<3)
Investments in risky portfolios do not become safer in the long run?
On the contrary, the longer a risky investment is held, the greater the risk.
Probability of investment shortfall becomes smaller but ignores the magnitude of potential losses
Difference between Nominal interest rate, APR, EAR and real interest rate
Nominal interest rate
Interest rate not accounting for inflation
Annual Percentage Rate APR
Yearly nominal interest rate (doesn’t account for compounding)
Effective Annual Rate EAR
Real annual interes rate accounting for compounding
Real interest rate
real rate is Nominal rate - expected inflation
Risk free rate
Return on investments with no default risk
Risk premium
Excess return for bearing risk
Excess return
Return above risk free rate
Fair game
Risk premium = 0
Utility function
Investors’ preference toward expected return and volatility
Can be represented graphically using indifference curves
Hedging
Reducing risk by e.g. put option
What do we consider risk free assets
T-bills
Money market funds
CDs: Certificates of deposit
Commercial paper (unsecured)
Sharpe ratio (reward to volatility)
Excess return per unit of total risk
Slope of CAL (capital allocation line): line that goes from the risk free rate through the risky asset (all combinations of risky and risk-free asset lie on that line)
Capital Allocation Line CAL
Line that goes from the risk free rate through the risky asset
all combinations of risky and risk-free assets lie on that line
Degree of risk aversion
Slope of the indiference curve
more risk averse = > steeper curve
Risk averse => Prefers certainty above uncertainty
Risk neutral => only cares about expected return regardless of risk
Risk lover => prefers risk and is willing to accept lower return for more risk
What is the optimal position in the risky asset
Point at which the indifference curve is tangent to the CAL
Passive strategy?
Investment strategy to replicate market performance
Capital Market Line
The CML is the CAL but with the risky portfolio the market portfolio
When is portfolio diversification beneficial
As long as assets are less than perfectly correlated

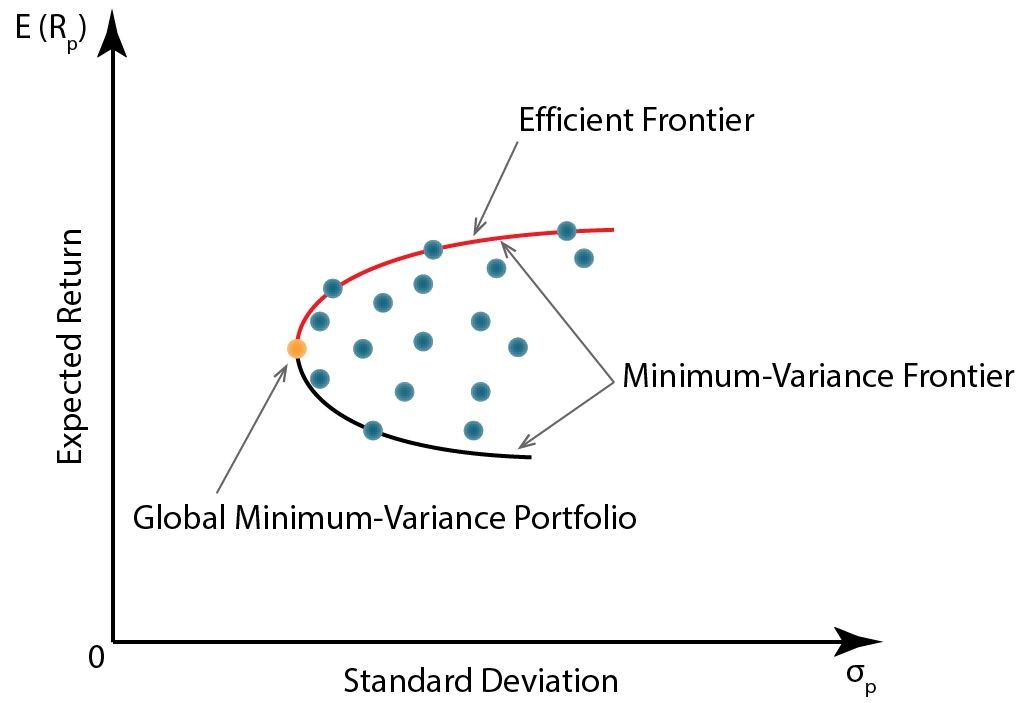
Efficient frontier
Set of portfolios that has the best expected return for a given risk
Rational investors will choose a portfolio on the efficient frontier
Why different for different portfolio managers
Difference in methods and security analysis
If a risk-free asset is available and input lists are identical, all investors will choose the same portfolio on the efficient frontier of risky assets: the portfolio tangent to the CAL.
All investors with identical input lists will hold an identical risky portfolio, differing only in how much each allocates to this optimal portfolio versus the risk-free asset.
CALLED SEPARATION PRINCIPLE
Minimum varianc frontier
Set of portfolios with the lowest variance for each expected return

Is index model inferior to the full covariance (Markowitz) model?
Full covariance matrix invokes estimation risk of thousands of terms. Effect of so many errors will result in a portfolio that is actually inferior to that derived from the single index model
are systematic and firm specific risk macro or micro economic factors?
Systematic risk => macro economic
Firm specific => micro economic
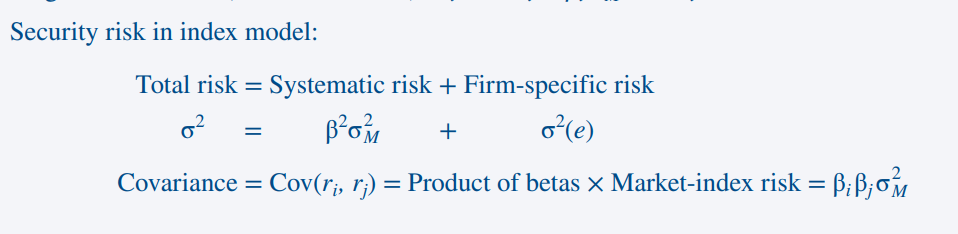
What is the systematic risk of a portfolio or asset in the single index model and what is the covariance between two assets?
systematic risk = β2 σM 2
Covariance between two assets = βi βj σM 2
What is the index model?
Estimated by applying regression analysis to excess rates of return
slope is beta (have a tendency to go towards 1 over time)
intercept is alpha
Regression line is called the The characteristic line (SCL)
What is statistical evidence of market efficiency
Stock prices seem to follow a random walk with no discernible predictable patterns that investors can exploit
What is the Efficient Market Hypothesis (EMH)
Idea that market prices reflect all currently available information there are three forms
Weak
Semistrong
Strong
often advocated by passive investment strategies
What is Weak EMH
All information from past trading data is already reflected in the stock
What is the semistrong EMH
All publicly available information is already reflected in the stock
What is the Strong EMH
All information including insider information is reflected in the prices
Explain abnormal stock returns
Studies usually show that there is some leakage of inside information to some market participants before it goes public
abnormal return = actual retun - expected return
Resistance levels and support levels
Resistance levels => price where stock prices tends to stop rising
support levels => price where stock prices tends to stop falling
Momentum effect
Stocks that perform well in the recent past tend to continue performing well and vice versa
Reversal effect
Stocks that performed well/poor in the past tend to reverse
P/E effect
Stocks with low P/E ratio earn higher average returns than high P/E ratio
small-firm effect
Small cap stocks earn higher average returns than large cap stocks
neglected firm effect
stocks followed by few analyst earn higher average returns
book-to-market effect
Firms with high book to market ratio outperform stocks with low book to market stocks
book to market = (assets - liabilities)/total value outstanding shares
What are convertible bonds?
Bond that can be converted into shares of issuing firm
Floating rate bond?
Coupon that adjust periodically according to a refference rate (fixed premium overe a reference short-term interest rate)
Credit default swaps?
Insurance against the default of a bond or loan. The swap buyer pays an annual premium to the swap seller but collects a payment equal to the lost value if the loan later goes into default
Investment-grade bonds vs speculative-grade bonds (junk bonds)
low default risk
high default risk
Sinking fund
bond issuer repays part of par value before maturity
Subordination clauses
Determines priority of claims in case of bankruptcy
Debenture bond
Unsecured bond with no collateral
CDO (collateralized debt obligation)
pools debt instruments and tranches them by risk
AAA
AA
A
BBB
BB
B
Term structure of interest rates
The term structure of interest rates describes the set of spot rates for different maturities, derived from default-free zero-coupon bonds.
forward rate
A forward rate is an interest rate agreed upon today for a loan that will occur in the future.
Expectation hypothesis
long term rates reflect future short term rate
Liquidity preference theory
long term rate = expected short term rate + liquidity premium
Liquidity premium?
Liquidity premium = forward rate - expected short rate
Yield curve
showing yield to maturity on bonds
bond stripping
separating a coupon bond into
individual ZCB (one per coupon)
one ZCB for principal
bond reconstitution
reverse of bond stripping
spot rate
yield on a ZCB for a given maturity
short rate
spot rate for shortes maturity
What is duration?
the weighted average time until you receive the bond’s cash flows
Convexity
curvature of a bond’s price-yield relationship
Immunization
Immunization is a bond portfolio strategy that protects a portfolio’s value against interest rate changes by matching the portfolio’s duration to the investment horizon.
Modified duration
Adjusts for the level of interest rates
rebalancing
adjustinging portfolio to meet target duration
cash flow matching
cash flow matches future liabilities
dedication strategy
hybrid between cash flow matching and immunization
Describe appropriate performance measures
Sharpe
Information ratio (appraisal
Treynor
Jensen (alpha)
Sharpe => when portfolio represents the entire investment fund
IR => when portfolio is an active portfolio to be optimally mixed with the passive portfolio
Treynor => when the portfolio is one subportfolio of many
Jensen (alpha) => all of these measures require a positive alpha for the portfolio to be considerd attractive
Treynors measure
excess return per unit of systematic risk
Jensen alpha
abnormal return relative to CAPM (capital asset pricing model)
Information ratio
The appraisal ratio measures a manager’s alpha per unit of idiosyncratic (residual) risk.
Survivorship bias
arises when only surving funds are included in performance analysis²
bogey
target benchmark a portfolio aims to beat