Exercise physiology: Cardiac
1/45
There's no tags or description
Looks like no tags are added yet.
Name | Mastery | Learn | Test | Matching | Spaced |
|---|
No study sessions yet.
46 Terms
Cardiac Output
Cardiac Output = Heart rate x stroke volume
Heart rate on a average: 70 beats per min
Stroke volume: 70-80ml (end diastolic volume - end systolic volume)
Cardiac output at rest: 5L/min
HR does not drive cardiac output. (Athletes have a lower resting and maximal HR).
End Diastolic Volume
Effected by:
Filling time: HR
Filling amount: Venous return, cardiac out and blood volume of the peripheral blood.
End Systolic Volume
Effected by:
Ventricular preload
Ventricular contractility
Ventricular afterload
Determinants of SV: Ventricular preload.
filling volume, or the degree of stretching of the ventricle
Preload is directly proportional to the EDV, the greater the EDV the greater the stretching of the ventricle.
Cardiac Output during exercise
Resting Q: 5-6 L/min
Sedentary Gmax: 20-22L/min
Athlete Qmax: 35-40L/min
Cardiovascular Control - Nerves
HR and oxygen uptake are linearly related
Increase in sympathetic nerve stimulation, accelerates SA node and increases HR = tachycardia (noradrenaline)
Parasympathetic (vagus) fibres, decreases heart rate via vagus nerves = bradycardia (acetylcholine)
Cardiovascular Control Centres
Medulla Oblongata of the brain stem contains the control centre for the cardiovascular
Afferent signals from baroreceptors
Sends corrective signals via the nervous system and vi hormone release.
HR During Exercise
HR response is rapid due to anticipatory increase by central command
Parasympathetic tone decrease, Sympathetic output increae
As exercise continues, HR is increasingly controlled by catecholamine release.
Stroke volume during exercise
Rest:
Untrained:70ml
Trained: 100ml
Max Exercise:
Untrained: 110ml
Trained: 180ml
Increasing SV during exercise
Increased Venous return: increase ventricular filling during diastole - Frank Starling’s Law
Normal ventricular filling followed by powerful contractions
Training adaptions - increased load volume
Ventricular Cntractility
Positive ion tropic effect: increases contractility
Negative ion tropic effect: decreases contractility
Effected by
ANS activity
Hormones
Changes in ion concentrations
Response to Prolonged Exercise - Cardiovascular drift
SV gradually decreases
HR gradually increase
Why:
Blood flow redirected to skin - sweat
Therefore plasma volume decreases (due to movement into interstitial fluid).
Capillaries
0.01mm in diameter
5% of total blood volume
Around each capillary is a pre-capillary sphincter. A ring of smooth muscle that controls diameter
Blood pressure
Normal SBP: 110-120mmHg
Normal DBP: 70-80mmHg
Hypertension: SBP > 140, DBP > 90
Hypotension: SBP < 100, DBP < 60
BP = Q x Total peripheral resistance
Hypertension and exercise training
Regular aerobic exercise reduces SBP and DBP: 6-10mmHg
Exercise as (preventative) medicine:
- reduced SNS ( decreased resistance)
- Increased renal function (removal of sodium = decreased fluid) (less fluid = less pressure)
BP during Initial stage of exercise
increased SBP during first few mins of steady-state exercise
- SBP generally levels off: 140-160mmHg
- DBP remains relatively unchanged

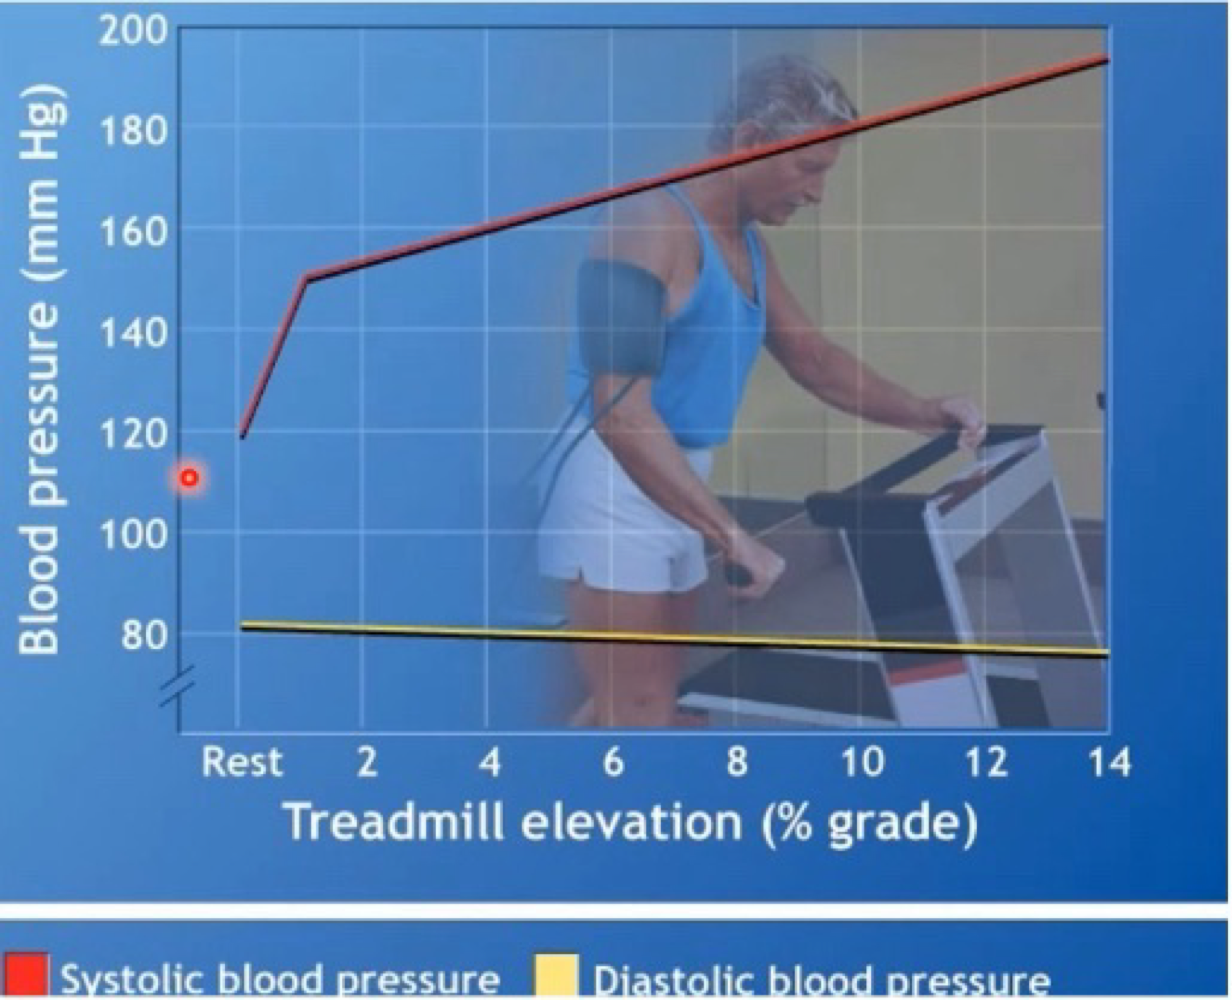
BP during maximal graded exercise
Linear increase in SBP proportional to workload
SBP can > 200mmHg of higher during max exercise = most likely sue to a large cardiac output (increased venous return = increased cardiac output = increased blood flow)
DBP remains relatively stable during exercise
BP during steady state exercise
rhythmic muscular activity = vasodilation to active muscles = decreased total peripheral resistance = increased blood flow
Venous valves: one way flow
Muscle pump: increased pressure
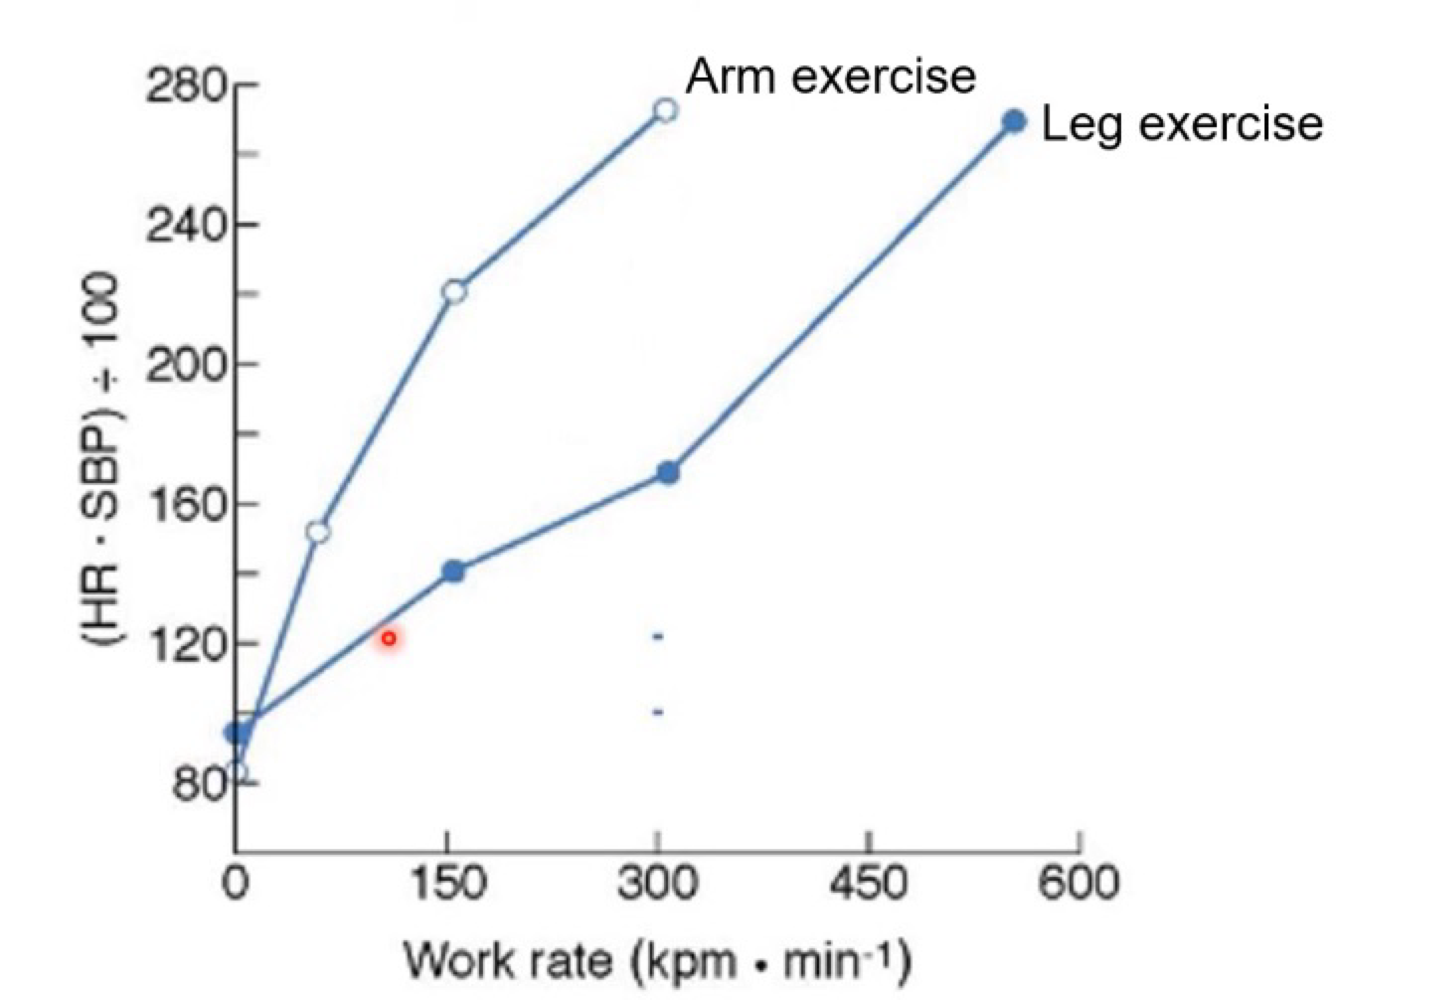
Rate Pessure Product
Indirect index of myocardial oxygen consumption (VO2 of the myocardium
RPP = SBP x Heart Rate
Healthy = 20000mmHg per min or higher
Insufficient = 16000mmHg per min or lower.
Thermoregulation - Body temperature
Range of 36.1 - 37.8ºC (typically 37ºC)
At 41ºC Brain Death Begins - Alberto Salazar 1978
Gaining Heat
Metabolism - can increase 20 times above resting levels
Environment - Solar radiation from objects that are warmer than the body
Heat Transfer - Conduction
Rate of conductive heat loss depends on
The temp gradient between skin and surrounding surfaces
Thermal qualities of the surrounding surfaces (water absorbed heat faster than air therefore heat is lost 25 times faster)
Heat Transfer - Convection
Transfer of heat by the motion of a gas or liquid across a heat surface
Conduction and convection accrounts for 10-20% heat lost to surrounding air.
Heat Transfer - Radiation
TRansfer of heat in the form of infrared rays
Primary heat loss mechanism at room temperature
Heat Transfer - Evaporation
Heat loss during the “phase-shift” of a liquid to a gas
Primary source of heat loss when exercising
Heat lost at rest
60% through radiation
40% through, conduction, convection and evaporation
Heat loss at Exercise
During intense exercise:
Most cooling via evaporative sweat loss (80%)
1L of sweat evaporation = 580kcal heat loss
Evaporation - Rate of Heat loss
Effect by:
Surface area exposed to air
Temperature of ambient air
Convective air movement around the body
Relative humidity of air
Relative Humidity
The amount of water in them being air compared tot the total quanta of moister it can hold
Expressways a percentage
When humidity is high the ability for evaporation to occur diminishes.
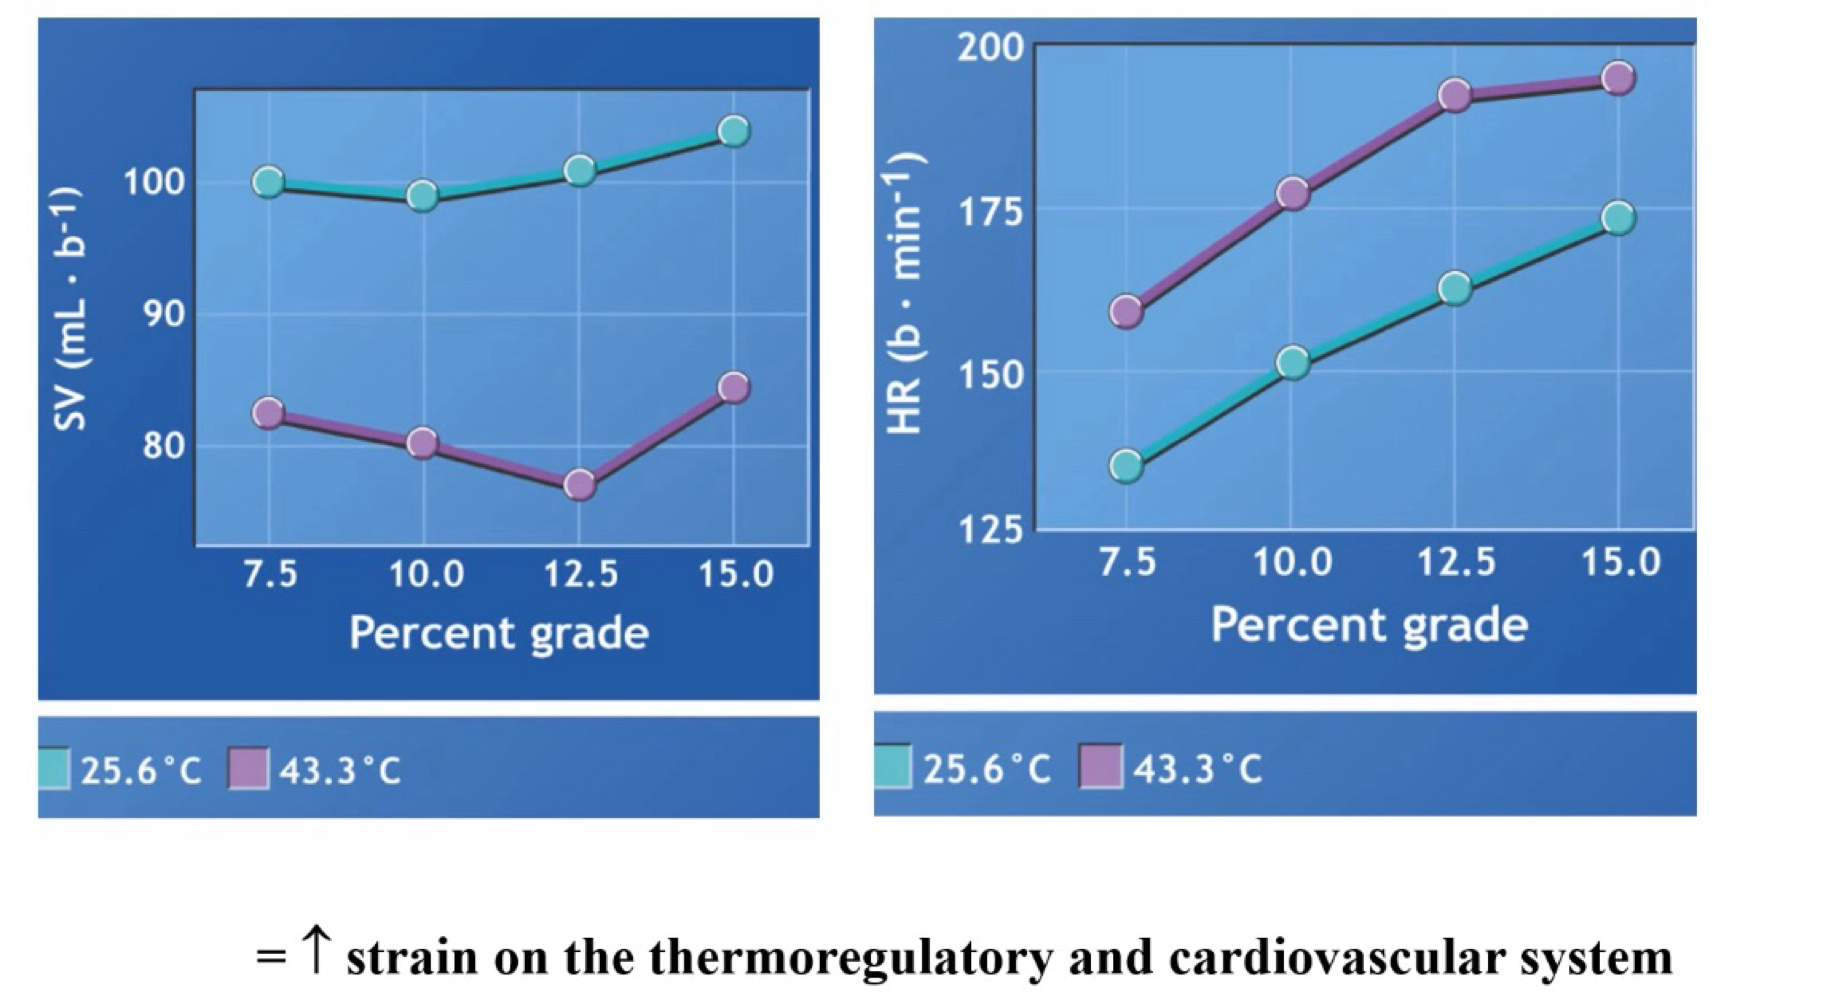
Exercise in Hot and/or humid environments
15-25% of cardiac output passes through the skin during heat stress.
Sweating increases to cool the skin and blood = plasma loss = lower SV = Higher HR to maintain cardiac output.
Max sweating rate =. 3L/hr
Fluid replacement
Pre-exercise: 400-600ml to H2O 60min before
During exercise: 150ml per 15-20min
Post-exercise: 1.5 x sweat loss (change in wieght)
Blood Flow during exercise
During Exercise, blood is redirected to the areas where is is needed. And restricted in areas it is not needed.
During heavy exercise, muscles receive 80-85%
Regulation of vessel diameter
resistance depends on radius of thee blood vessel
Double radius = increased volume + flow
Halving diameter = increased resistance x 16
Effect of Exercise - Blood Flow
Autoregulation - local metabolites act on arterial wall
Extrinsic neural control - stiffin veins
Blood Flow exercise effect - Autoregulation
Response in changes in the local chemical and gas environment
vasodialtion occurs when:
Decrease in PO2
Increase in PCO2
In crease in temperature
Decrease in pH
Increase in nitric acid
Increases in adenosine, ATO, K+
Blood flow Exercise effect - Exrinsic Neural Control
SNS stimulation = release of hormones (epinephrine and norepinephrine) that cause a generalised vasoconstriction
Secondary response to autoregulation
In areas that need extra blood SNS stimulation decreases
Functional Sympatholysis
SNS activity Lo increases to skeletal muscle during exercise by the action is inhibited by the local metabolites to blunt the contraction.
Venous Valaves
One way flow
Break up the continuous colum into smaller sections
Muscle pump
generates: 90mmHg pressure
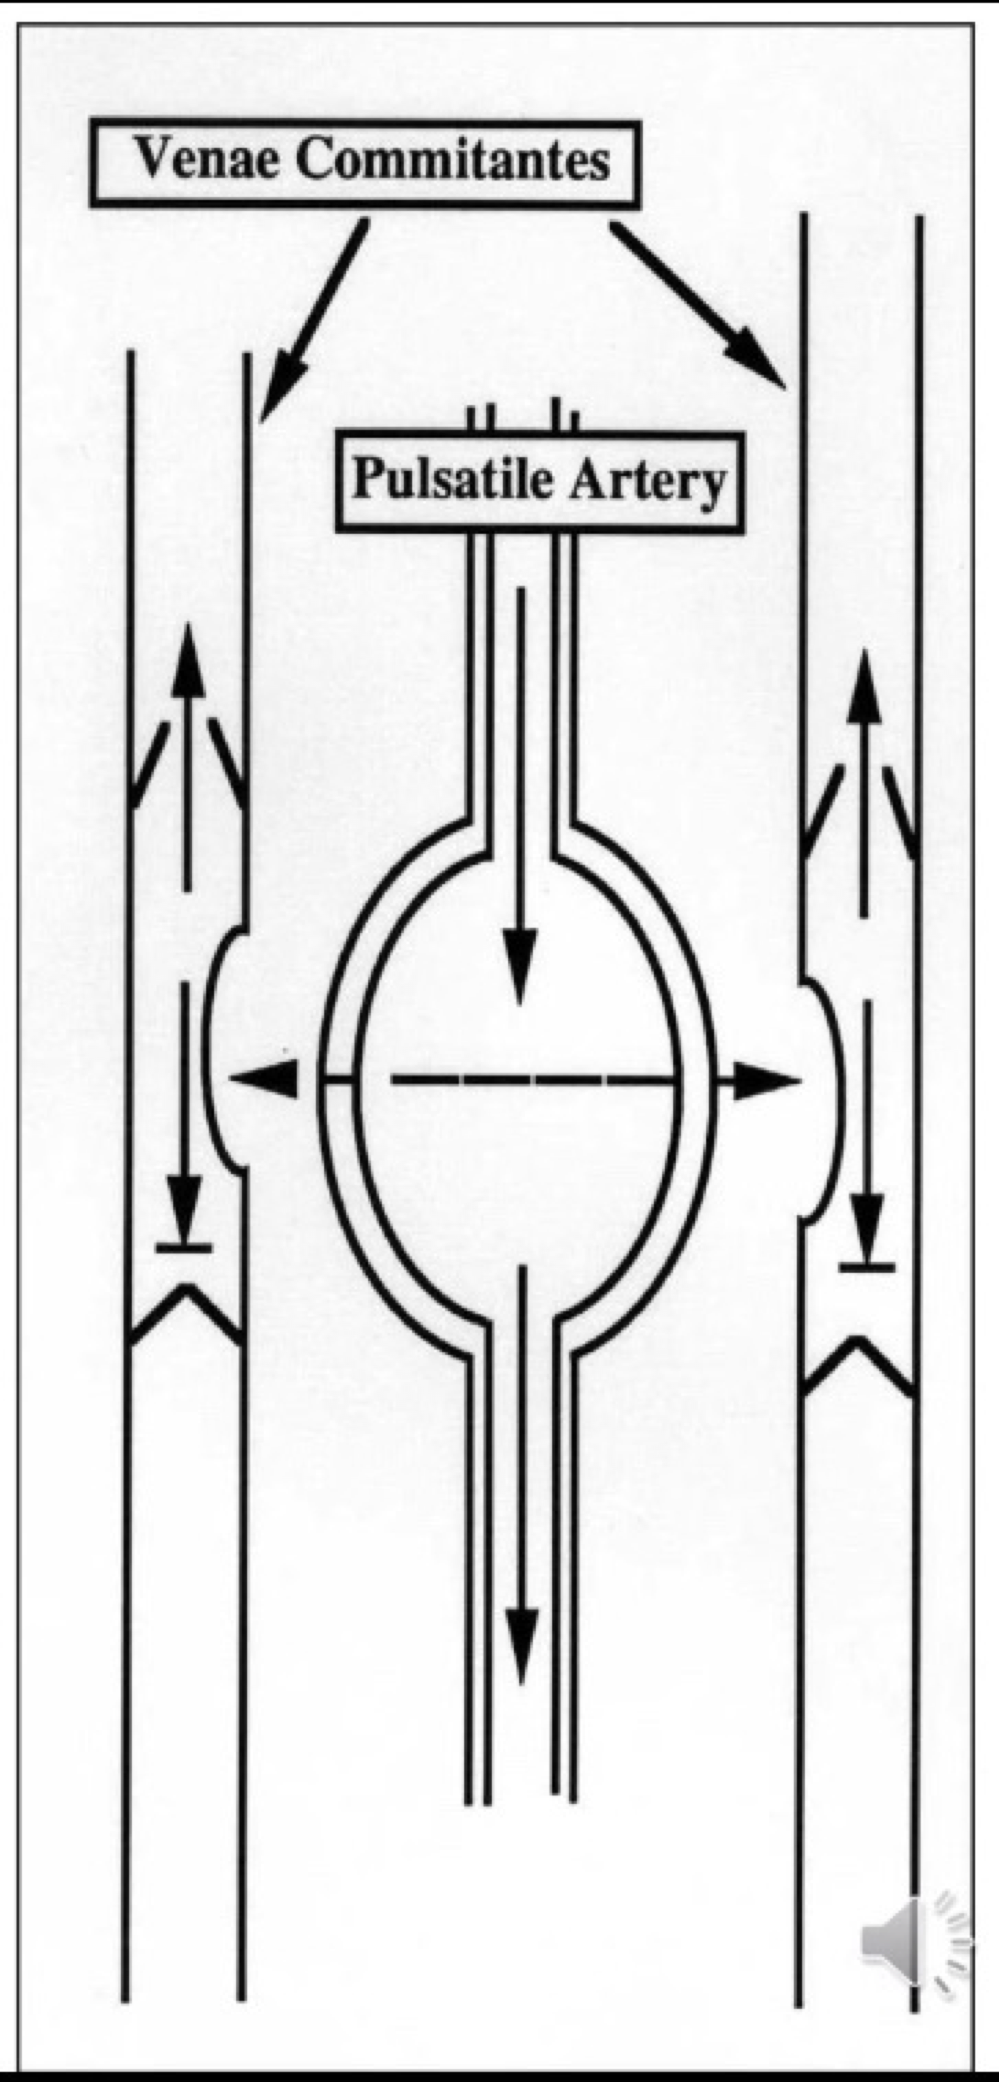
Countercurrent Flow Mechanism
As Pulsatile artery receives blood it expands and pushes on veins, allowing blood to be pushes in one direction as the venous valves don’t allow blood flowing back
Baroreceptors
Pressure-sensitive sensors located in aortic and carotid bodies
Send Afferent signals to the medulla
Baroreceptor Feedback
Pressure = (HR x SV) x TPR
PNS inhibition: HR, SV decreases
SNS activiation: increase HR and SV, thereby Q as well as increases TPR
Chemoreceptors
Monitor changes in chemicals in the blood: PO2, PCO2 and H+
Located in aortic arch and carotid sinus, ventrolateral medulla
Lab - Aerobic Power Index
THR - 220-age x 0.75
Calculate the difference between HR at the nd of the last workload and the second last workload
Calculate the difference between THR and the HR recorded at the second last workload
Apply these two figures (second step/ first step)
Times step 3 fraction by 25 watts and add to the watts of the second last workload.
Divide total watts by participants body-mass to find watts/kg
Lab - Submaximal exercise test
VO2 max:
RER > 1.15
Blood lactate of > 8mM
Maximal HR reached
Increased VO2 of < 150ml between the averages of the last two workload (last min).
Blood Lactate during test
Sharp increase in blood lactate measurements
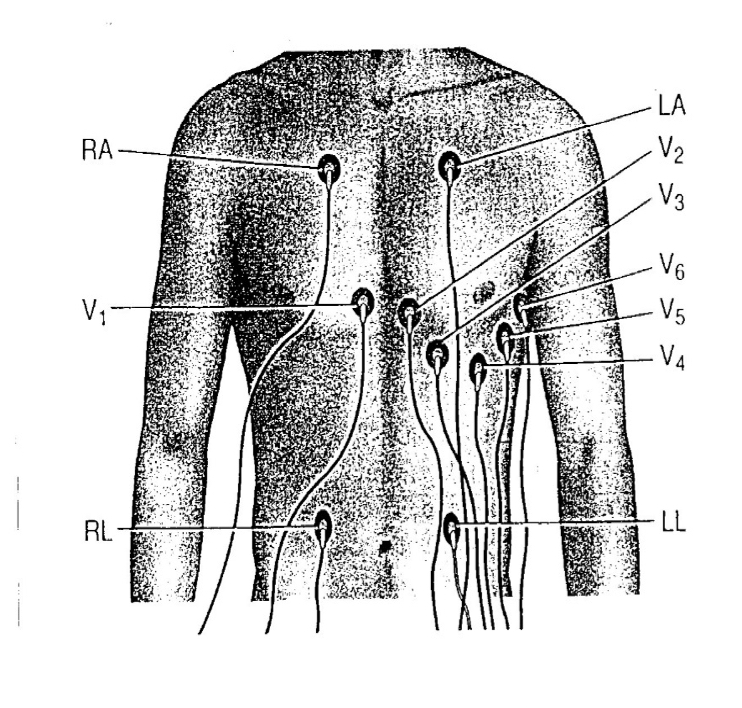
Lab - ECG
12 lead ECG Placement;
RL (right leg): just above the right iliaccrest on midclavicularline
LL (left leg): just above the left iliac crest on midclavicularline
RA (right arm); just below right clavicle medial to deltoid muscle
LA (left arm): just below left clavicle medial to deltoid muscle
V1: on right eternal border in 4th intercostals space
V2: on left eternal border in 4th intercostals space
V3: at midpoint of a straight line between V2 and V4
V4: on mid-clavicular line in 5th intercostal space
V5: on anterior axillary line, 5th intercostal space
V6: on midaxillary line, 5th intercostal space