Instrumentation
1/152
There's no tags or description
Looks like no tags are added yet.
Name | Mastery | Learn | Test | Matching | Spaced |
|---|
No study sessions yet.
153 Terms
What are Binary numbers?
the basis of digital computers
– Values are either ‘0’ or ‘1’ (0=off and 1=on)
A single Binary digit is a bit and a group of 8 binary digits is a byte
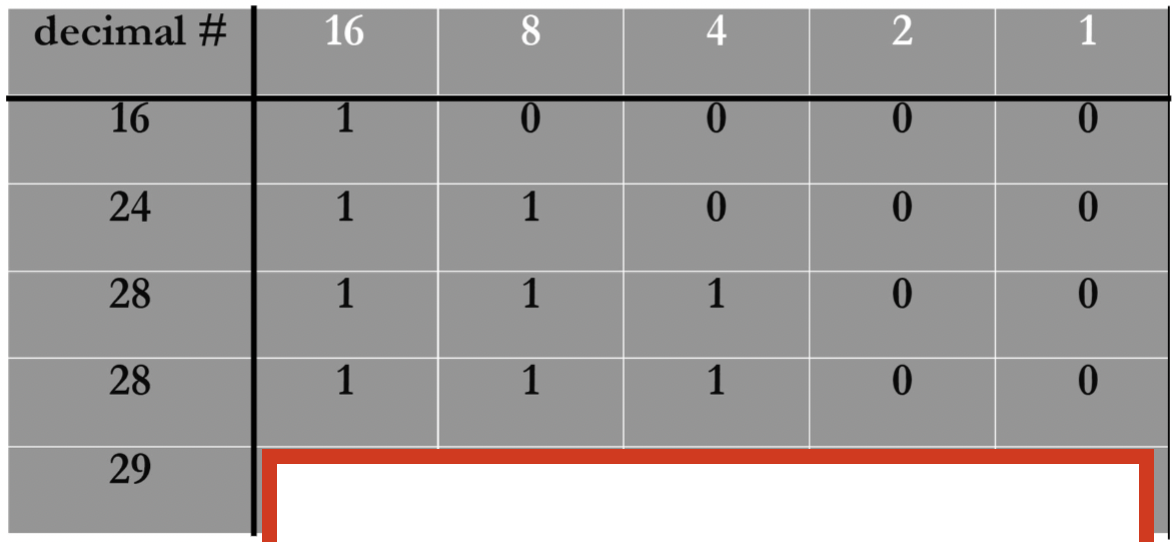
How would you express 29 as a binary number?
we know in a 5 bit sequence the highest number you can get is 16, so first subtract (29-16=13) since 29>16 we put a 1 there, then continue on until you get to zero (13-8 and 13-4) your answer should be 11101
How would you Convert 00001101 to Base 10
=13
first you write down the binary number and assign powers of 2 to each digit, starting from the right: ( always start with 2^0)
Position:  2^7 2^6 2^5 2^4 2^3 2^2 2^1 2^0
Binary:     0   0   0   0   1   1   0   1
Calculate the decimal value for each bit (where the bit is
1, if its zero ignore it):2^0=1 (rightmost bit)
2^2=4
2^3=8
Sum the values where the binary digit is
1:8+4+1=13
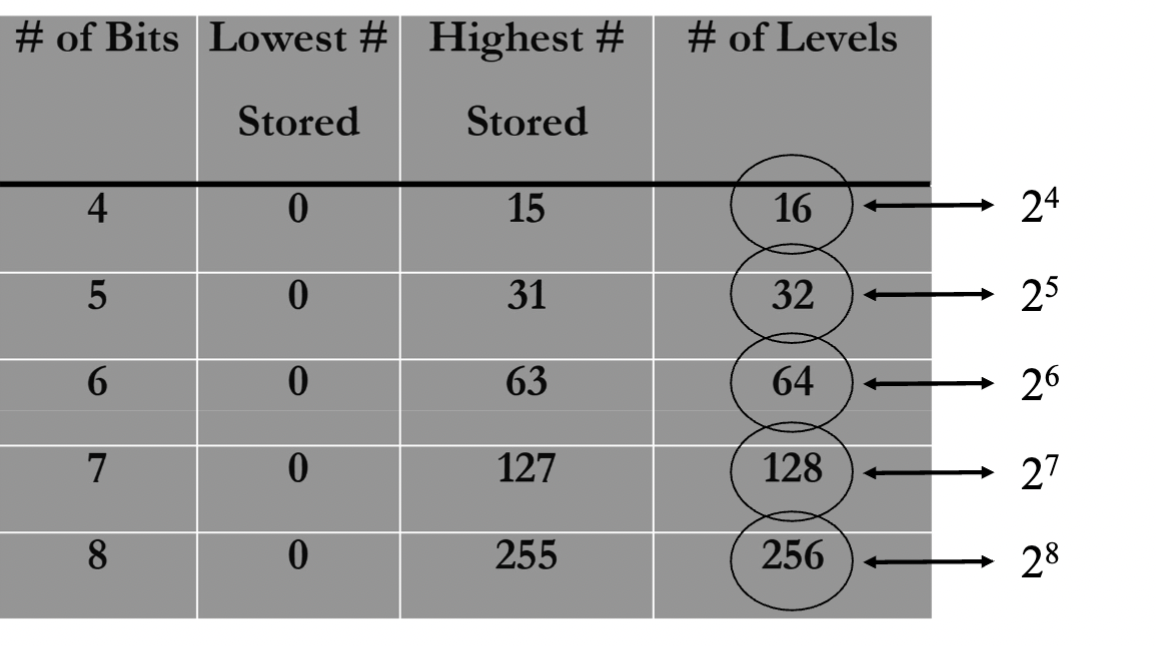
What do the number of bits determine? how do you find the number of levels for binary numbers?
# of bits determines system resolution, and the # of bits is fixed in system hardware
the number of levels is 2 to the power of the number of bits. ( ex: 4 bits= 2^4 levels)
REMEMBER: Number of levels is not the highest number stored, this is because the highest stored starts at 2^0, so the highest stored is always 1 less than the number of levels. ( look at image for help)
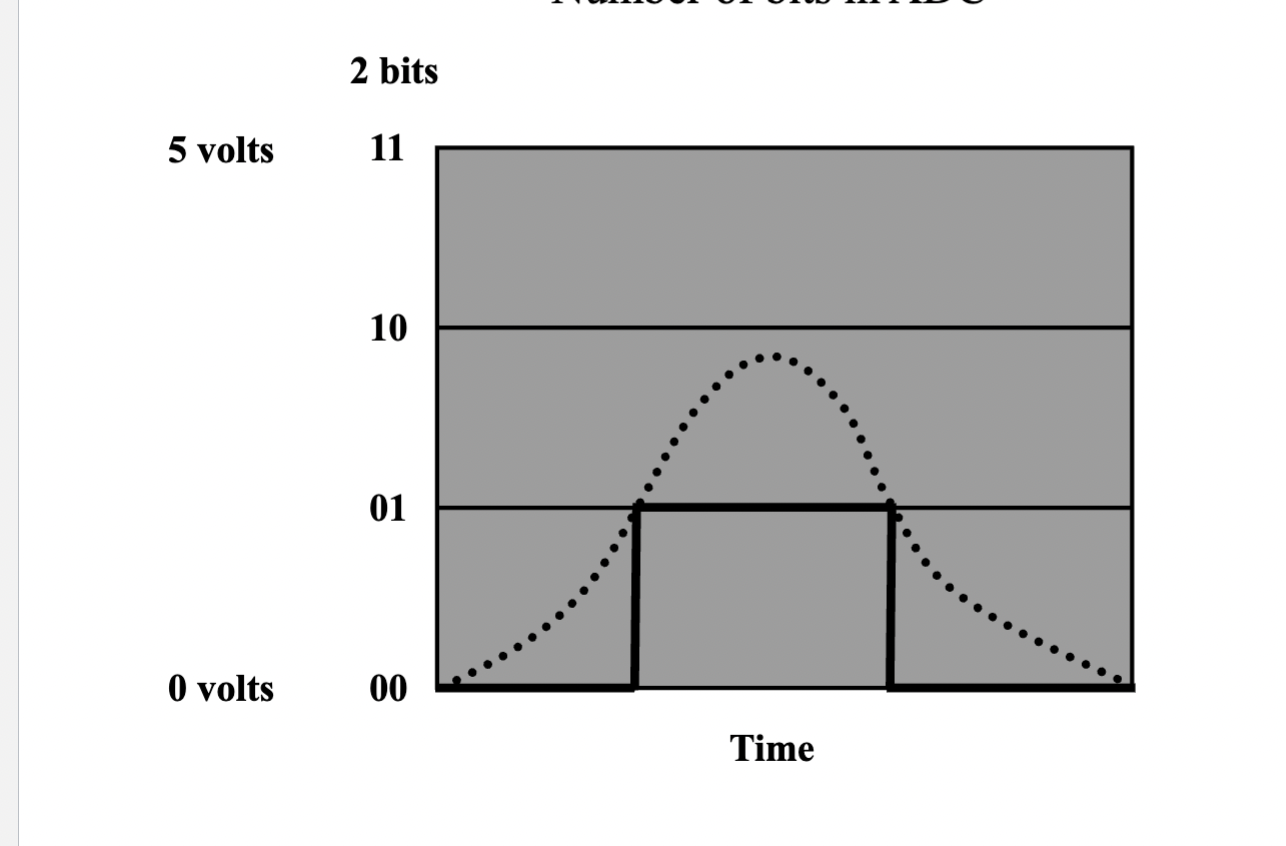
What is analog to digital conversion?
Analog:  ~~~~~~~  (continuous wave)
Digital: |_|-|_|  (sampled steps)
We first get the Analog Signal: Continuous, smooth waves
then it gets digitized, each sampled value is rounded to the nearest fixed level (bit depth determines precision).
( if u want to see visually click on image)
If we have more bits we have better amplitude res. but if we have a faster clock we have better temporal res.
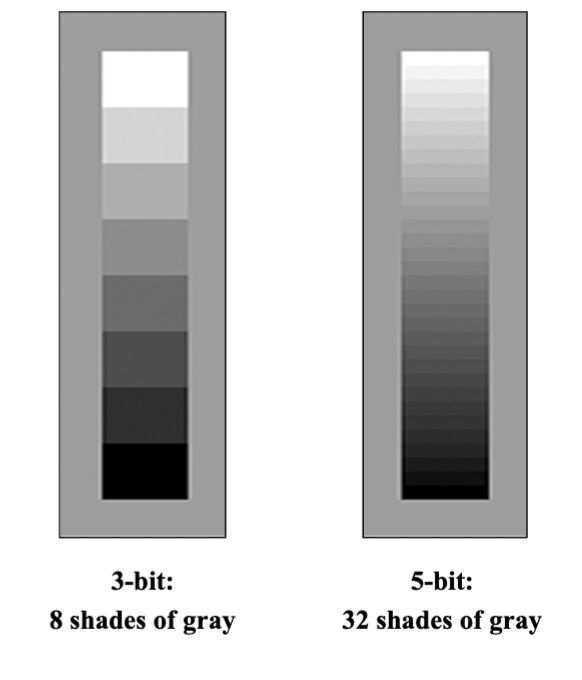
What is contrast resolution
the ability of the display to distinguish between echoes of different intensity
- depends on the number of bits per pixel in the memory
3-bit: 8 shades of gray
5-bit: 32 shades of gray
What happens to our spatial representation when we inc. the number of pixels?
our resolution improves. More pixels capture finer details and reduce "blockiness," allowing the digital image to better approximate the smoothness and precision of the real-world scene.
What are the pulse parameters? include equations
PRP = “Pulse Repetition Period” time until pulse repeats itself: 1 / PRF
PD = “Pulse Duration” temporal pulse length or the time the pulse lasts
DF = “Duty Factor” Measure of active time within a cycle PD/PRP
SPL = “Spatial Pulse Length” the physical length of pulse (# cycles/pulse) x (λ)
What determines detail resolution in ultrasound imaging?
Axial resolution: Along the beam (depth). Improved with higher frequency. (↓depth = better). Depends on pulse length. AX res.= ½ (SPL) or ½ (c * PD)
Reflectors must be separated by this distance (DEPTH WISE) in order for individual echoes to be distinguished.
REMEMBER: smaller SPL= improved Ax Res.
Lateral resolution: Across the beam (side-to-side). Improved with narrower beam focus. (↓ beam width = better). Depends on focus.
Reflectors must be separated by at least this distance in order for individual echoes to be distinguished ( Horizontal direction)
generally 10 times worse than ax res.
What are the two sources of sound beam attenuation
Reflection and scattering
Absorption: when acoustic energy is converted into heat energy
• Average attenuation rate in tissue: 0.8 dB/cm/MHz
• Attenuation is directly dependent on frequency: the higher the frequency, the greater the attenuation.
What happens in the Reception phase, ( the processing of returning echoes, the signals received after they reflect off tissues)
Amplification ( gain) and TGC
Gain control amplifies all received signals
TGC (Time-Gain Compensation) adjusts gain at different depths to correct for attenuation
Does NOT affect transmit power—only enhances received echoes for clearer imaging.
What happens during signal processing, and how is it used in ultrasound?
Modulation: Encoding information into a signal from its amplitude and/or frequency
Amplitude Modulation (AM): The strength (brightness) of the ultrasound wave
Frequency Modulation (FM): The frequency shifts to encode details, detects motion.
Demodulation: Extracts the original information by removing the carrier wave, leaving only the diagnostic signal.
Purpose: Improves signal clarity and reduces noise in ultrasound imaging.
Modulation embeds data; demodulation figures out info from signal and pulls out the stuff of interest.
Why is the raw ultrasound echo called a "Radio Frequency (RF)" signal?
The raw RF signal is received prior to processing. It’s called "RF" because its frequency range (2–20 MHz) overlaps with radio waves (e.g., AM/FM bands).
Before processing: This signal contains all the echo data (depth, strength, motion) but appears as a noisy waveform.
Key Point: The RF signal is the first step—like raw camera footage before editing into an image.
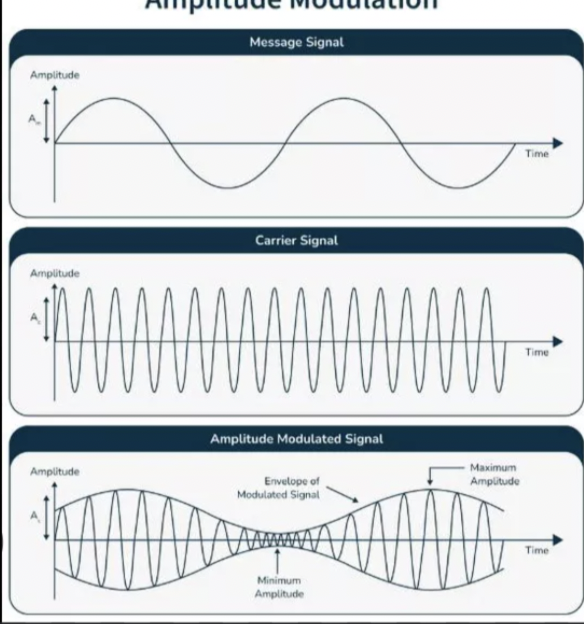
What goes into Amplitude modulation
The information: The original signal containing the information to be transmitted
Varies in amplitude and frequency over time.
Depicted as a waveform
The carrier signal: A high-frequency sinusoidal wave that "carries" the message signal.
Has Constant amplitude and frequency.
Amplitude Modulated Signal (Output Signal): The result of modulating the carrier signal with the message signal.
The amplitude of the carrier wave varies in proportion to the message signal.
The frequency of the carrier remains unchanged.
the modulated signal's envelope mirrors the shape of the message signal.
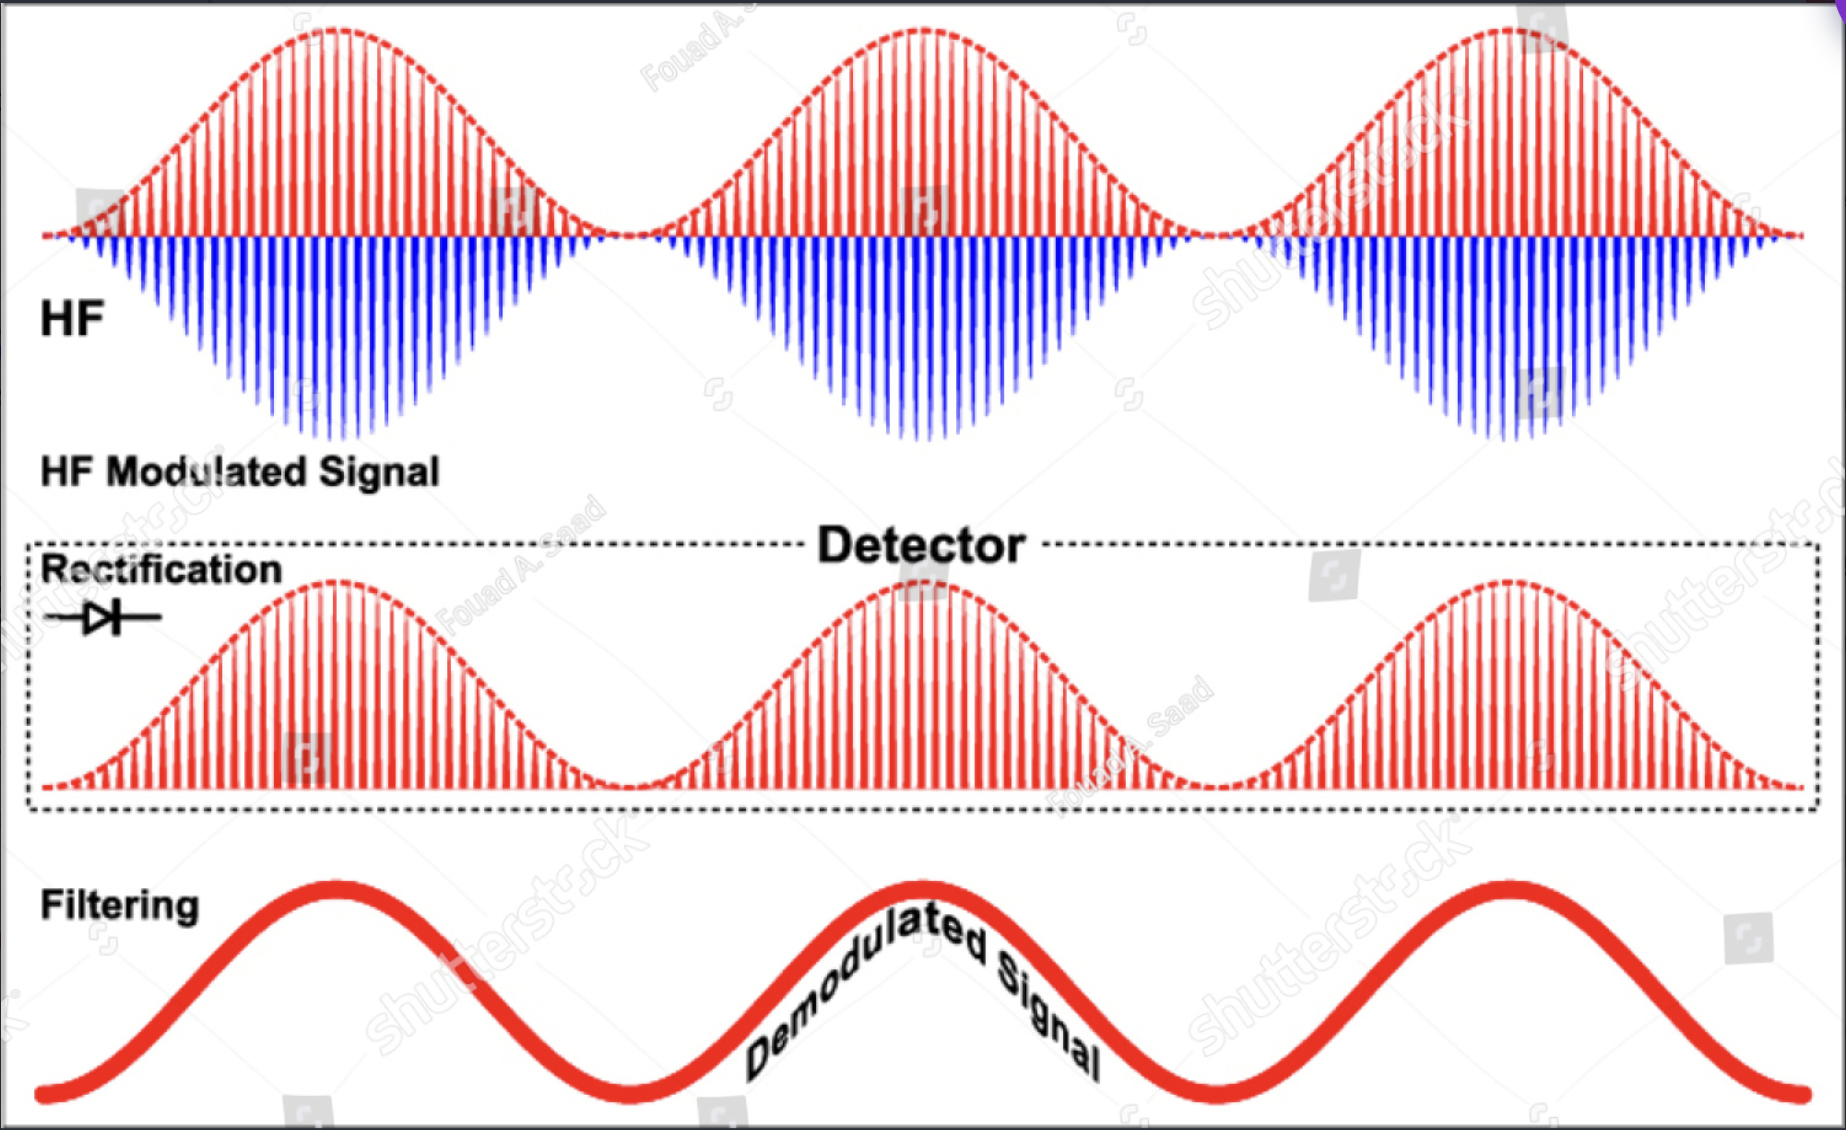
What are the steps to amplitude demodulation?
Amplitude Demodulation is the process of extracting the original message signal from an AM waveform. It involves:
1. Rectification: Converts the modulated signal into a positive-only signal.
Achieved by taking the absolute value ( flips negatives)
2. Envelope Detection: Connects peaks with a low-pass filter. This smooths the rectified signal to recover the message.
Passes low frequencies (message signal).
Rejects high frequencies (carrier signal remnants).
Purpose: Separates the carrier wave from the modulating waveform to reconstruct the original information.
What is dynamic range? How does it relate to compression
the ratio of the largest to the smallest signal
Compression reduces differences between the smallest/largest amplitudes for practical signal processing.
Scales signals by powers of 10 (decibels).
Formula:
dB=10log(I1/ I2)
where I1 is the Intensity of Signal 1 (output) I2 is the Intensity of Signal 2 (input).
What is the relationship Between Contrast, Dynamic Range, Compression & Gain
Lower DR = Higher contrast (narrower range of intensities → more distinct differences).
Higher DR = Lower contrast (wider range → smoother gradients).
Higher compression = Lower DR = Higher contrast (steep input/output curve).
Lower compression = Higher DR = Lower contrast.
Gain: Shifts the region of interest (ROI) or the "window" of signal levels being displayed.
Increases/decreases brightness without altering DR or compression.
Works with compression to highlight specific signal levels.
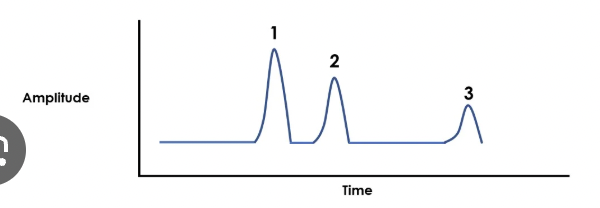
What is A-mode
(Amplitude Mode) The height of each spike corresponds to the strength of the returning echo. A-mode provides 1D data (depth and intensity only)
The horizontal axis represents time/depth
What is B-mode
(Brightness Mode) Echo intensities are displayed as brightness levels (grayscale) on a screen.
The brightness of each pixel corresponds to the strength of the returning echo.
The position of each pixel represents the spatial location of the reflector
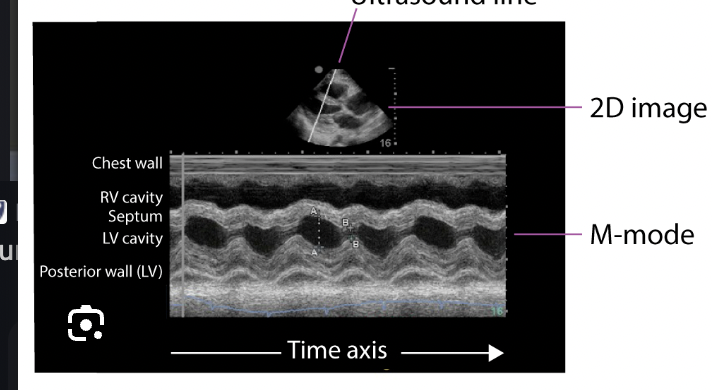
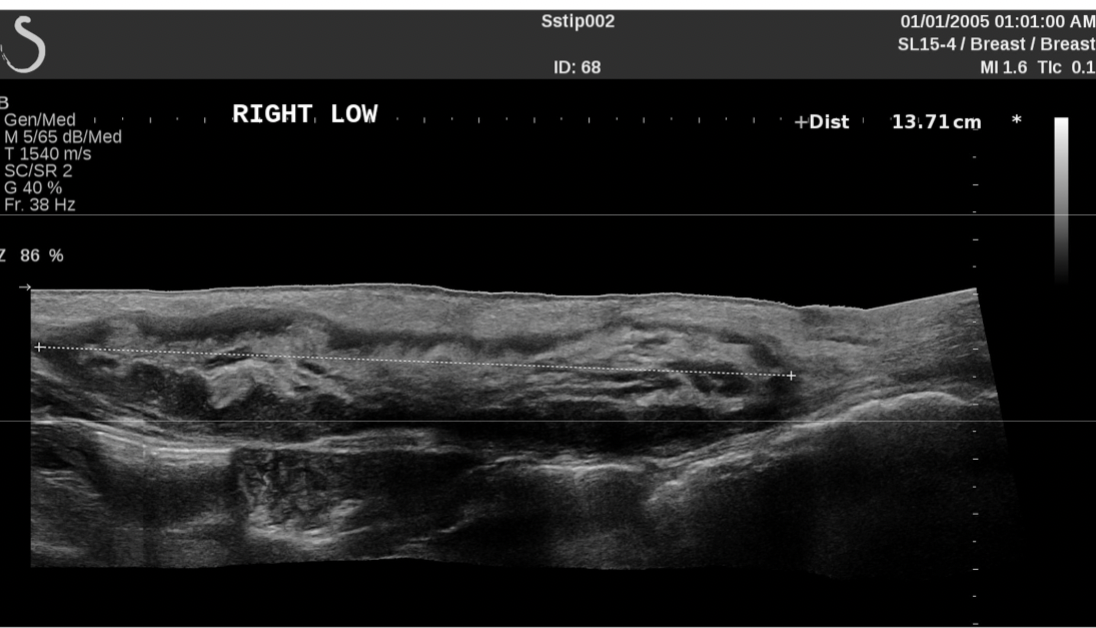
What is M-mode
(Motion Mode) displays movement of structures along a single ultrasound beam over time.
Y-axis: Depth of the reflector.
X-axis: Time.
Brightness: Echo intensity.
Measures velocity of moving structures (e.g., heart walls)
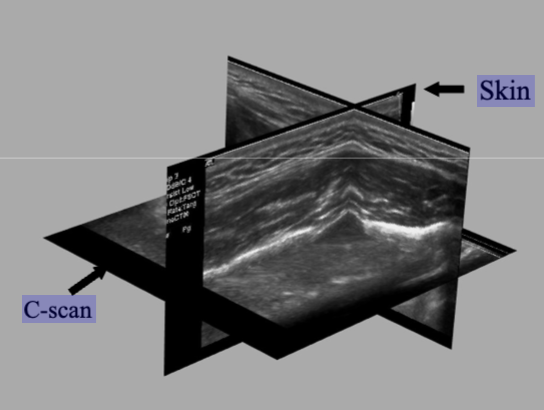
What is c-mode
(Constant Depth Mode) displays a 2D image of echo intensities in a single horizontal plane at a fixed depth, perpendicular to the sound beam.
Depth is fixed: Only echoes from one selected depth are shown.
Brightness: Represents echo strength (like B-mode).
Used for: Mapping superficial structures ( skin, muscles).
What is the first step to create an Ultrasound image. ( include the diff modes)
Basic Signal Processing
RF echo demodulation: Extracts information from returning echoes
Amplitude measurement: Determines echo strength
Phase measurement: Used for Doppler analysis, tracks the timing shift in echo waveforms compared to the transmitted pulse. It detects tiny changes in signal timing ( Measures changes smaller than a wavelength)
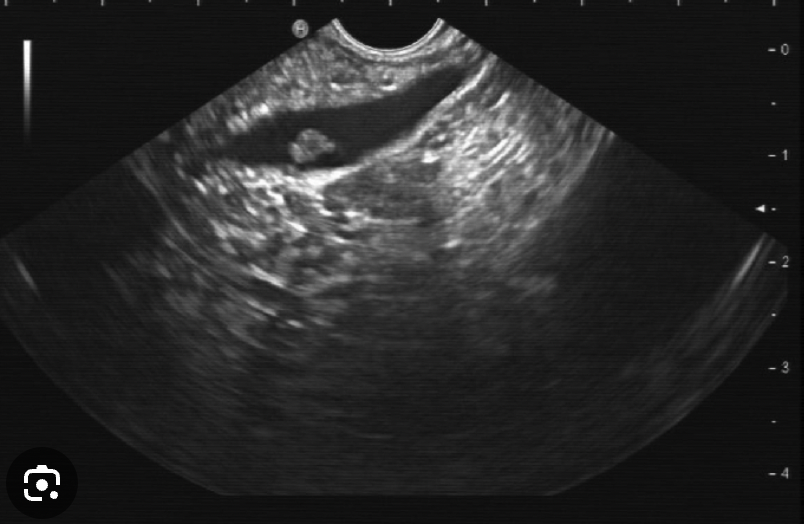
For B-mode: 2D Image Creation (B-scan)
Beam is swept across skin surface
Pulses repeated rapidly to build image
Multiple scan lines create cross-sectional view
Example: Standard abdominal ultrasound
M-mode Imaging
Beam held stationary
Repeated pulses show motion vs. time
C-mode Imaging
Adds depth gate to B-mode
Beam moved perpendicular to propagation
Shows constant-depth slice (for Superficial structure imaging)
Faster beam movement → Better temporal resolution
More scan lines → Better spatial resolution
What is the Processing Sequence for Ultrasound Image Formation
Echo Reception & Attenuation
Reflectors create echoes, but amplitudes weaken with depth.
You can use TGC to Boost deeper echoes to help uniform amplitudes across depths.
Demodulation: Converts RF signals into measurable amplitudes
Amplitude Quantization: Assigns echo strengths to differing gray levels
Scan Conversion: Stores depth-mapped brightness values in memory for display.
Echoes → TGC → Demod → Amplitude → Scan converter → Modes (B or M mode)
What is static 2D B-mode
Building up a 2D image line-by-line.
Multiple transducers
Scan time of 1-2 minutes
What does a scan converter do? how did it improve early displays
Converts raw echo data into a digital image format for display.
Stores both:
Echo amplitude (brightness)
Spatial location (depth/position)
Made modern B-mode imaging possible by:
Preserving echo strength data.
Allowing post-processing
How does a digital scan converter determine spatial and contrast resolution in ultrasound imaging
Stores echo strength (amplitude) and location (depth/width) as digital values in a 2D matrix.
The 2D matrix size and the image field of view determines the pixel (spatial) resolution.
Pixel size= (axis length)/ (# of Pixels) Axis length varies but number of pixels is constant.
we want to keep the axis length/field of view as small as possible for the best resolution.
What is the relationship between spatial resolution and contrast resolution
Spatial res: pixel size
Contrast res: # of bits per pixel
More bits= finer res.
What is temporal resolution in ultrasound and how does frame rate affect it?
Temporal resolution = ability to accurately depict moving structures over time; determined by frame rate (frames/sec).
Typical video display: 30 fps
Higher frame rates = better temporal resolution
Cine-loop: can save at higher rater for frame-rate clips for detailed analysis
Monitor types:
CRT: 30 Fps ( frames per sec)
LCD: 60 Hz (standard refresh rate)
What is the equation for Max frame rate and PRF
FR max= c/2Rn ( R= depth n=# of scan lines per frame) or PRFmax/n
PRF max= c/2R
Use minimum possible imaging depth to maximize frame rate
How do you solve for theoretical frame rate ( not Max) and system frame rate
FR= PRF/n ( theoretical frame rate)
System FR= ( number of frames)/ seconds ( ex: Terason saves the last 3 seconds of imaging before you hit “freeze. so you’d divide number of frames by 3 sec)
doesn’t mean the system was using its highest possible frame rate — it might’ve been running slower based on your settings (like depth, line density, etc.).
How do you inc. Frame rate
↓ Line density this will ↑ Frame rate, but ↓ lateral resolution
(Fewer lines = faster, but less detail side-to-side)
↓ Lines/angle this will ↓ Field of view and ↑ Frame rate
(Less area to scan = quicker images)
↓ Depth this will ↓ Time to send/receive pulses which ↑ Frame rate
(Shallower = faster scanning)
Lateral res depends on beam width but what else?
line density, it degrades when line separation is greater than beam width ( remember trade off with FR)
What are the advantages and disadvantages of a single element transducer
Advantages of a Single Element Transducer:
Symmetric beam – uniform shape
Inexpensive
Small footprint – good for tight spaces
Sensitive Doppler – picks up flow signals well
Disadvantages:
No 2D image – can’t create a full picture
Fixed focus – can’t adjust focus depth for better resolution
What are the advantages and disadvantages of Mechanical Scanner
Advantages:
Provides 2D image
Symmetric beam
Cheaper than electronic arrays
Annular array (if used) can allow for variable focus
Disadvantages:
Fixed focus (unless annular array is used)
More expensive than single element
Motion artifacts (from moving parts)
Parts wear out over time due to mechanical movement
What are the advantages and disadvantages of Electronic arrays
( Linear, Curvalinear, Phased and linear ( hockey stick))
Advantages:
Provides 2D image
No moving parts → more durable (except annular array)
Variable focus → better resolution at different depths
Disadvantages
More expensive
Asymmetric beam (except annular array)
Acoustic noise
Cross-talk: When signals from one part of the transducer interfere with signals from nearby parts, causing noise or errors in the image.
Grating lobes: Extra "fake" echoes that appear in the image because the sound waves spread out too much from the array.
Which type of resolution is typically best in ultrasound: axial, lateral, or elevation?
Elevation beam width (up and down) is usually larger than the lateral beam width (side to side), meaning the elevation resolution is typically worse than the lateral resolution.
( Perpendicular to image plane)
Axial resolution (front to back) is the best, followed by lateral resolution (side to side), and elevation resolution (up and down) is usually the least sharp.
So, the order from best to worst resolution is: Axial > Lateral > Elevation
What’s the difference between sequenced and phased array operation in ultrasound?
Sequenced: Only a subset of elements fires at a time; image is formed by activating groups in sequence.
Phased: The entire group is activated at once; image is steered electronically by varying activation timing.
How are ultrasound array transducers constructed based on their element arrangement?
Linear: One straight row
Curvilinear: Elements arranged in a curved line (like an arc or semi-circle)
Annular: Concentric rings
Multi-dimensional: Multiple rows of elements for 2D or 3D imaging
Transducer elements in a linear electronic array is not symmetric, this is referring to the shape of the elements and beam. ( still arranged in a straight row)
What is phasing in ultrasound arrays?
Phasing means sending tiny time delays to each element so the ultrasound beam can be electronically steered or focused.
What are the key differences between array types?
Linear sequenced: fires in a row, focuses with phasing
Curvilinear: like linear, but curved
Phased array: uses all elements, steers from center with phasing
"Phased" = describes how the beam moves (not necessarily the shape).
Vector array: mixes sequencing + phasing for flexible scanning
1.5-D array: multiple rows of elements vertically, allowing for better focusing in the elevation plane (thickness dimension).
What’s the difference between a linear sequenced array, phased array, and linear phased array?
Linear Sequenced Array: Elements in a line, fired in small groups one after another to create a rectangular image.
Phased Array: All elements fire with time delays to steer the beam — great for small spaces (like cardiac imaging).
Linear Phased Array
A linear array (straight row of elements) that uses phasing to steer the beam
Allows for trapezoid or angled scan formats ( think of wide scan)
More flexible than basic linear sequenced arrays
Basically: linear shape + phased control
Linear = shape
Sequenced vs. Phased = how it’s operated
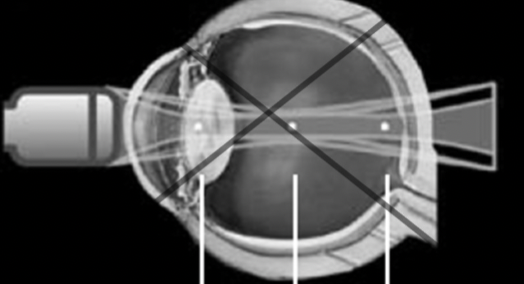
What is an annular array
type of transducer where the elements are arranged in concentric rings ( bullseye pattern)
Concentric elements: The elements are arranged in rings, not a straight line.
Variable focus: By using phasing (adjusting the timing of each ring’s firing), the system can focus at different depths.
Symmetric beam pattern: Because of the ring arrangement, the beam pattern is more even in all directions, which improves image quality.
Mechanical scanning: Unlike electronic arrays, the scanning is done by physically rotating or moving the array, so it’s more like a mechanical scanner.
( can scan different parts of eye bye focusing at different depths)
How do steering delays do in ultrasound arrays?
Relative time delays: The time delay between elements ensures that the echoes are received in phase (synchronized).
Transmit and receive delays: Delays for both transmitting and receiving are the same to keep the beam focused and improve image quality.
Why is this beneficial, it introduces time delays between the elements in the array, causing the beam to focus and point in a specific direction.
The time delays between elements are measured in nanoseconds
What does it mean when a 1-D array can adjust the lateral beam pattern?
A 1-D array transducer is made of a single row of elements that can electronically control the ultrasound beam from side to side (laterally). This adjustment helps focus the beam at different depths and directions, improving lateral resolution and allowing better visualization of structures that are side-by-side.
What is array focusing in ultrasound? How does it work
Array focusing uses electronic delays to shape and steer the ultrasound beam toward a focal point.
Off-axis elements have a longer path to the focal point and need an earlier (larger) delay.
On-axis elements are closest to the focal point and fire later.
This coordination ensures all echoes converge in phase at the focal point
the largest delay corresponds to the shortest distance to the focus. ( usually in middle)
In electronic focusing what are the transmit and receive strategies.
Transmit: Transmit, multiple transmit, aperture focus
Receive: Receive, dynamic receive ( dynamic focus), Dynamic aperture
What is transmit in electronic focusing
Pulse is transmitted once for all depths on a given line
- One focal point for a transmission pulse
What is multiple transmit in electronic focusing, whats the tradeoff?
Sends a second pulse with different timing and adds in more focal zones (combines data from different depths to create the 2d image.
This will improve lateral res. but will dec. frame rate so worsen out temporal res
What is aperture focus in electronic focusing
Aperture focus refers to adjusting the number of active elements in the transducer's aperture to control the focus depth.
Larger apertures focus better at deeper depths
This results in a deeper near field and a less divergent far field
More elements are added to the transmit aperture for deeper focal zones
What is receive in electronic focusing
applying time delays across the transducer elements to align echoes from a specific depth.
Echoes from a given depth reach the center of the aperture first, then the edges
Receive delays are used to synchronize these signals for improved image clarity
Simplest design: match the receive focus to the transmit focus
receive = applying time delays to help focus during echo reception
What is Dynamic receive (Dynamic focus) in electronic focusing
Dynamic receive focusing continuously adjusts the receive time delays during the echo
This allows the system to maintain optimal focus at varying depths as echoes return
Example: delays are updated every 13 microseconds to focus at each centimeter of depth
Improves lateral resolution throughout the entire image
What is dynamic aperture in electronic focusing
Dynamic aperture is the process of adjusting the number of active transducer elements during the receive period to maintain optimal focus at different depths.
Larger apertures improve focus at deeper depths
Creates a deeper near field and less divergent far field
The system adds more elements to the aperture as echoes return from deeper structures
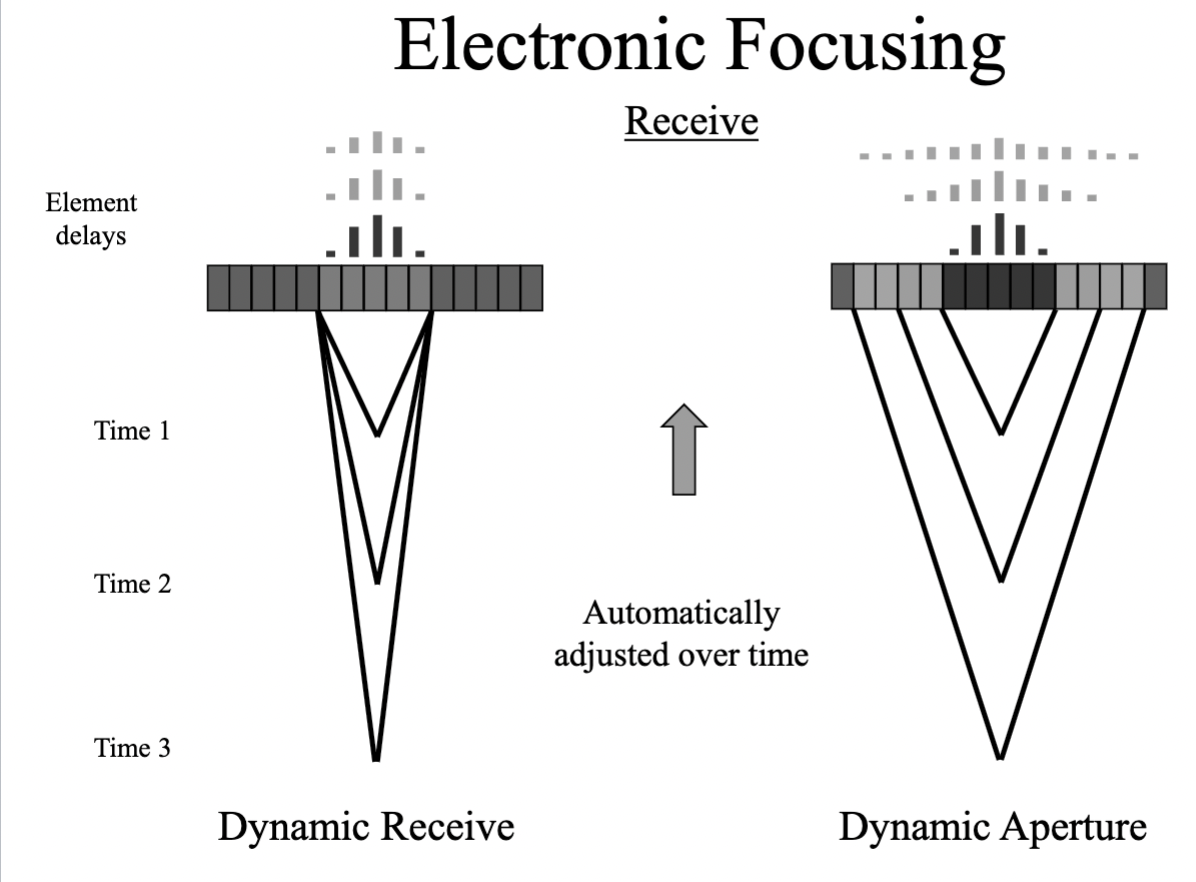
Whats the difference between dynamic recieve and dynamic aperature
Dynamic receive = tweaking time delays during echo return.
Dynamic aperture = tweaking how many elements are listening at each depth.
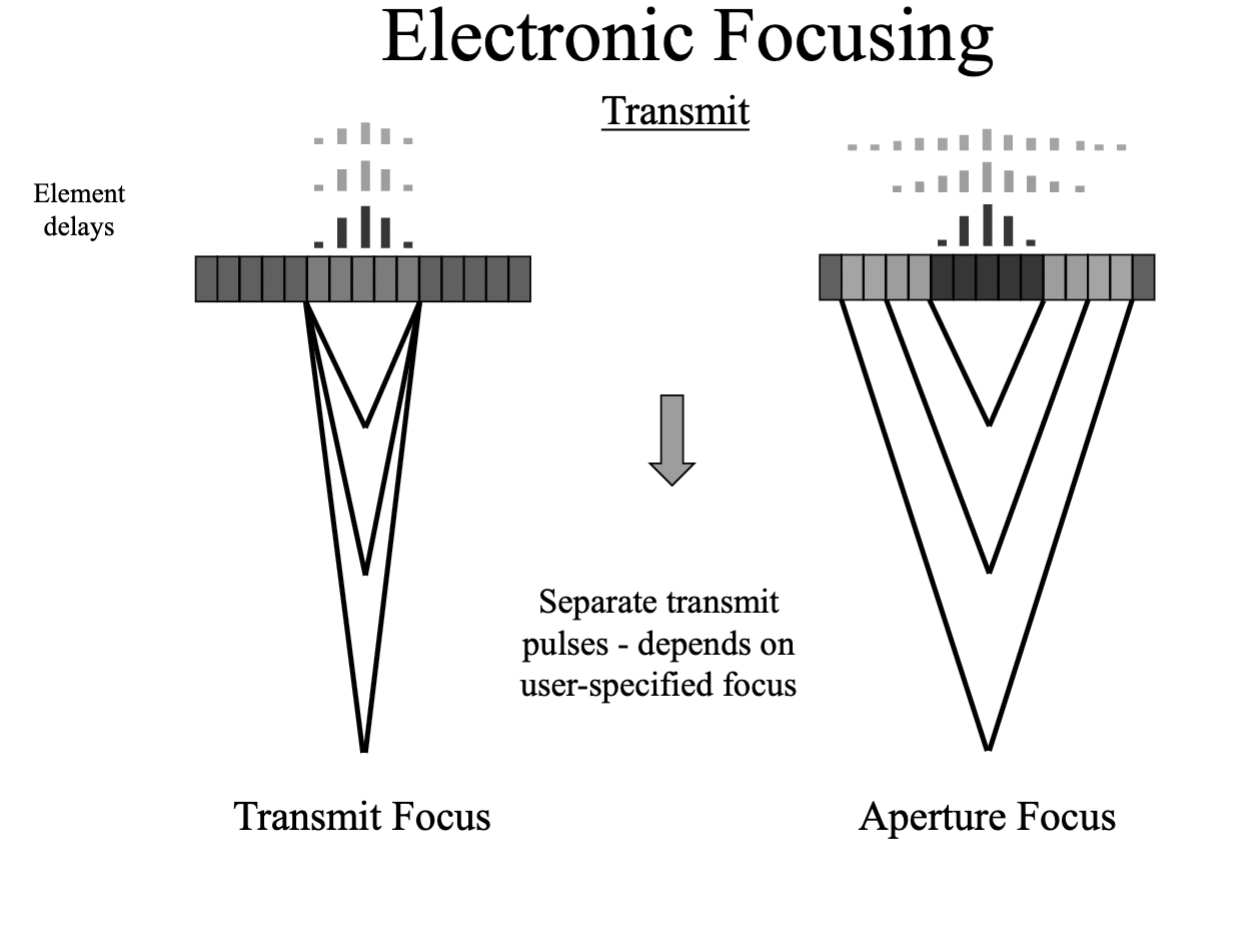
Whats the difference between transmit focus and aperture focus
Transmit focus = where the beam is focused when sent.
Aperture focus = the depth you can focus at, based on how many elements are active. ( this gives us multiple focal zones depending on how many elements are active)
Out of all the electronic focusing strategies, which ones are user controlled and not user controlled
user controlled: transmit and multiple transmit
Not user controlled: aperture focus, receive, dynamic receive, dynamic aperture.
REMEMBER: electronic focusing methods affect lateral resolution only
• NOTE: electronic focusing is based on assumed sound speed in tissue
• Non-uniformities in real tissue degrade focusing compared to theoretical values ( EX: going through bone or fat)
What is phase aberration, and what are its effects
Occurs when sound speed ≠ assumed soft-tissue average (1540 m/s).
Sound speed > 1540 m/s → signals arrive earlier (e.g., in dense tissue, calcifications).
Sound speed < 1540 m/s → signals arrive later (e.g., in fat, fluid).
Effects:
Transmit (C): Focus misalignment (incorrect delay calculations).
Receive (D): Echo mistiming → blurring, misplaced structures, loss of resolution.
Result: Degraded image quality due to wavefront distortion in heterogeneous media.
What factors determine array resolution in ultrasound?
1. Axial Resolution
Depends on: Spatial Pulse Length (SPL = wavelength × # cycles).
Better resolution: Shorter pulses (higher frequency, fewer cycles).
2. Lateral Resolution
Determined by: Beam width (narrower = better).
Controlled by:
Electronic delays (beam steering/focusing).
Aperture size:
Larger aperture → narrower beam (better at depth).
Dynamic aperture: Adjusts # active elements with depth.
3. Elevation Resolution (Slice Thickness)
Depends on: Fixed lens + array geometry (e.g., 1D vs. 1.5D arrays).
Improvement: Matrix arrays (electronic elevation focus, makes it adjustable)
What is slice thickness ( elevation resolution) measurement in ultrasound and how is it determined
Slice thickness refers to the vertical height of the image produced by scattering from an inclined plane.
It's measured at different depths by translating the scanhead in the beam elevation direction.
Elevation focus, which affects slice thickness, is determined by the acoustic lens.
Slice thickness varies with depth
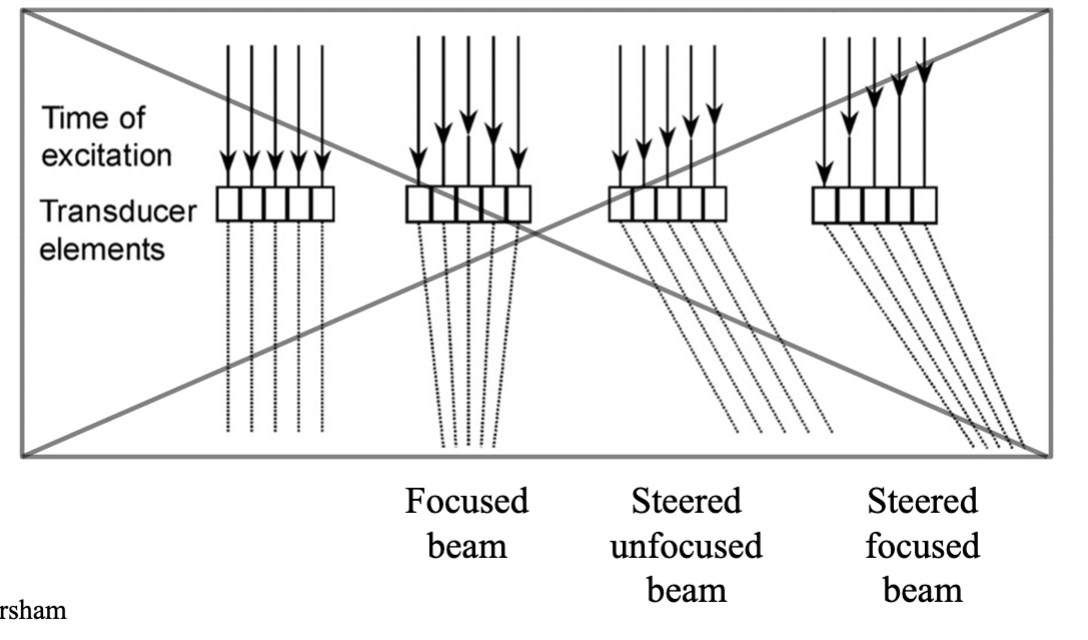
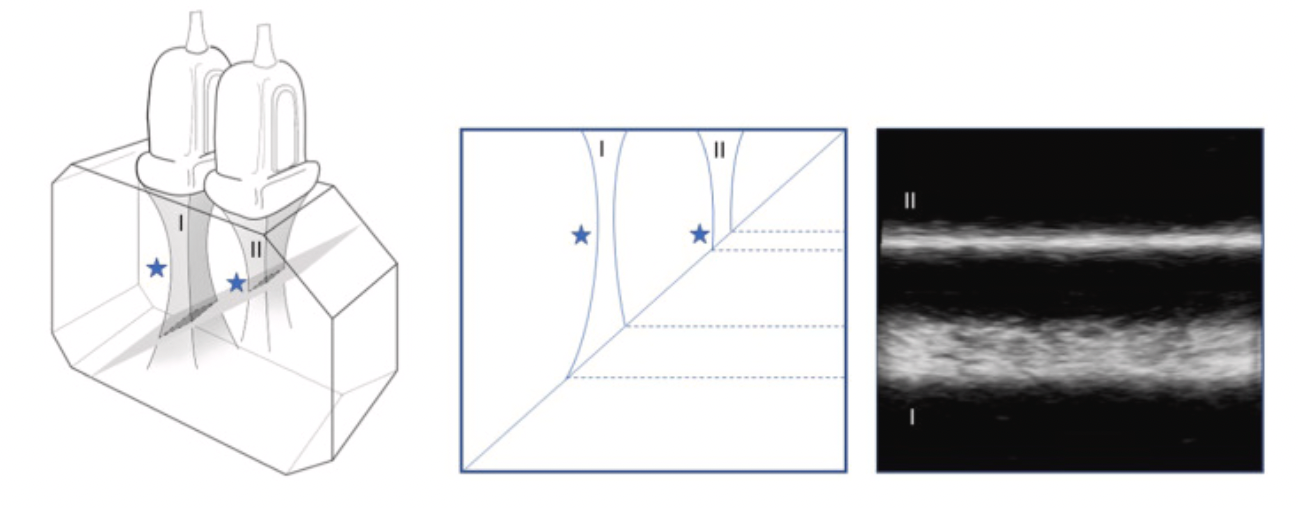
How do the following ultrasound array beam types appear and function?
Focused beam
Steered unfocused beam
Steered focused beam
Focused beam: has a Straight beam path, most focused point will be in the middle, with the longest delay. ( improves lat res. at a specific depth)
Steered unfocused beam: Elements are linear, angled beam direction No focal narrowing, beam remains broader
Steered focused beam: beam is angled and converges at a focal point. Elements are fired with delays to both steer and focus the beam, Elements fire in a non-linear, staggered pattern.
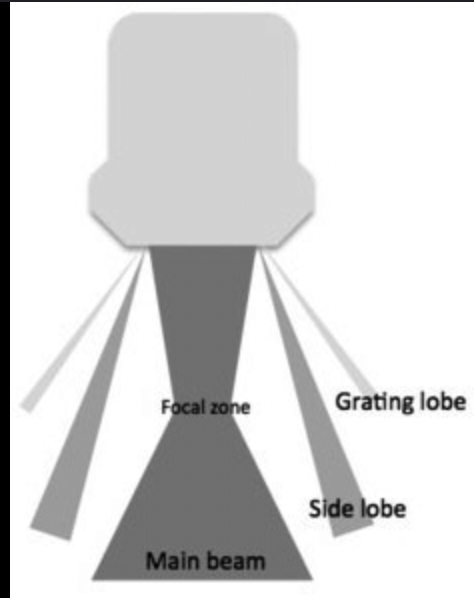
What are side lobes and how are they reduced?
Present in all transducers (circular and rectangular)
Caused by radial vibrations (circular elements) or length/width vibrations (rectangular elements)
Represent off-axis acoustic energy near the main beam
Can reduce image quality by causing false echoes
Reduced by:
Apodization: varying voltage across elements
Amplitude weighting: higher in center, lower on edges
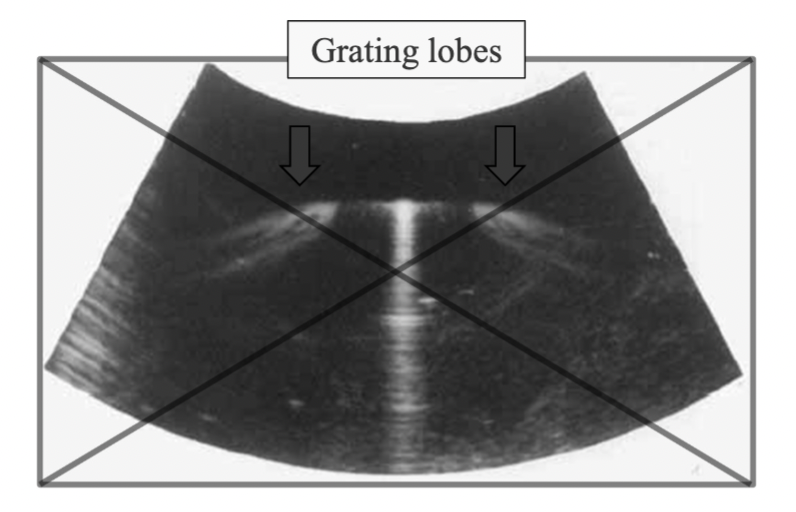
What are grating lobes and how are they reduced?
Characteristic of linear array transducers
Caused by periodic spacing of small elements in multi-element arrays
Represent off-axis beams that appear further from the main beam
Depend on wavelength and element spacing
Reduced by:
Sub-dicing: dividing each element into smaller segments spaced < 1 wavelength
Half-wavelength element spacing (eliminates grating lobes)
Apodization (helps reduce amplitude)
What is Endosonography, what is it used for
Combines ultrasound with an endoscope
Uses a convex radial transducer on a flexible tube, often with a camera and biopsy needle
Provides high-resolution images from inside the body
Uses tightly-curved, smaller curvilinear or phased arrays for better access and expanded field of view
Used for:
Visualizing internal organs (pancreas, esophagus, rectum)
Guiding biopsies of internal lesions
Staging cancers and assessing tumors
Evaluating gastrointestinal and lung diseases
What is IVUS and what is it used for?
Intravascular Ultrasound (IVUS) is a catheter-based ultrasound technique
Uses a miniature transducer (<1 mm diameter) inserted into blood vessels
Operates at high frequencies (30–50 MHz) for high-resolution imaging
Can use either rotating transducers or miniature arrays
Visualizes cross-sections of vessels, showing:
Lumen (inner open space)
Intima, Media, and Adventitia (vessel wall layers)
Used for:
Assessing plaque buildup and vessel narrowing
Guiding stent placements and other interventional procedures
Providing detailed anatomy of coronary arteries
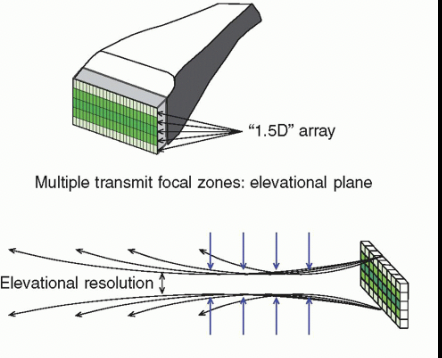
What are 1.5-D transducers and what advantages do they offer?
1.5-D transducers have multiple rows of elements (e.g., 3x128 to 8x192)
Called multi-row probes
Enable focusing in the elevational (slice thickness) direction
Adjust elevational focus by applying time delays to different rows
Improve image resolution and beam control in 3D space
How does 3D ultrasound using a volume scan method work?
Uses a 2D array transducer (N x N elements)
Beam is electronically steered in both azimuth (side-to-side) and elevation (up-down) directions
Scans a pyramidal-shaped region
Produces real-time volumetric images
No mechanical movement of the transducer needed
Enables high-speed 3D imaging
( produces 3D images, but is a 2D array transducer)
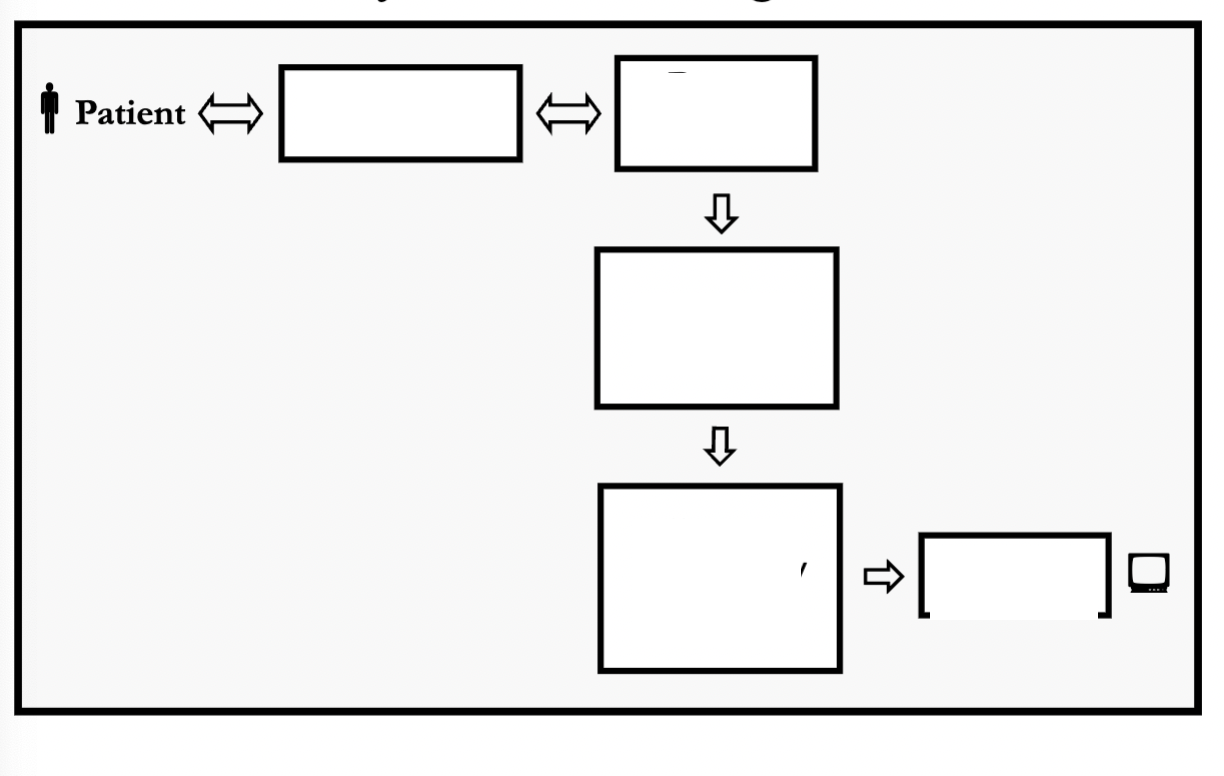
Fill in the order for the system block diagram
patient
transducer
beam former
signal processor
image processor/ Memory
display
What are the main components of an ultrasound system and what does each do?
Beam Former
Generates electrical pulses to drive the transducer
Receives echoes from the transducer
Transducer
Sends ultrasound waves into the body
Receives returning echoes
Signal Processor
Filters, demodulates, and compresses signals
Prepares signals for image formation
Image Processor
Converts signals into image data using a digital scan converter
Sends data to the display
Display
Visually presents the ultrasound image of the tissues scanned
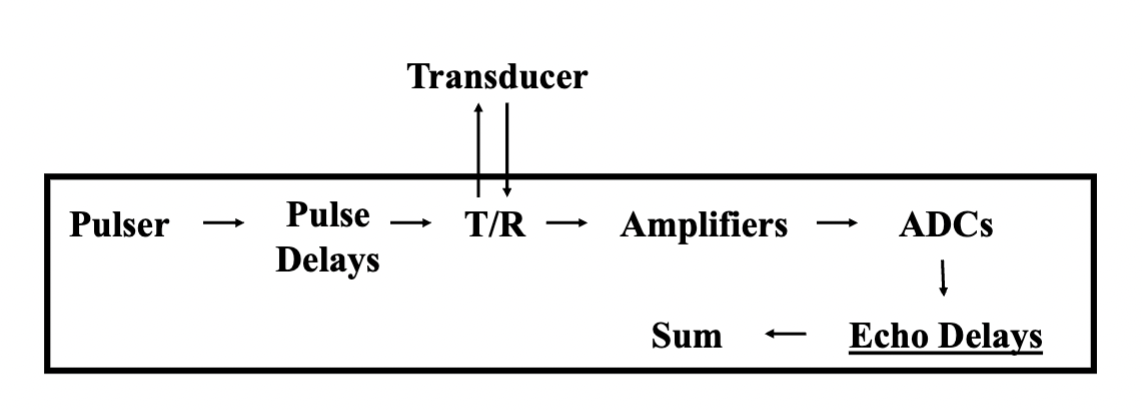
What does the beam former do in an ultrasound system and what are its key components
Main Role:
Generates and controls the signals that drive the transducer
Processes received echoes before passing them to the signal processor
Key Functions:
Sets PRF, frequency, and intensity
Controls scanning, steering, focusing, and apodization
Amplifies, compensates, and digitizes returning echo signals
Applies delays to focus and steer both transmit and receive beams
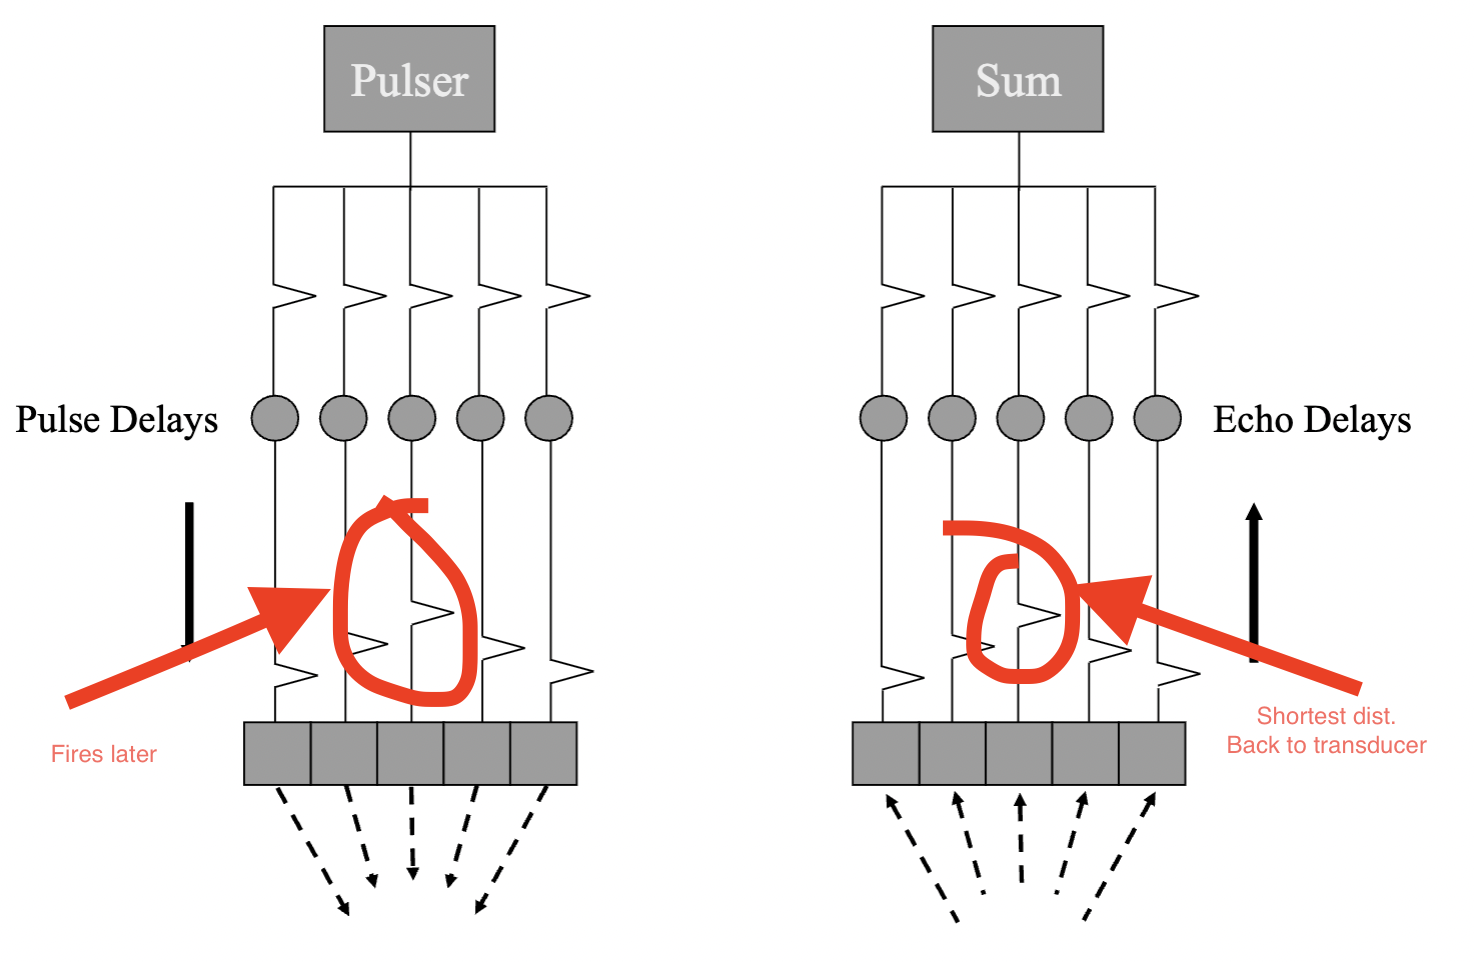
Important Components:
Pulser & Pulse Delays: generate timed electrical pulses
Transmit/Receive (T/R) Switch: routes signals appropriately
Channels: one per transducer element; includes delay + amplifier
Amplifiers: increase echo voltages, manage TGC
ADCs (Analog to Digital Converters): digitize echoes
Echo Delay Lines: provide dynamic focusing and steering
Summer: adds delayed signals to form a scan line
Typical Channel Counts: 32, 64, 128, or 256 → more = better control ( in 2’s)
What does the signal processor do in an ultrasound system and what are its components?
Main Role:
Processes raw echo signals from the beam former before image formation
Key Functions:
Filtering: removes unwanted frequency components
High-Pass Filter (Wall Filter): removes low-frequency signals (e.g., wall motion, venous noise)
Low-Pass Filter: removes high-frequency noise
Bandpass Filter: keeps only a specific range of frequencies
Demodulation: converts RF signals to their amplitude envelope
Compression: reduces the dynamic range to match display capabilities
Adjusts image contrast
Output:
Sends processed signal data to the image processor for display conversion
What does the image processor do in an ultrasound system?
Main Role:
Converts and enhances ultrasound signal data into a display-ready image
Key Functions:
Scan Conversion: formats data from scan lines to a 2D image grid
Pre-Processing: done before image storage
Examples: panoramic imaging, spatial compounding, 3D rendering
Image Storage: saves frames in cine loop memory for review
Post-Processing: adjusts image display (e.g., gray scale, color mapping)
Digital Scan Converter:
A 2D grid of pixels storing quantized values (digital brightness levels)
Each pixel has a unique address and stored value
Translates ultrasound data into digital images for display
What is multi-frequency imaging in ultrasound, and how does it optimize the system
Definition:
Subdivides the transducer's full bandwidth for both transmission and processing
Selectable by the operator based on clinical needs
Optimization for Specific Applications:
High Frequency: Optimized for spatial resolution (better detail)
Low Frequency: Optimized for penetration (reaches deeper tissues)
What is spatial compounding, and what are its benefits and limitations?
Definition:
Spatial Compounding combines multiple images taken with different beam orientations to create a single composite image.
Benefits:
Reduces speckle and noise
Minimizes artifacts
Reduces variations due to incidence angle
Can highlight features like mean, maximum, and minimum intensities
Limitations:
Decreased frame rate due to multiple acquisitions
Misregistration if the target moves between frames
Issues with refraction and sound speed variations that can distort images
What is frequency compounding in ultrasound, and what are its benefits and limitations?
Definition:
Combines images formed from different frequency bands
Uses bandpass filtering of received signals
No additional transmit beams required
Speckle patterns differ at different frequencies, and summing these images helps to reduce speckle (a grainy or textured appearance in the image)
🔹 Benefits:
Reduces speckle without affecting the frame rate
No decrease in frame rate, as it doesn’t require extra transmit beams
Helps improve image clarity
🔹 Note:
Distinct from Multi-Frequency Imaging, which changes the transmit frequency
Commonly not found as a standard feature in instruments
What is panoramic imaging in ultrasound, and how does it work?
Definition:
Extended field-of-view technique that allows for capturing a larger image than what the transducer alone can scan at one time.
How It Works:
Uses 2D image correlation with frame-to-frame image overlap
Manual scanhead translation in a single plane while moving the transducer
Image registration via calculation of motion vectors between frames
Real-time updates as the transducer is moved, resulting in a static, large-scale image
Result:
Creates a wide, panoramic image similar to images generated by static scanners
Commonly used for large-area imaging (e.g., musculoskeletal or abdominal scans)
What is coded excitation in ultrasound, and how does it improve imaging?
Coded excitation involves applying codes to the transmitted sound beam to improve imaging quality.
How It Works:
Binary Encoding: Applying specific pulse patterns (e.g., +1, 0, -1)
Frequency Modulation (Chirp): Varying the frequency of the pulse over time
Benefits:
Improves Signal-to-Noise Ratio (SNR): Enhances image clarity
Increases Depth Penetration: Allows imaging at greater depths without sacrificing resolution
Maintains Axial Resolution: Uses matched filtering to compress received signals in time
Limits Bioeffects: Longer pulses increase energy without increasing peak pressure, reducing the risk of bioeffects
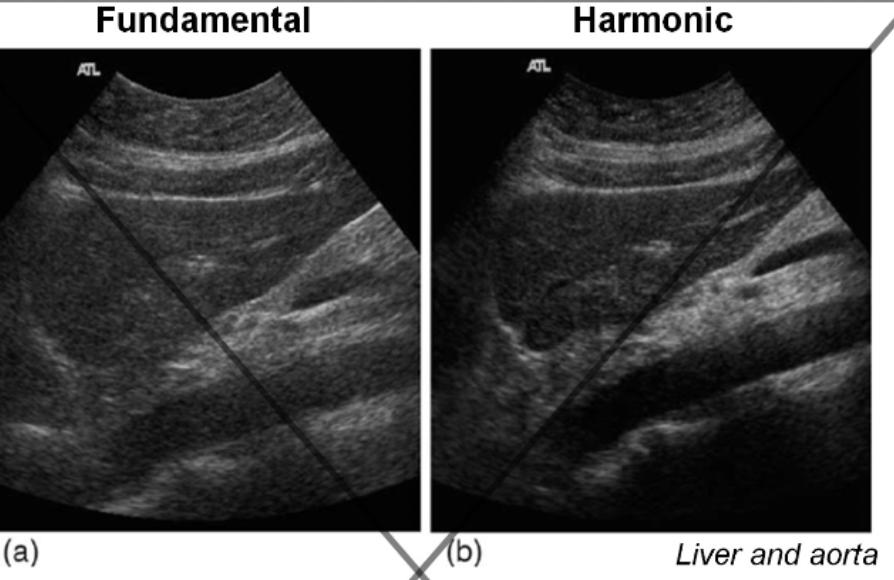
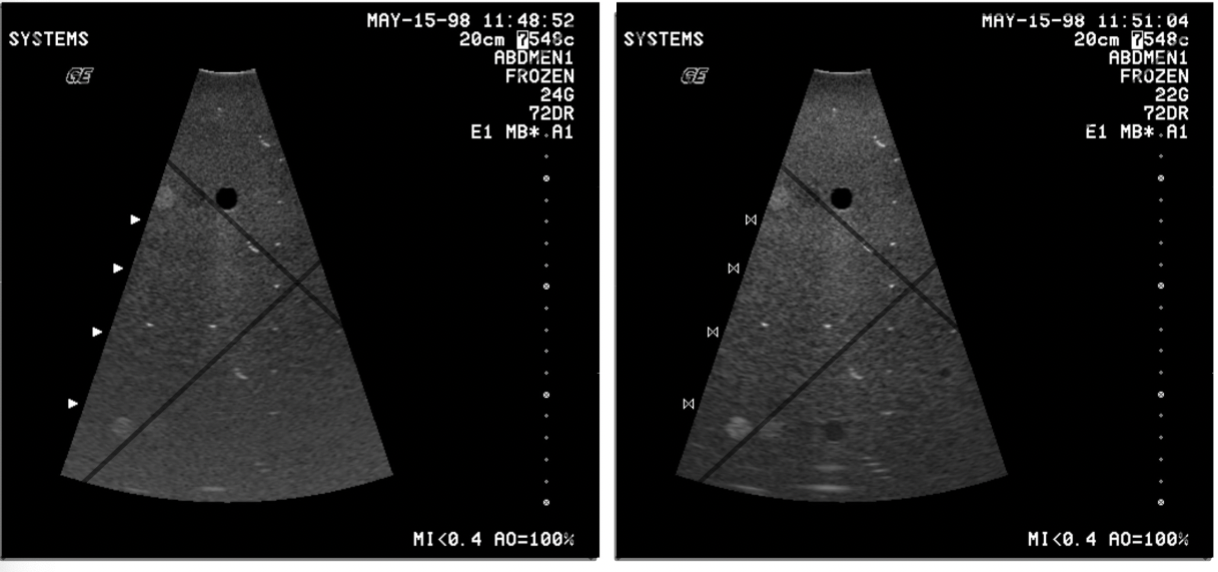
What is tissue harmonic imaging, and how does it benefit ultrasound imaging?
utilizes the nonlinear propagation of sound to generate harmonics at different frequencies, which are then filtered and used for imaging instead of the fundamental (transmit) frequency. It has a wide bandwidth of frequencies but lower frequency
How It Works:
Sound Wave Distortion: As sound travels deeper, the wave distorts, producing harmonics (integer multiples of the fundamental frequency).
Bandpass Filtering: The received signal is filtered to isolate harmonics and remove the fundamental frequency.
Benefits:
Improved Lateral Resolution: Narrower effective beam focusing on harmonics from the high-intensity central beam region.
Reduced Artifacts: Minimizes signals from secondary lobes and artifacts like reverberation and defocusing from shallow structures.
Better Contrast & Boundary Delineation: Harmonics improve contrast and boundary sharpness, especially at deeper depths.
Limitations:
Longer Pulses: Can reduce axial resolution.
Reduced Depth Penetration: Higher frequency harmonics attenuate more rapidly, limiting penetration.
Key Effects of Harmonics:
Harmonics vary with depth: Deeper tissue generates more harmonics.
Reduced Reverberations: The receiver filters out the fundamental frequency, reducing artifacts from superficial layers.
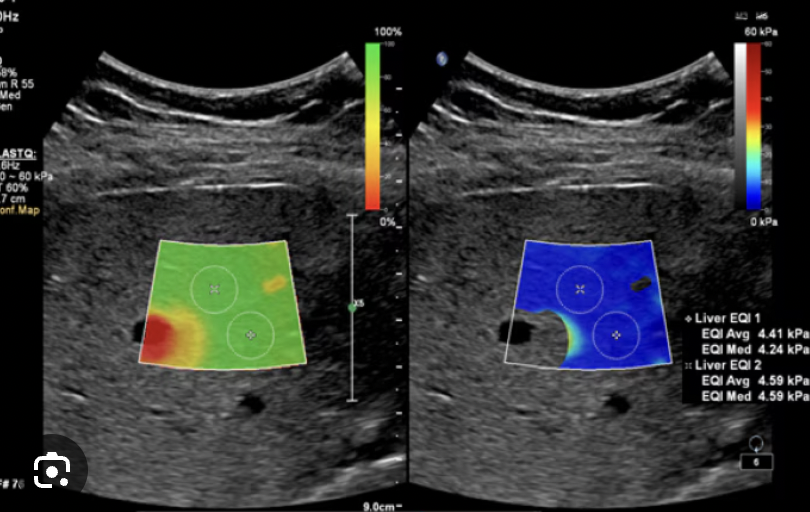
What is elastography in ultrasound, and how is it used to assess tissue stiffness?
estimates the relative tissue stiffness by measuring how tissues deform in response to an applied force.
How It Works:
Strain (Deformation): The amount of deformation of tissue is measured when a force (stress) is applied. Less deformation = stiffer tissue.
Shear Wave Velocity: Measures the speed at which shear waves propagate through the tissue, with higher speeds indicating stiffer tissue.
Methods of Compression:
Manual Compression: Applied by the operator using freehand pressure.
Motorized Compression: Uses a mechanical device to apply controlled pressure.
Radiation Force: Uses high-power pulses to induce tissue displacement.
Types of Measurements:
Qualitative Measurements: Assess tissue stiffness based on deformation patterns, but may vary due to differences in applied force.
Quantitative Measurements: Measure the shear wave velocity to calculate tissue stiffness more precisely.
Key Principle:
Elastography is useful for detecting changes in tissue stiffness and can help diagnose conditions like liver fibrosis, tumors, and muscle abnormalities.
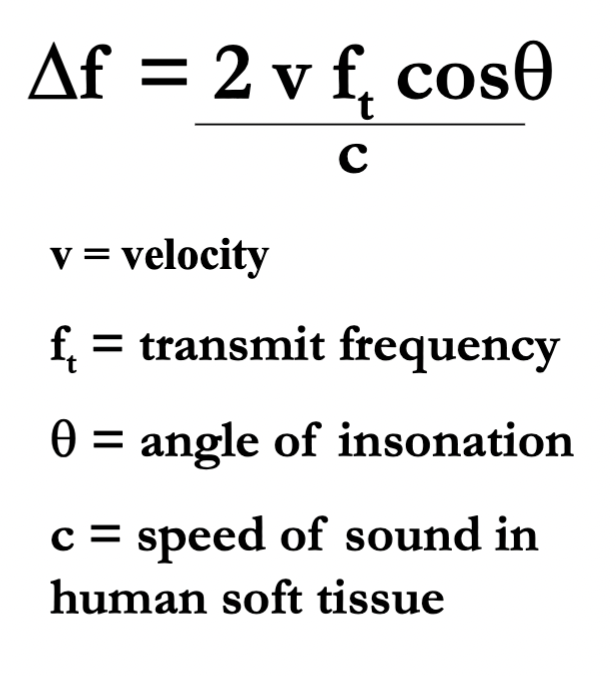
What is the doppler shift? ( include equation)
The change in the frequency of sound due to motion of the source of the sound or the observer (or both)
Factors affecting the doppler shift:
Velocity of blood flow (v)
Transmit frequency (ft)
Angle
Propagation speed of the medium (c)
Fd is proportional to everything in the numerator except “θ” ( but is proportional to Cosθ
Why is there a factor of 2 in the ultrasound Doppler equation?
Because the reflector (e.g., blood cell) causes two shifts:
Shift when receiving waves (like a moving receiver).
Shift when re-emitting waves (like a moving source).
The combined effect doubles the shift.
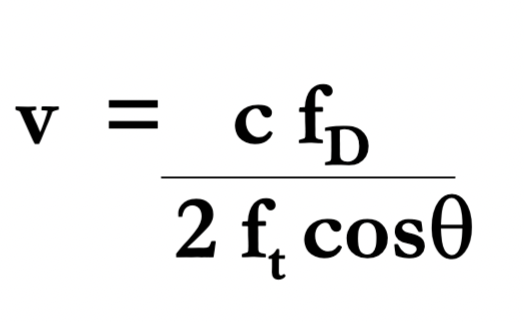
What is the target velocity, whats the equation?
can also solve for velocity error
What are the key differences between Continuous Wave (CW) and Pulsed Wave (PW) Doppler in ultrasound?
CW: Uses two elements (one continuously transmitting, one continuously receiving).
No depth resolution (range ambiguity)—cannot determine where the signal originates.
100% duty cycle (constant transmission).
Signal Processing:
Detects frequency shifts between transmitted and received signals.
Uses Frequency mod and demod only
Does NOT use the "beat frequency" method
Pulsed Wave (PW) Doppler:
Operation:
Uses short voltage pulses (like imaging transducers).
Provides range resolution (can isolate signals from specific depths via sample volume, SV).
Duty cycle < 100% (transmits in bursts).
Uses both frequency and amplitude mod and demod
Array Transducers:
Can operate in both PW and CW modes (but CW requires overlapping transmit/receive beams).
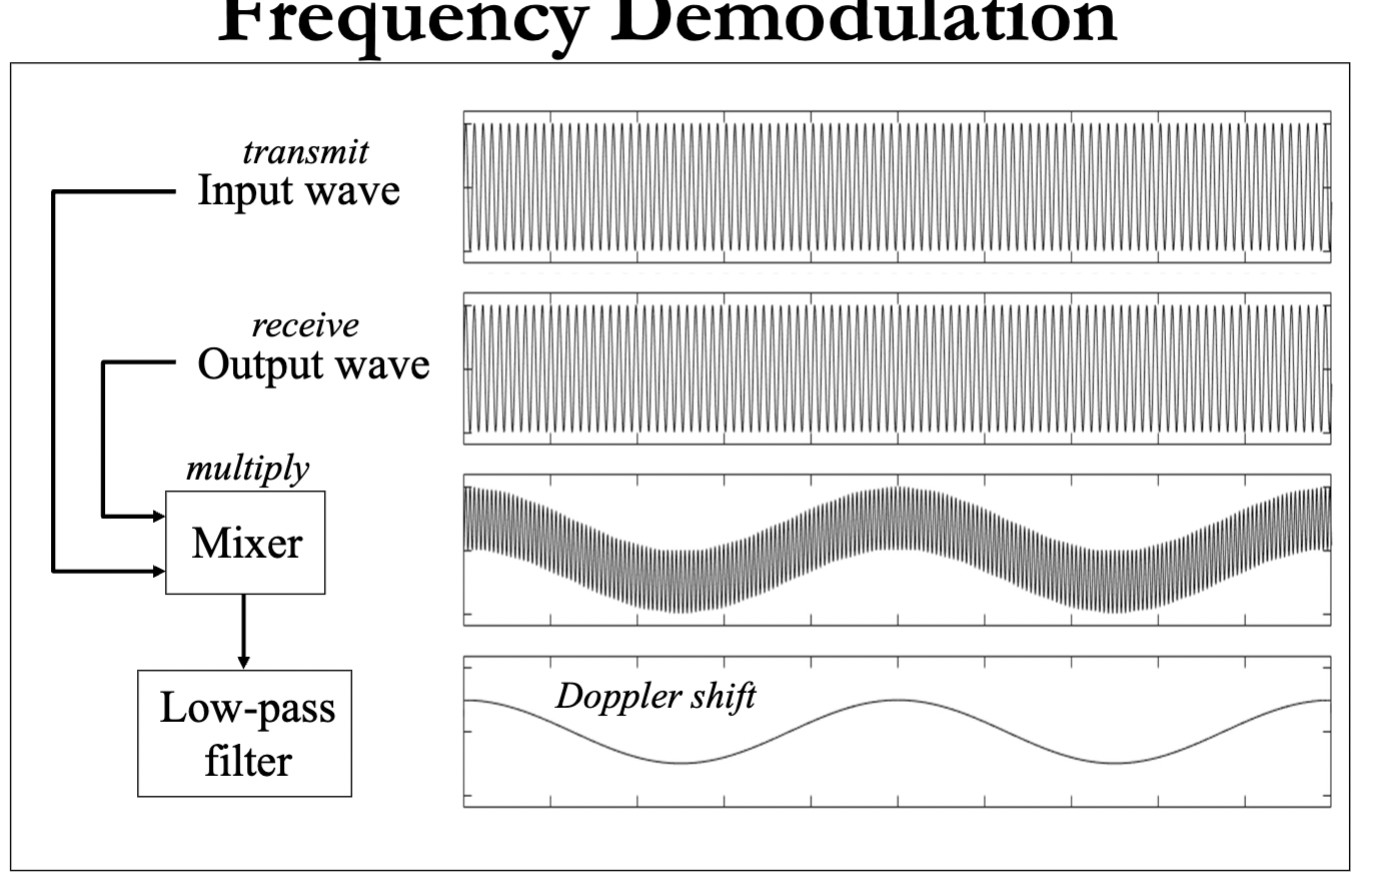
What is frequency Demodulation
Input Wave (Transmit)
The original ultrasound frequency (f₀) sent into tissue
Output Wave (Receive)
The echo signal (fₑ) bouncing back from moving blood/tissue
Slightly higher/lower than f₀ due to Doppler effect
Mixer (Multiply)
Mixes f₀ and fₑ by multiplying them
Creates two new signals:
Sum (f₀ + fₑ): High frequency (discarded)
Difference (fₑ - f₀): The Doppler shift
Low-Pass Filter
Blocks the high-frequency sum
What is Doppler frequency, and how is it calculated?
The frequency difference between transmitted and reflected ultrasound waves caused by moving blood.
Formula:
FD= Fr -Ft
Ft = Transmit frequency
Fr = Received frequency
FD = Doppler frequency
Key Points:
Tiny shift: FD is very small compared to Ft
Demodulation extracts FD by mixing Ft and Fr
Proportional to velocity: Higher FD = faster flow.
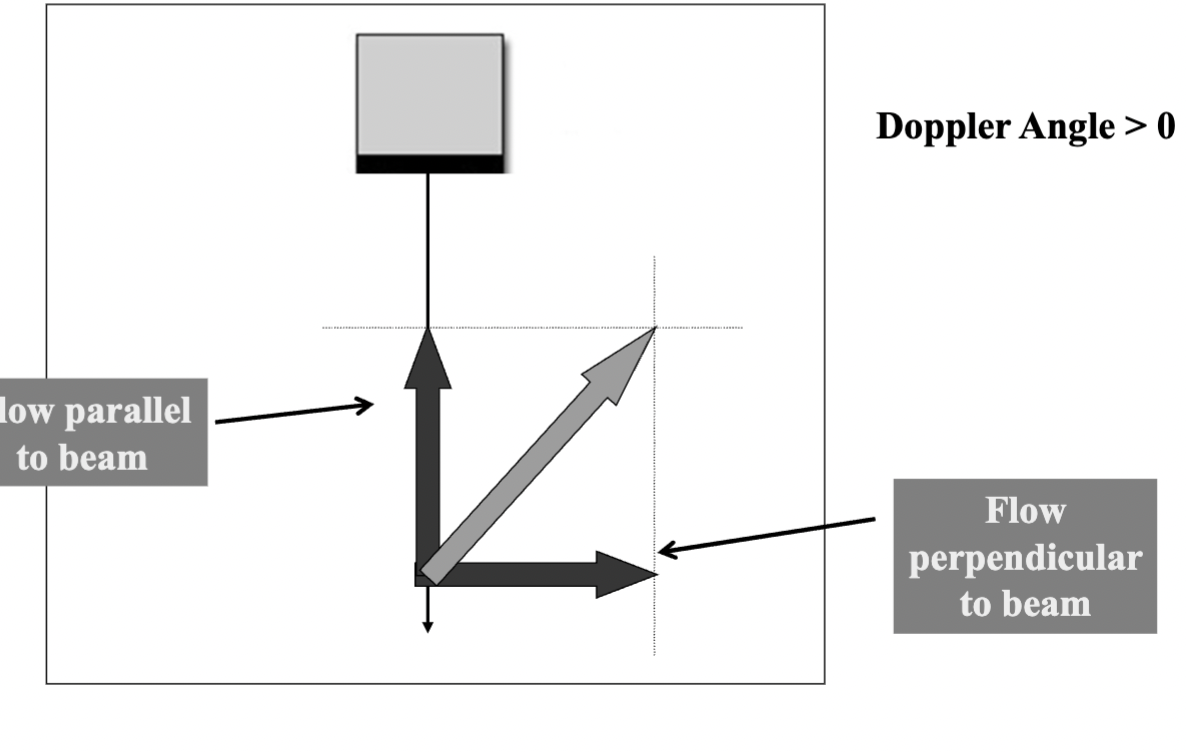
What is the Doppler angle, and how does it influence Doppler shift measurements in ultrasound?
The angle (θ) between the direction of sound wave propagation and blood flow.
0°: Flow is parallel to sound beam → max Doppler shift (cos 0° = 1).
90°: Flow is perpendicular → no Doppler shift (cos 90° = 0).
Only the parallel flow component (v·cosθ) is measured; perpendicular flow is ignored.)
Instruments only detect flow parallel to the beam, angle correction is crucial for accurate velocity calculations.
How does the Doppler angle affect the measured flow velocity in ultrasound, and why is cosine correction necessary?
Flow Vector Components:
The actual flow velocity (v) can be split into:
Parallel to beam (v·cosθ → detected).
Perpendicular to beam (v·sinθ → ignored).
Key Implications:
Detected flow ≤ Actual flow (since only v·cosθ is measured).
Larger angle (θ↑) → Smaller parallel component → Underestimation of true velocity.
Cosine Correction:
v= c * Fd/ 2Ft(cosθ)
Adjusts for angle to calculate true velocity (if θ ≠ 0°).
Critical Angle Range:
θ < 60° recommended (cosθ > 0.5) to minimize error.
Why does the Doppler angle need manual correction, and how does angle error affect speed measurements?
The machine can’t guess the angle, you must align the angle correction line with the flow direction.
Angle Error = Speed Error:
A 5° mistake in angle can overestimate or underestimate the true speed.
Example: If the real angle is 60° but you set it to 55°, the speed will be wrong (usually too high).
Bigger Angle = Bigger Mistakes:
Errors matter more at steep angles (e.g., 60° vs. 20°).
How does Pulsed Wave (PW) Doppler work and what are its key limitations?
PW Doppler uses a single transducer element that:
Alternates between sending & receiving sound pulses
Lets you pick exactly where to measure (range gate)
Samples flow at PRF rate, More samples (higher PRF) = better reconstruction of true flow ( better reconstruction, can guess what happened between samples)
Main limitations:
Has a max speed it can measure (Nyquist limit)
If blood moves too fast, you get aliasing (false direction/speed)-
Operator must correctly set the depth (range gate)
PRF Is changed by the scale control on machine
What determines the maximum measurable velocity in PW Doppler?
The Nyquist Limit:
Max frequency (fD) (or Nyquist limit) = PRF/2
Max velocity (vmax) = c²/(8 Ft R cosθ) This is the theoretical limit, sometimes the actual PRF is not at the theoretical max.
Why?
• PW Doppler is a sampling system
• Must sample ≥2× per wave cycle to detect frequency correctly
For ANY sampling system the max frequency that can be accurately measured = [ sampling rate/ 2 ]
Lower PRF → lower max detectable velocity
Key Factors:
Higher PRF → higher vmax
Deeper targets (R↑) → lower PRF → lower vmax
Steeper angles (θ↑) → lower vmax
Aliasing occurs when:
Actual velocity > vmax → appears as reverse flow
How do you calculate the maximum detectable velocity with a given PRF and the highest Doppler shift frequency the system can accurately measure
Max Frequency (Nyquist Limit):
Fd max= PRF/2
Max velocity ( Vmax) For a known PRF
Vmax= C* (PRF/2) / 2 Ft Cosθ
How does lowering the frequency affect aliasing
Decreasing transmit frequency (if allowed) or switching to a lower-frequency transducer reduces Doppler frequency shift (fD).
Lower fD = less chance of exceeding the Nyquist limit.
Result: Decreased aliasing in spectral Doppler.
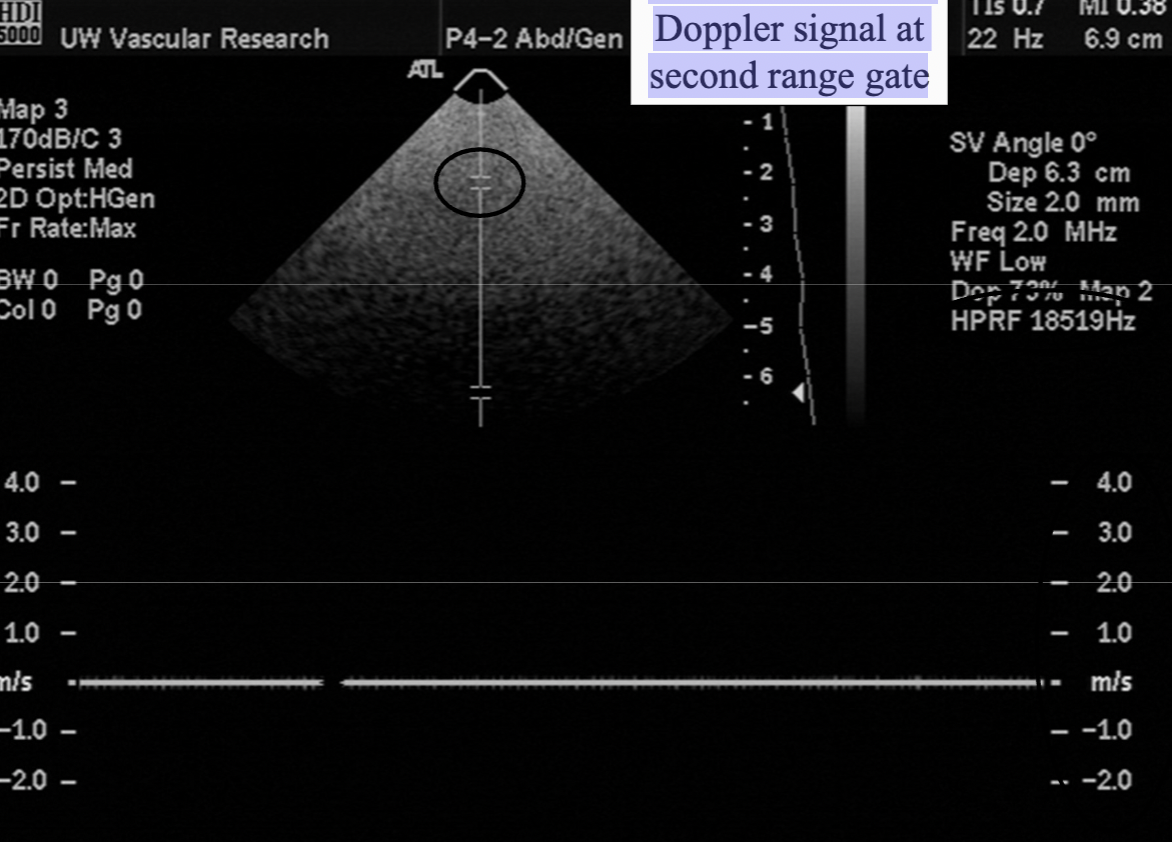
What is "High PRF" mode and what artifact can it cause?
High PRF Mode:
Increases PRF beyond normal depth limits.
Allows measurement of high velocities without aliasing.
Sends a pulse before echoes from the previous one have returned.
Formula: PRF = c / 2R (R = range/depth).
Doppler Range Ambiguity (Artifact):
Occurs when echoes from different depths arrive at the same time.
Instrument can't tell if echo is from the latest pulse (shallow) or an earlier one (deeper).
Creates false Doppler signals (multiple range gates appear).
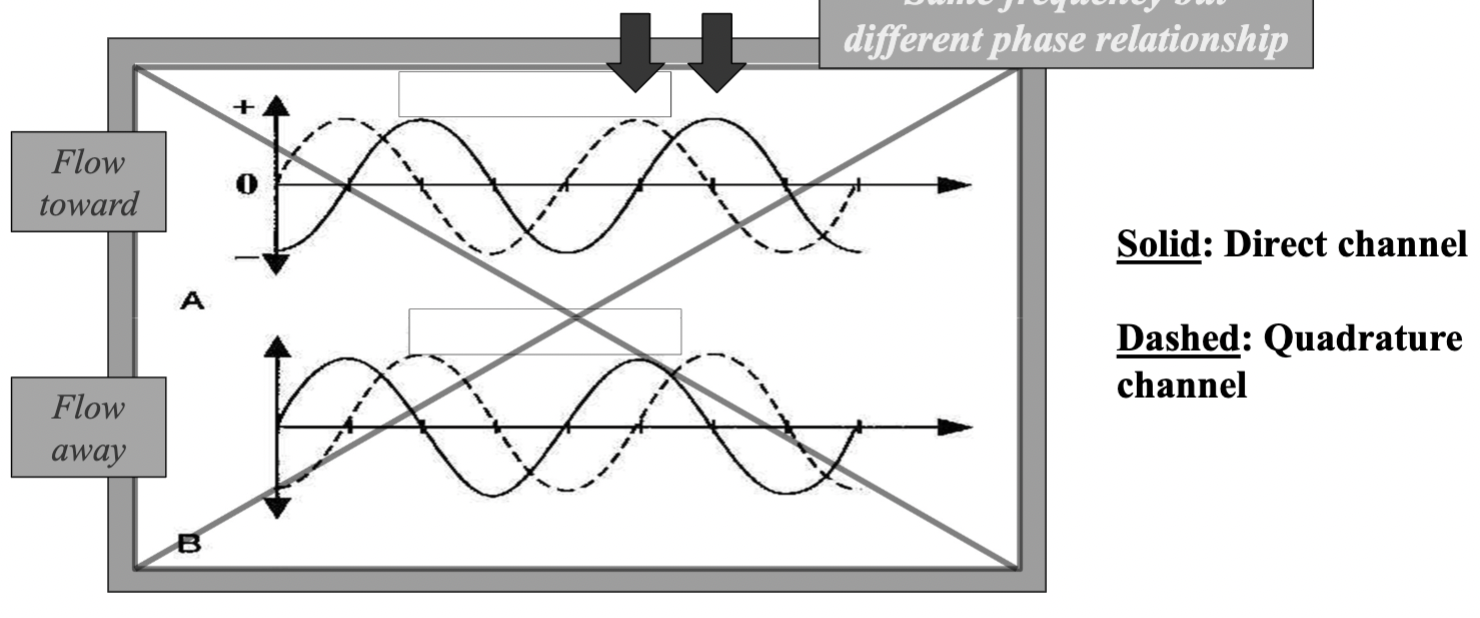
How does Quadrature Phase demodulation distinguish flow direction
Uses two reference signals shifted by 90° (¼ cycle shift) to create two channels:
Direct (solid line)
Quadrature (dashed line, 90° delayed)
Detects phase differences between signals to determine flow direction
Toward transducer: Quadrature signal leads/lags the direct signal. (on top)
Away from transducer: Opposite phase relationship.
By comparing these phases, the system separates flow into "toward" and "away" channels.
Used in both CW and Pulsed Doppler for directional detection. ( needs to be 2 elements to be used for CW one for transmit, one for receive, because it’s always transmitting and receiving simultaneously. )
Without quadrature demodulation (single-channel):
Doppler detects frequency shift but not direction.
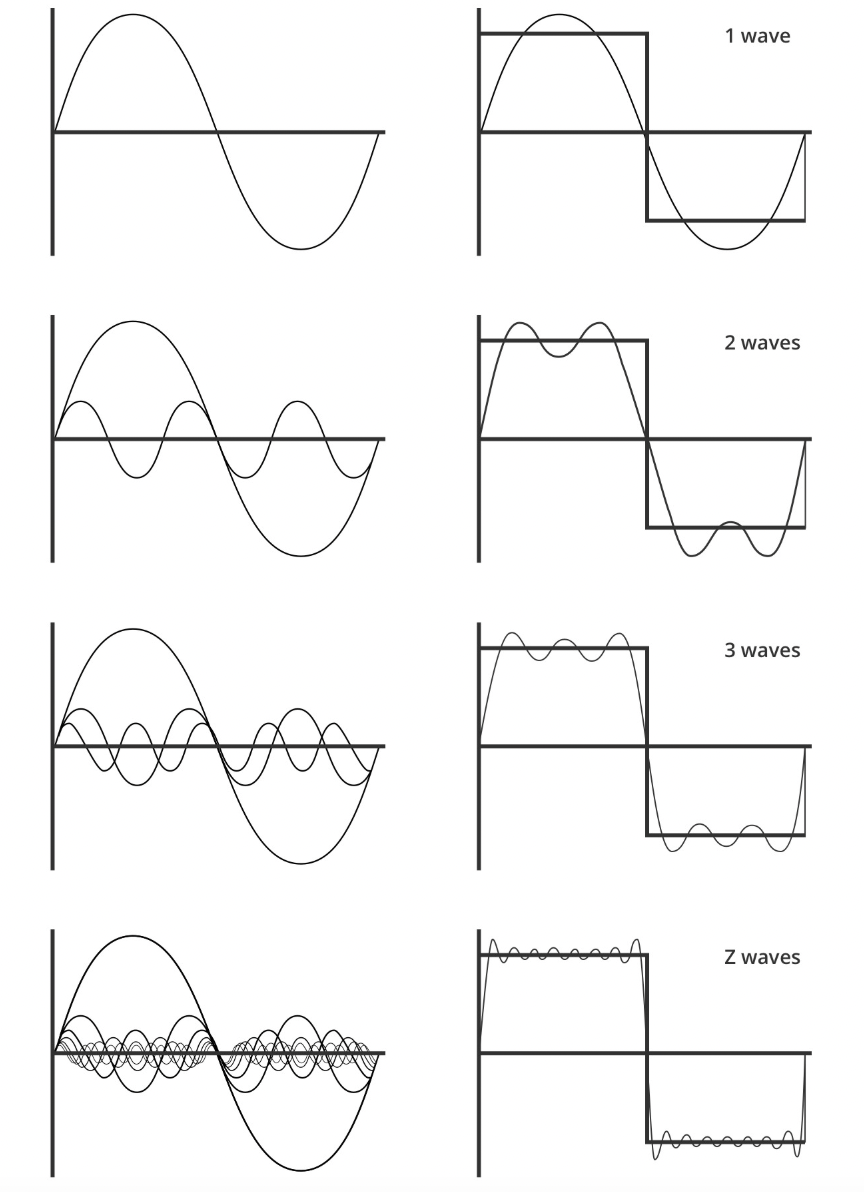
What is the Fourier Transform and its purpose in spectral analysis?
It takes a signal (like a sound wave or ultrasound echo) and breaks it into simpler sine waves of different frequencies. ( takes the square wave and makes it into simpler sine waves)
Input: A signal changing over time (e.g., a heartbeat sound).
Output: A list of the frequencies (pitches) that make up that signal.
Why? To see which frequencies are present (e.g., detect blood flow speed in Doppler ultrasound).
FFT is just a fast way to compute it.
The Fourier transform converts a signal from the time domain to the frequency domain
Any complex wave can be built by adding together enough sine waves of different frequencies. The Fourier Transform calculates exactly which sine waves are needed.
What is the Discrete Fourier Transform (DFT) and FFT?
DFT: a digitized signal as a sum of sinusoids ( tells you what frequencies are there) (using complex exponentials).
FFT: faster way to compute DFT:
Requires sample count as a power of 2
Reduces computations from 2(N²) → 2(N log N) (enables real-time processing)
Normal DFT FFT
Does 1000² = 1,000,000 calculations
Does 1000×7 ≈ 7,000 calculations
(For 1000 samples)
(Because log₂1000 ≈ 7)
Final Output: Frequency spectrum (plot of frequency components vs. amplitude). ( shows frequency strength)
What is a Power Spectrum in signal processing
A graph showing how strong different frequencies are in a signal.
X-axis: Frequency (e.g., blood flow velocity)
Y-axis: Magnitude (how much of that frequency exists)
For blood flow:
Each peak = a group of red blood cells moving at a certain speed.
Taller peak = more cells moving at that speed.
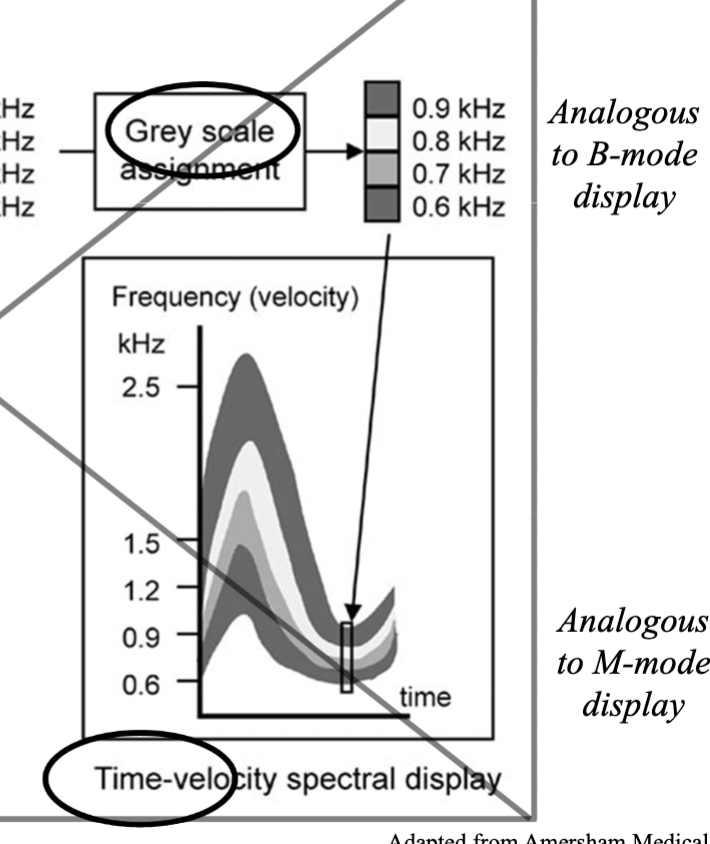
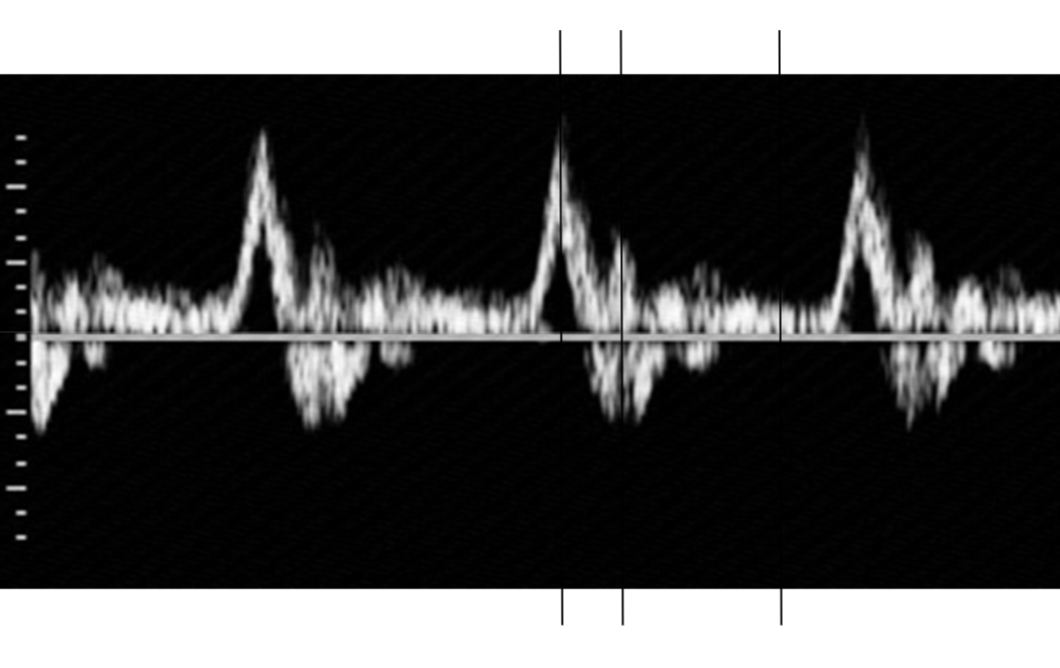
How is a Spectral Doppler Waveform Generated ( using the frequency spectrum and time-velocity spectrum)
Doppler signal sampled at the PRF
Fourier analysis performed on blocks of samples
Spectrum calculated for each block (each block generates a frequency spectrum)
Spectra displayed as a function of time ( displayed sequentially over time to form the spectral waveform)
Frequency spectrum: X-axis= frequency y-axis= magnitude. Magnitude/strength is shown by how many RBCS there are at that frequency ( brightness)
Time-velocity spectral display: x-axis= time Y-axis= velocity derived from frequency shift) Pixel Brightness: Indicates RBC density at each velocity/time
Frequency Spectrum: Shows the magnitude (strength) of detected frequencies at a single moment. The Time-velocity display takes sequential frequency spectra and stacks them over time to create the waveform.
What are frequency bins, how do you find the total number of bins.
Each bin represents a small range of frequencies in the signal.
The power in that bin indicates how much of the signal falls into that frequency range
Total # bins = # points in FFT (e.g., 128, 256, 512)
Each bin represents a small frequency range:
More FFT points → finer frequency resolution
How do you solve for frequency resolution, time resolution and velocity resolution
frequency resolution = PRF / (# of FFT points)
Time Resolution= (# of points in FFT)/ PRF
The frequency resolution determines the velocity resolution using the doppler equation
V res. = C* Fd/ (2Ft COS θ)
Fd= Fres
Minimum change in velocity that can be detected
( whatever you get for frequency res is the
How does FFT length affect frequency resolution, time resolution, and clinical Doppler settings?
FFT Length = # of samples/spectrum = # of frequency bins.
Frequency Range: −PRF/2 to +PRF/2 (e.g., ±5 kHz for PRF=10 kHz).
More samples in FFT = Better frequency resolution
More samples in FFT = Worse time resolution
If we have high-velocity flow: Prioritize frequency resolution (longer FFT).
if we have fast-changing flow ( like the heart) Prioritize time resolution (shorter FFT).
More samples = Clearer details (frequency) but motion blur (slow updates).
Fewer samples = Less detail but captures fast changes.
How do you resolve aliasing in Doppler ultrasound?
1. Increase PRF (Scale Adjustment): Higher PRF raises Nyquist limit (max detectable frequency). Tradeoff: May require ↓ depth
2. Decrease Depth: Allows ↑ PRF (shorter pulse return time).
3. Baseline Shift: Moves aliased forward flow to correct display region.
Cost: Reduces visibility of reverse flow.
4. Reduce Transmit Frequency (ft):
Lower ft → ↓ Doppler shift (fD) for same velocity.
Example: Switch from 5 MHz → 2.5 MHz transducer.
5. Increase Doppler Angle (θ):
↓ fD (since fD ∝ cosθ).
Caution: Angles >60° introduce velocity underestimation.