biostatistics final review
1/45
There's no tags or description
Looks like no tags are added yet.
Name | Mastery | Learn | Test | Matching | Spaced |
|---|
No study sessions yet.
46 Terms
parametric testing
tests that include statistics in formula
why do researchers prefer parametric testing for hypothesis testing?
tests are more likely to discern significant differences between populations
what are the conditions of parametric testing?
1. fairly spread random sampling
2. samples from different populations must be independent of each other
3. homogeneity of variance: variances of different groups of data must be similar/equal, NOT significantly different
4. must have a normal frequency distribution
non-parametric testing
tests that don't include statistics in formula; occurs when conditions are NOT met
analysis of variance (ANOVA)
determines presence of a significant difference between 4 populations
ANOVA steps to calculate
1. state research and null hypothesis
2. find the variance and mean for each group
3. set up ANOVA table and calculate
4. compare f-statistic value with critical value on F table
5. accept or reject null
degree of freedom equation between groups
k - 1
degree of freedom equation within groups
N - k
total degree of freedom equation
N - 1
sum of squares equation between groups

sum of squares equation within groups

variance equation between groups

variance equation within groups

f statistic equation

N
total # of data points
k
# of groups
how to find sum of squares between groups
1. add mean of each group and divide sum by # of groups for grand mean
2. do (group mean - grand mean)^2
3. add all points and multiply by N
how to find sum of squares within groups
positive correlation
both variables increase
negative correlation
both variables decrease
no correlation
1 variable increases and the other stays the same
correlation ___ ___ mean causation
DOES NOT
correlation coefficient
degree of association between -1 and +1
correlation coefficient for positive correlation
r between 0 and 1
correlation coefficient for negative correlation
r between 0 and -1
correlation coefficient for no correlation
r does not equal 0
regression establishes
a causal link between 2 variables
in regression, the independent variable is
fixed on Y axis
in regression, the dependent variable is
fixed on X axis
Tukey's test
used to test the hypothesis that all possible mean pairs are equal
Tukey test steps to calculate
1. subtract all possible mean pairs from each other
2. use HSD equation to calculate critical value on q table
3. compare mean differences with critical value
4. accept or reject null
Tukey's test: HSD equation

Tukey's test: critical value is found by
combining df within group and k
Tukey's test: if the mean difference is greater than the critical value,
a significant difference exists
U-Test
nonparametric test used to test the hypothesis that there is no significant difference between 2 samples from 2 populations
U-Test steps to calculate
1. arrange all data points in ascending order
2. determine K1 and K2 count by:
k1: from the list, count the # of measurements in sample B smaller than sample A
k2: from the list, count the # of measurements in sample A smaller than sample B
3. the larger value between K1 and K2 is the U-value
4. determine critical value from U-table
5. accept or reject null
U-test: critical value from u-table is found by
n (larger sample size) and n' (smaller sample size)
U-test: to determine K1 and K2 count, what are the values for each #?
tied # is 0.5 points, a # less than is 1 point
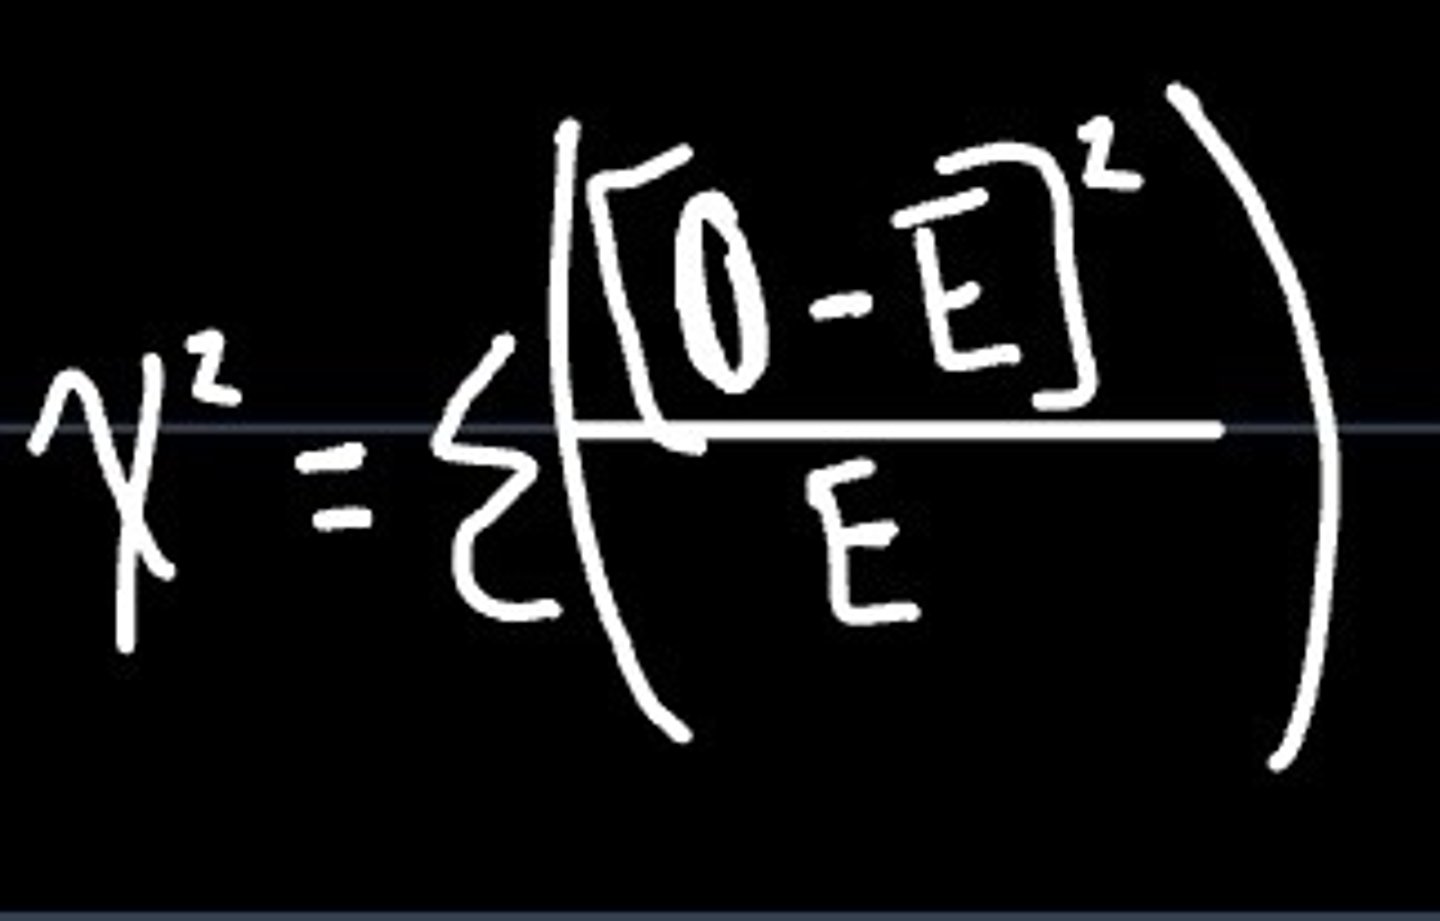
Chi-Square test
used to compare frequency distributions
chi-square formula
conditions for chi-square
1. random sampling occurs
2. no matching between groups
3. each variable studied must be categorical
4. expected value of the # of sample observations in each level is at least 5
Chi-square steps to calculate with 1 variable
1. write out expected and observed frequencies
2. place data in table and plug in formula for each category
3. compare X^2 value with critical value using chi-square chart
4. accept or reject null
Chi-square: critical value for 1 variable is found by
df (# of categories - 1)
Chi-square steps to calculate with 1 variable
1. identify null and research hypothesis
2. fill in expected frequencies on contingency table
3. calculate expected frequency
4. calculate X^2 and critical value
5. accept or reject null
Chi-square: expected frequency equation

Chi-square: critical value for 2 variables is found by
(# of rows - 1) and (# of columns -1)