Unit 6: Sampling Distributions
1/24
There's no tags or description
Looks like no tags are added yet.
Name | Mastery | Learn | Test | Matching | Spaced |
|---|
No study sessions yet.
25 Terms
sampling distribution
The probability distribution function of a statistics is called its __.
statistic
A ___ is a random variable whose value depends only on the observed sample and may vary from sample to sample.
size of the population, size of the sample, method of choosing the sample
The sampling distribution of a statistic will depend on the __, the__, and the __.
standard error
The standard deviation of the sampling distribution is called the __ of the statistic. It tells us the extent to which we expect the values of the statistic to vary from different possible samples.
sampling distribution of the mean
The probability distribution of the sample mean 𝑿̅ is called the ___.
with replacement
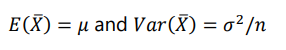
If all possible random samples of size n are drawn __from a finite population of size N with mean 𝜇 and standard deviation 𝜎, then the sample mean 𝑋̅ will have mean and variance given by:
without replacement
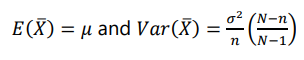
If all possible random samples of size n are drawn___ from a finite population of size N with mean 𝜇 and standard deviation 𝜎, then the sample mean 𝑋̅ will have mean and variance given by:
finite population correction factor
The factor (𝑁−𝑛/𝑁−1) in the formula of the variance of 𝑋̅ is called the __. For large N relative to the sample size n, this factor will be close to 1 and the variance of 𝑋̅ is approximately equal to 𝜎 2/𝑛.
normally distributed
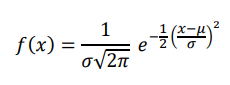
A continuous random variable 𝑋 is said to be__if its density function is given by:(pic)
for −∞ < 𝑥 < ∞ and for constants 𝜇 and 𝜎, where −∞ < 𝜇 < ∞, 𝜎 > 0 and e = 2.71828 and 𝜋 ≈ 3.14159.
X~N (population mean, population variance)
If 𝑋 follows the above distribution, we write__
population mean, population variance
If 𝑋~𝑁(𝜇, 𝜎^2), then 𝐸(𝑋) =__and 𝑉𝑎𝑟(𝑋) = __
normal curve
The graph of the normal distribution is called the __as shown below.
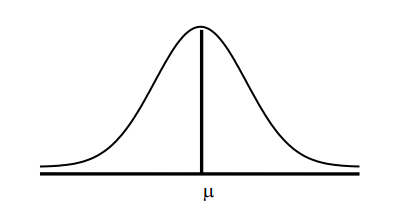
Bell-shaped curve and symmetric about a VA through the mean. NC approaches the HA asymptotically as we proceed in either direction away from the mean. The TA under the curve and above the HA = 1.4. The A under the curve between any two ordinates x=a and x=b gives the probability that the normal random variable X lies between a and b
Properties of a normal distribution
standard normal distribution
The distribution of a normal random variable with mean zero and standard deviation equal to 1 is called a __. That is, if we let 𝑍 be the standard normal random variable then 𝑍~𝑁(0,1).
Tables
___are used to determine the area under the standard normal curve to the left of a given point. This corresponds to finding the probability that a value in the distribution will fall to the left of that point.
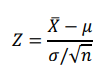
central limit theorem
The __ states that if 𝑋̅ is the mean of a random sample of size n taken from a (large or infinite) population with mean 𝜇 and variance 𝜎 2 , then the sampling distribution of 𝑋̅ is approximately normally distributed with mean 𝐸(𝑋̅) = 𝜇 and variance 𝑉𝑎𝑟(𝑋̅) = 𝜎 2/𝑛 when n is sufficiently large. Hence, the limiting form of the distribution of
as n → ∞ is the standard normal distribution.
n>=30
The normal approximation in the theorem will be good if __regardless of the shape of the population.
not too different
If n < 30, the approximation is good only if the population is __from the normal population.
exactly normal
If the distribution of the population is normal then the sampling distribution will also be __, no matter how small the size of the sample.
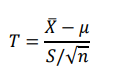
Student’s t-distribution
If 𝑋̅ and 𝑆^2 are the mean and variance, respectively, of a random sample of size n taken from a population which is normally distributed with mean 𝜇 and variance 𝜎^2 , then
is a random variable have the __with v = n – 1 degrees of freedom. In notation form, 𝑇~𝑡_(𝑣=𝑛−1)
Bell-shaped curve, symmetric about mean, mean, median, mode = 0 and located at the venter, Curves never touch the x axis
similarities of standard normal distribution and t-distribution
variable
The t-distribution is more __than the standard normal distribution; that is, the variance of the t-distribution is greater than 1.
standard normal distribution
As the sample size increases, the t distribution approaches the __.