Ch 1 Quantitative Analysis
1/28
There's no tags or description
Looks like no tags are added yet.
Name | Mastery | Learn | Test | Matching | Spaced | Call with Kai |
|---|
No analytics yet
Send a link to your students to track their progress
29 Terms
precision
reproducibility
Accuracy
nearness to the “truth”
uncertainty
variability in measurements
error
difference between measured and “true value”
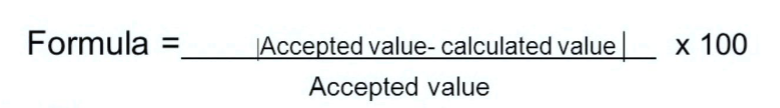
Percent Error
absolute value of the error makes it a positive numbers
False
A standard deviation close to zero means that the data points are highly accurate
True
A standard deviaiton close to zero means that the data points are close to the mean of the set
False
The population mean is the same as the sample mean
Population Mean
average of every individual in the entire population
used when you have data for everyone (RARE IN PRACTICE)
Sample Mean
average of a subset (sample) taken from the population
it is statistic ( varies from sample to sample)
used to estimate population mean
what we use
For a larger number of measurements,
sample mean approaches population mean.
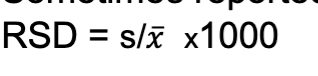
Relative Standard Deviation (RSD)

ppt (part per thousand)
Sometimes reported as ppt
Variance
the square of the standard deviation

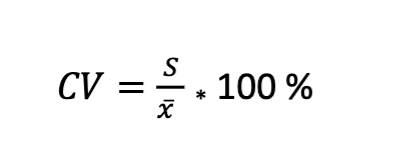
Coefficient of variation (CV)
is the relative standard deviation (RSD) expressed as percent
standard deviation (S)
RSD
Variance (s²)
Coefficient of variation (CV)
How is precision expressed by
the true value may never be known
What is the problem with accuracy
deviation
for comparision, precision analysis often uses
Types of Error
random
systematic error
gross
Random error (indeterminate error)
arises from the effect of uncontrolled (or uncontrollable) variables in the measurements
has equal chance of being positive or negative
always present and cannot be corrected
Systematic Error (determinate error)
Arises from a flaw in equipment or the design of the experiment
can be discovered and corrected
examples: incorrectly standardized pH meter, uncalibrated burette or flask, or a metod with wrong reaction (incomplete or too slow)
Systematic error Sources A
Instrument Errors
imperfections or instability
calibrate glassware
contamination in the inner wall of the flask
Instrument issues: power supplies are unstable, and dirty contacts are causing an increase in resistance
Systematic error Sources B
Method Errors
non-ideal chemical or physical behavior of the system
instability of the chemicals
slow or incomplete reactions
non-specificity of the reagents
COMMON and DIFFICULT TO DETECT
Recommendations for Method Error
analyze standard reference samples. Concetrations of analytes are known
use a second method to verify
perform blank analysis
Systematic error Sources C
Personal errors
careless or personal limitations
levels of liquid in burette
prejudice- have a natural tendency to underestimate the reading
Gross Error (blunder)
neither random or systematic
no known distribution or modeling and can be of any magnitiude
human mistakes
leads to outliers
identify outliers (Q-test or Grubb test)
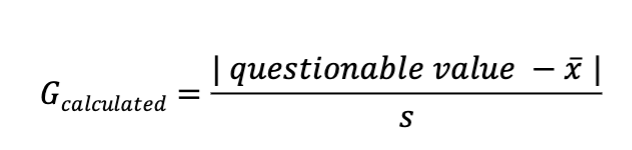
Grubbs test
test to decide whether to discard one datapoint that appears discreptant (outlier)
If Gcalculated > Gtable, then reject the data point
there is a <5% chance that the sus data point is a member of the same population as the other measurements
difference is considered significant

Grubbs Test
In the absence of a recorded blunder, use the …..