Economics - Measuring economic activity
1/21
Earn XP
Description and Tags
Name | Mastery | Learn | Test | Matching | Spaced | Call with Kai | Chat |
|---|
No analytics yet
Send a link to your students to track their progress
22 Terms
Nominal GDP
Gross domestic product, sum value of all final goods and services produced within a country’s boundaries in one year.
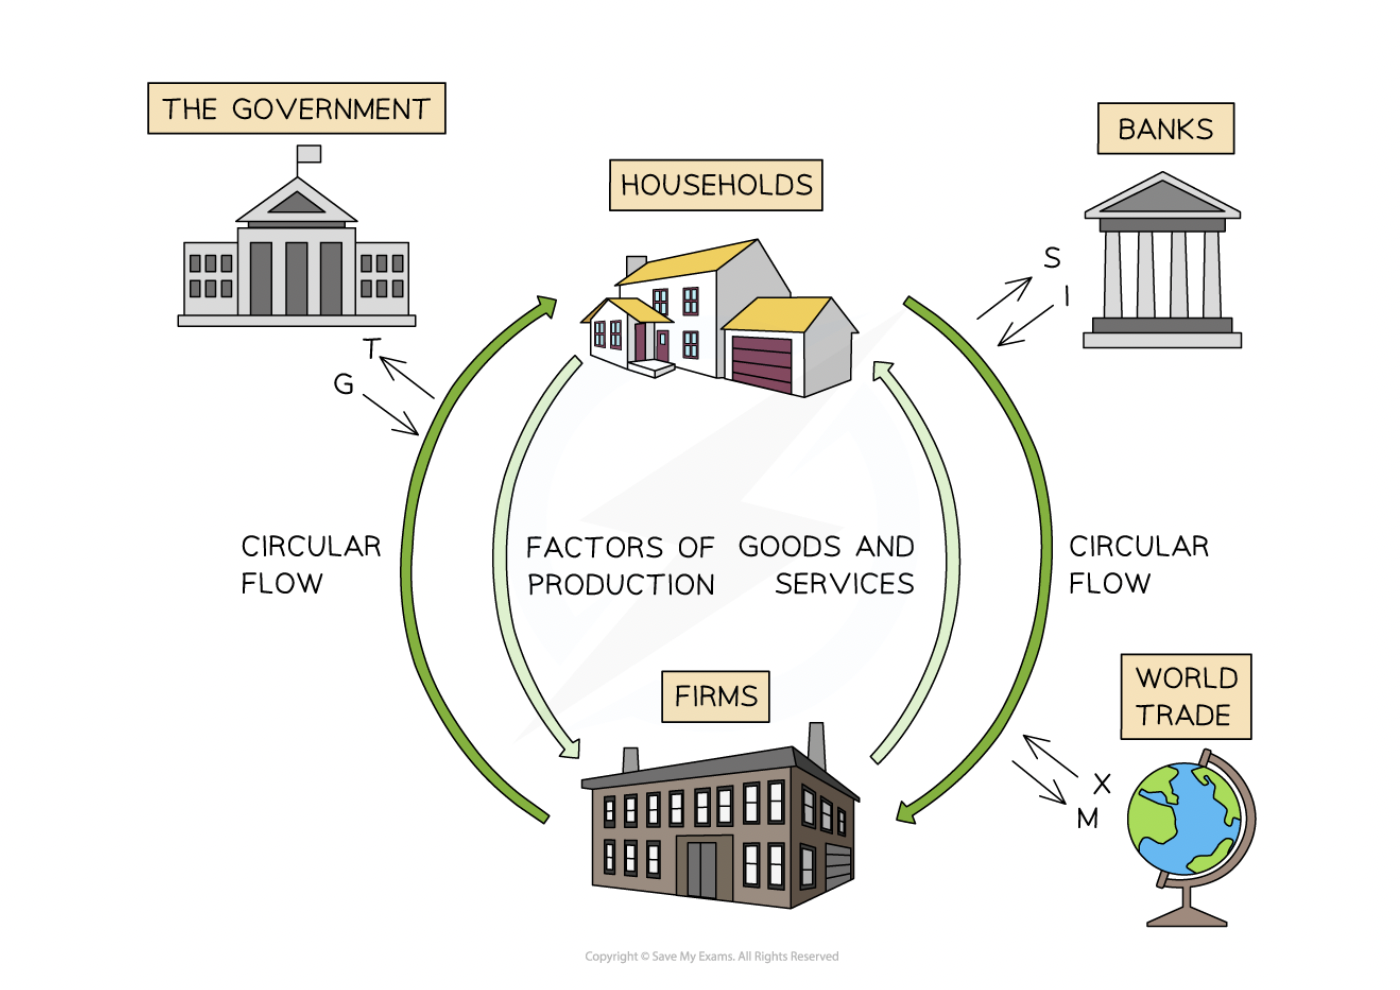
Injections
add money and increase size of circular flow model:
increased government spending, increased investments, increased exports
leakages
remove money and reduce size:
increased savings, increased taxation, increased import
circular flow model
G = government spending, T = taxation
I = investment, S = savings
X = exports, M = Imports
economic growth vs decline
if injections are bigger than leakages: economic growth
economic growth definition
Increase in the value of output, adjusted for inflation/ increase in real GDP
Calculating national income
expenditure approach
Nominal GDP = C + I + G + (X-M)
Income approach
National income = wages from labour W + rent from land R + interest from capital I + profit from entrepreneurship P
Output approach
Adds up value of all finished good and services produced within the country each year
definition of letters
consumption= total spending of goods/ services by consumers
Investment =total spending on capital goods by firms
Govt spending = total spending of government in economy (public sector salaries, provision of merit/public goods)
Net exports = difference between revenue gained and expenditure abroad
GNI
nominal GDP + net factor income earned abroad
Real gdp/gni
value of all goods and services produced in an economy in a one year period, adjusted for inflation
calculating real gdp
= nominal gdp/gdp deflator x 100
calculating real gni
real gdp + net income earned abroad
PPP
Purchasing power parity is a conversion factor which calculates the relative purchasing power of different currencies.
Shows number of units of a country’s currency that are required to buy a product in the local economy, as 1 dollar would in USA
eg. if good costs 135 dollars in vietnam after converted then PPP= 1:3 so cost of living is higher in the USA
however, if USA’s GNI/ capita is more than 3 x bigger than Vietnam, could be argued USA has higher standard of living
The business cycle
Shows changes in real GDP that occur in an economy over time as it fluctuates above and below the long- term trend rate
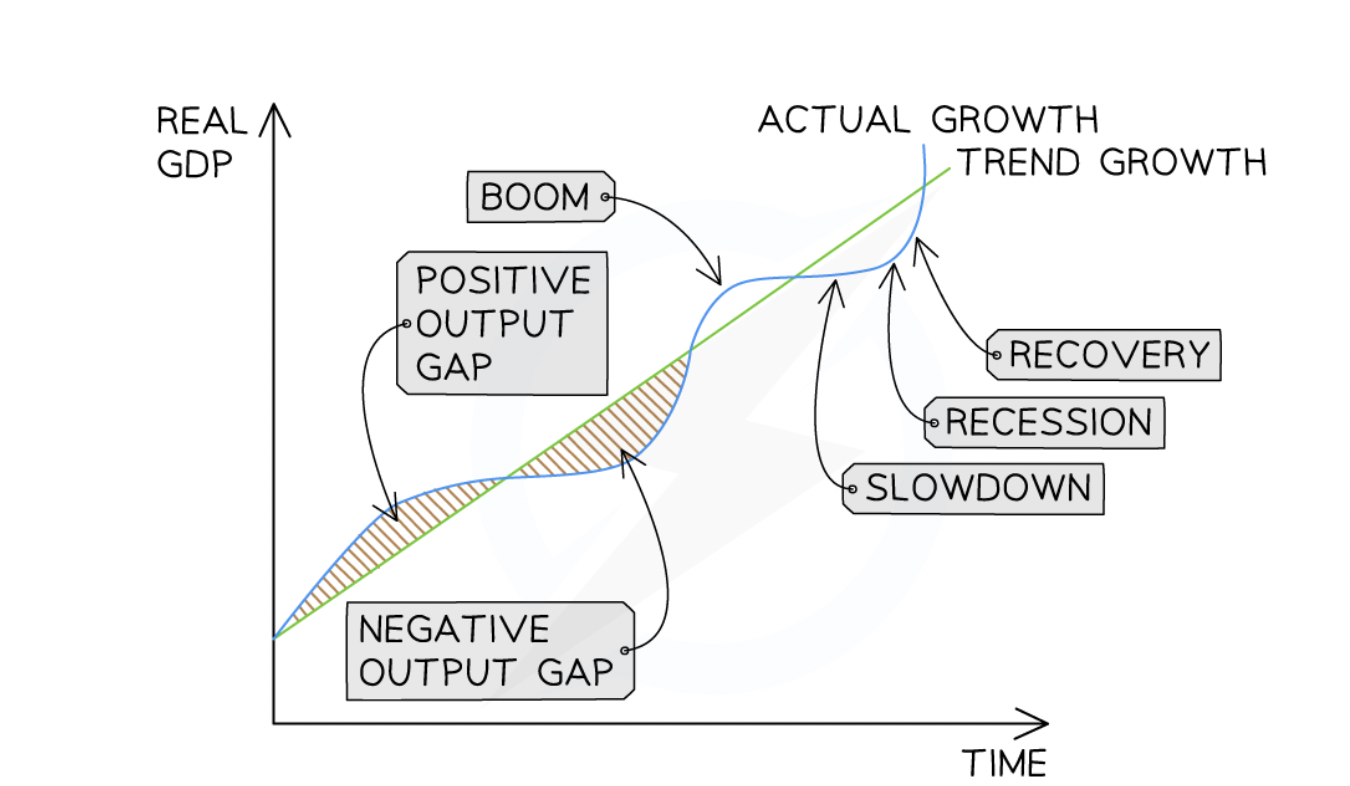
Positive vs negative output gap
Positive output gap = growth of real gdp above trend
Negative output gap = Growth of real gdp below trend
characteristics of a recession
2 or more consecutive quarters of negative economic growth, higher unemployment, higher negative output gap (spare production capacity), low confidence, low inflation, low government spending
characteristics of a boom
increased rates of economic growth, decreasing unemployment, reduced negative output gap, high confidence and risky decisions, increasing rate of inflation, improvement in government spending
Limitations of using GDP data to compare living standards between countries and over time
lack of information provided (distribution of income not provided)
quality of goods and services (provides no information on increase/decrease of quality over time)
Does not include unpaid/ voluntary work (for example, some countries have high family child care provision which increases standards of living)
Does not show differences in hours worked
Doesn’t show environmental and health impacts
Doesn’t show unrecorded transactions
Alternative methods
oecd better life index
happiness index
happy planet indey
oecd
organisation for economic and cultural developments better life index aims to measure well-being of citizens using 11 variables:
housing, income, jobs, community, education, environment, civil engagement, health, life satisfaction, safety, work-life balance
happy planet index
measures sustainable well being. Countries are ranked by how efficiently they develop long happy lives using earths scarce resources sustainably.
= (well being x life expectancy)/ ecological footprint
Happiness index
Measures happiness in 10 areas:
psychological well being, health, time balance, community, social support, education/arts/culture, environment, governance, material well being, work