7. Arterial and Cardiac Indices
1/54
There's no tags or description
Looks like no tags are added yet.
Name | Mastery | Learn | Test | Matching | Spaced | Call with Kai |
|---|
No analytics yet
Send a link to your students to track their progress
55 Terms
wave speed equation in the Mo-K equation
c²=Eh/pD
wave speed is a physical property of the arterial wall
wave speed equation regionally
c=∆L/∆t
wave speed equation locally using ultrasound measurements
c=±1/2 (d𝑈±/dln(𝐷)±)
Compliance Definition
the change in the cross sectional area in response to the change in pressure
Compliance Equation
Cs=(dA/dP) or (dV/dP) (cm²/mmHg)
dA, dV is the change in cross sectional area, volume and
dP is the change in pressure
Incremental/per cycle
Distensibility
the relative change in cross sectional area with respect to the original cross sectional area in response to change in pressure
Distensibility equation
Ds=(1/A)(dA/dP) (1/mmHg)
Ds=(Cs/A)=(compliance/A)
Why is distensibility a better measure as an Arterial Index than Compliance
Because compliance depends on vessel size, while distensibility corrects for size
arterial index
An arterial index is just a number used to describe the condition or mechanical behaviour of an artery
How is distensibility and wave speed related
Distensibility is directly related to wave speed and arterial stiffness through the B_H equation
c²=1/pDs
Pressure in the aortic root is…
the sum of the forward and reflected wave
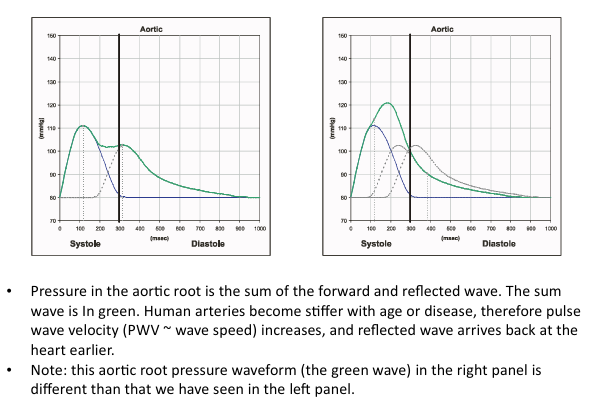
How could reflected wave arrives back at the heart earlier
Human arteries become stiffer with age or disease, therefore pulse wave velocity (PWV-wave speed) increases, ad reflected wave arrives back at the heart earlier
What is the clinical implications of wave reflection; n=3
First, in the left panel, central systolic pressure and central pulse pressure is increased. This stresses cerebral blood vessels increases stroke risk
Second, there is an increase in left ventricular load (LV load). In the middle panel, the increase in LV load accelerates and increases LV hypertrophy. The area under the pressure-time curve systole is one definition of LV load.
Third, in the right panel, the pressure that is perfusing the coronary arteries during the critical diastole period is reduced, increasing the risk of myocardial ischemia’s
Earlier arrival of reflected waves is…
Bad as increasing arterial stiffness independently increases the risk of all major cardiovascular outcomes
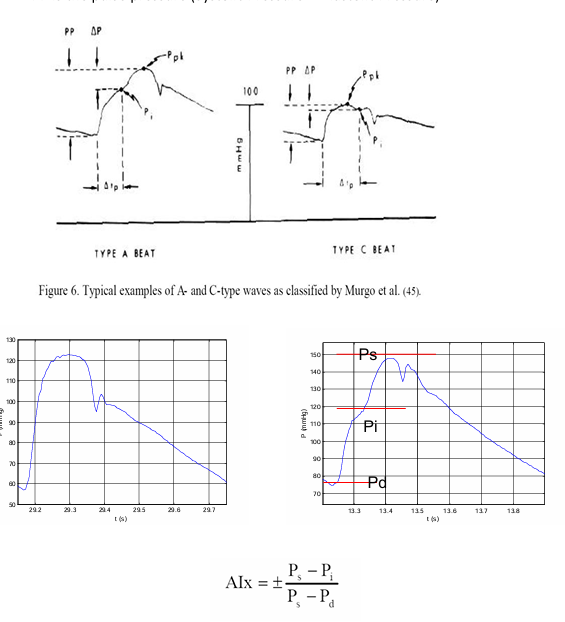
Augmentation Index (a measure of reflected wave)
The index can be calculated as the ratio the increase in pressure due to reflected wave to the total pressure pulse
clear inflection point (Pi)
the arrival of reflected wave
Augmentation index equation
AIx=Ps-Pi/PP
Where Ps is systolic pressure
Pi is pressure at the inflection point
PP is the pulse pressure (Ps-Pd, systolic pressure - diastolic pressure)
Pressure reflection index
ratio of backward to forward pressure/diameter
Pressure reflection index equation
Rindex=P-/P+=D-/D+
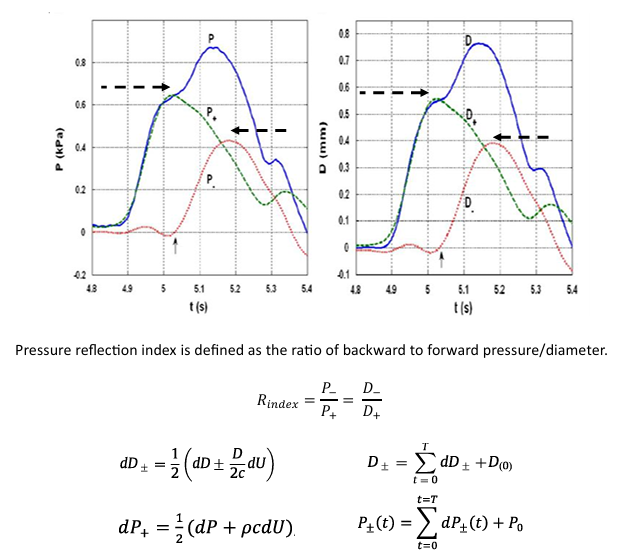
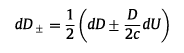
dD+-
½ (dD+-D/2c dU)
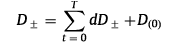
D+-
T E t=0 dD +- +D(0)
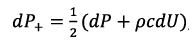
dP+
½ (dP+pcdU)
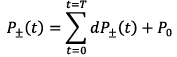
P + - (t)
t=T E t=0 dP+= (t) +P0
Wave Intensity Reflection Index
ratio of backward to forward separated wave intensity
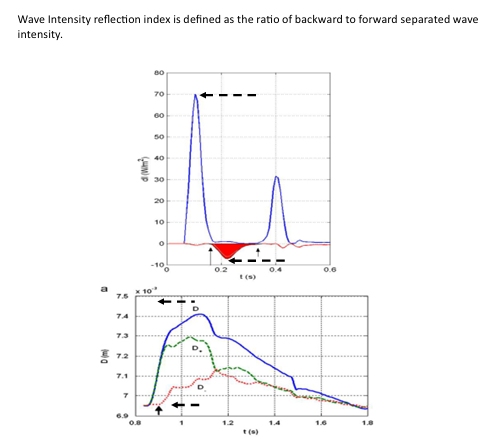
wave intensity reflection index equation
RdI=dI-/dI+
dI+-=+-1/4pc (dP+-pcdu)²
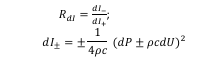
non invasive wave intensity reflection index equation
Rndl=ndI-/ndI+
ndI+-=+=1/4(D/2c) (dD+-D/2cDU)²
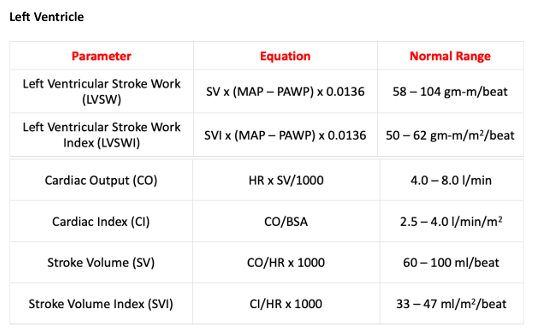
Cardiac Index
relates the cardiac output (CO) from left ventricle per minute to body surface area (BSA). This index relates cardiac performance to the size of the individual. The unit of measurement are (L/min/m2)
Cardiac Index Equation
CI=CO/BSA=SV*HR/BSA
Where
HR is heart rate
SV is stroke volume (end diastolic volume-end systolic volume)
CO is cardiac output and calculated: CO=HR x SV
Factors affected Heart Rate
hormones, fitness levels, age and autonomic levels
Factors affected Stroke Volume
gender, contractility, pre- and after- load and heart size
Stroke Volume Index (SVI)
Relates the volume pumped by the heart, stroke volume (SV) per beat to body surface area (BSA). This index relates cardiac performance to the size of the individual. The unit of measurement are (mL/m²)
Stroke Volume Index Equation
SVI=SV/BSA
SV is stroke volume (end diastolic volume - end systolic volume)
Equation for left ventricular stroke work
SV x (MAP - PAWP) x 0.0316
MAP is mean arterial pressure
PAWP is pulmonary artery wedge pressure
Normal Range: 58-104 gm-m/beat
Equation for left ventricle stroke work index (LVSWI)
SVI x (MAP-PAWP) x 0.0316
Normal range: 50-62 gm-m/m²/beat
Ejection Fraction
The ratio between volume of blood ejected by the ventricle during systole, Vs, to the volume of blood in the ventricle at end of diastole, Vd
Why does the ejection fraction considered as a crude parameter to assess the ventricle performance
difficulty and inaccuracy in measuring the left ventricular volume
ejection fraction equation
EF=Vd-Vs/Vd
Normal range:50%-80%
Shortening fraction
a left ventricle axis, SF, is the proportional decrease in the proportional decrease in the axis length during contraction compared to its length at end of diastole where it is completely stretched due to the filling, where X is the axis length: Base-Apex, Septum-free wall
Shortening fraction equation
SF=Xmax-Xmin/ Xmax
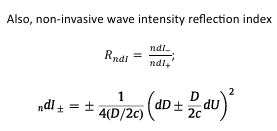
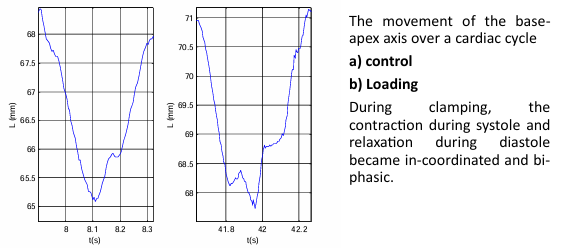
What happens during clamping
the contraction during systole and relaxation during diastole became in-coordinated and bi-phasic
MVO2 calculation
multiplying the flow rate of the left anterior descending coronary, Qcor, by the arteriovenous oxygen content difference
Left V O2 consumption equation
MVO2=Qcor*O2(A-V)
Where Qcor is coronary flow and O2 is the oxygen concentration, A is the arterial side and V is the venous side
Left Ventricle Parameters
See Image
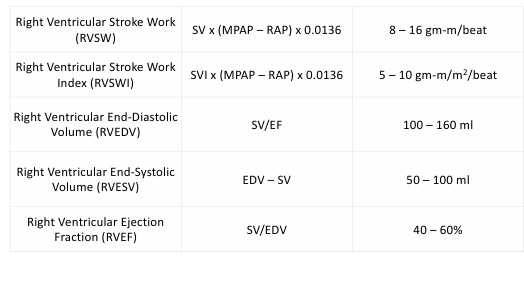
Right Ventricle Equation
See Image
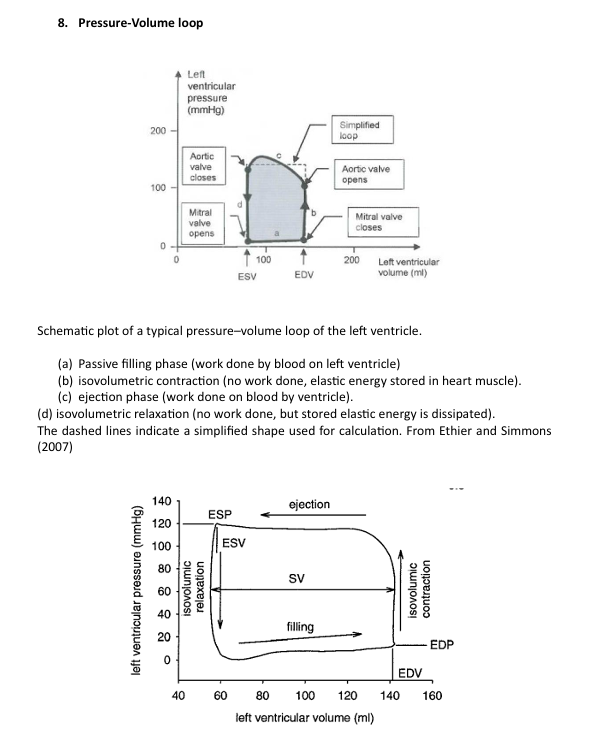
Schematic plot of a typical pressure-volume loop of the left ventricle
a. Passive filling phase (work done by blood on left ventricle)
b. isovolumetric contraction (no work done, elastic energy stored in heart muscle)
c. ejection phase (work done on blood by ventricle)
d. isovolumetric relaxation (no work done, but stored elastic energy is dissipated)
Ventricular Hydraulic work
W=[PUdt] T 0
Where T denotes the duration of the cardiac cycle
Measurements taken in the ascending aorta (where velocity(U) is measured)
![<p>W=[PUdt] T 0</p><p>Where T denotes the duration of the cardiac cycle</p><p>Measurements taken in the ascending aorta (where velocity(U) is measured)</p>](https://assets.knowt.com/user-attachments/1f363790-3625-49b5-8f08-32e3725a5a14.png)
Cardiac Power
W=[P dV] T 0
which is the area within the pressure-volume loop
![<p>W=[P dV] T 0</p><p>which is the area within the pressure-volume loop</p>](https://assets.knowt.com/user-attachments/24b7ccde-23eb-4f39-b07c-4c4f15fa1b5c.png)
What is an easier way to get cardiac power
W=DP dV
Simplify by integrating around the dashed rectangle
Using W= dP dV of avf human
1.5 J/cycle and 70 BPM corresponds to a power of 1.7 Watts
LV wall stress
a function of chamber size and configuration, thickness of the ventricular wall, and intra ventricular pressure
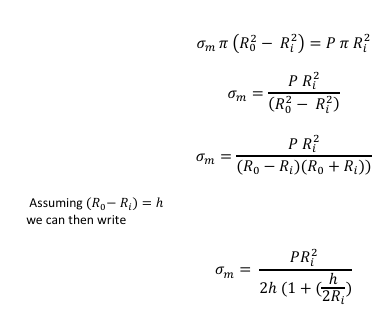
Average Meridional stress (Oa)
force per unit area acting at the mid plane to the heart, in the direction of the apex to base length
meridional wall forces equation
om=PRi²/(Ro-Ri)(Ro+Ri)
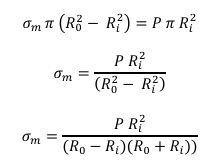
meridional wall forces assuming (Ro=Ri)=h equation
om=PRi²/2h(1+h/2Ri)