Chapter 4: Mapping Eukaryote Chromosomes by Recombination
1/25
There's no tags or description
Looks like no tags are added yet.
Name | Mastery | Learn | Test | Matching | Spaced |
|---|
No study sessions yet.
26 Terms
Recombination
combinations of genes that differ from parental traits
- closely linked genes: recombination frequency is lower than 50%; they are more likely to be inherited together; not enough space, need a double strand break to occur
- unlinked genes: frequency is 50% due to independent assortment, do not need a double strand break, results in 1:1:1:1 ratio
Double Strand Breaks
two non sister chromatids make contact in the chiasmata
- break and swap DNA strands
- occurs during prophase I
- allows for crossing over to occur
Crossing Over
allows for recombination to occur
- result of DNA double strand breaks
- multiple can occur, the greater the number the rarer they are
Chiasmata
physical chromosome conformations
- give rise to crossing over
How are DNA Double Strand Breaks Distributed on a Chromosome
randomly occurring
- some positions where DNA breakage occur at a higher frequency
- repairs are also random; do not always occur through a DNA heteroduplex
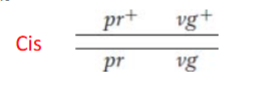
Cis
two dominant alleles are on the same chromosome
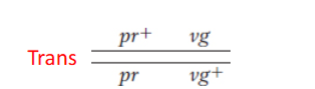
Trans
two dominant alleles on different chromosomes
Recombination Map
chromosome map based on recombination frequencies
- represent spatial arrangement of genes on chromosomes
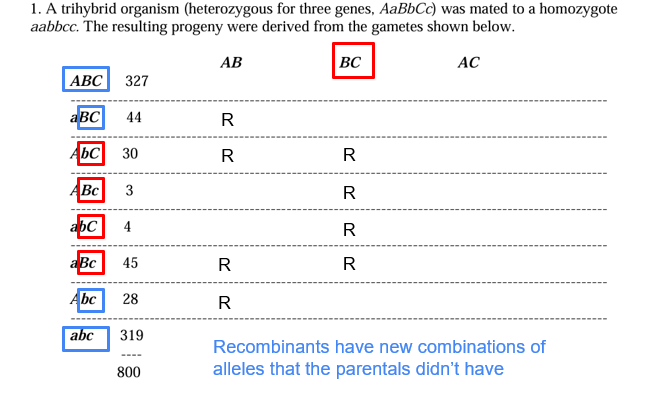
Three Point Cross
look at what the parental genotypes do not have
- the double crossovers are the rarest genotypes; the ones with the least amount of progeny
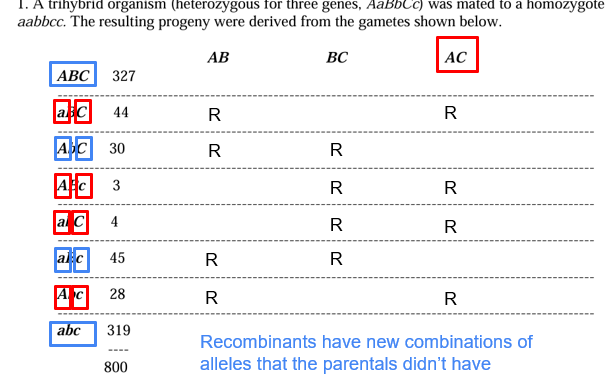
Calculating Recombination Frequencies
determine the total number of recombinants from the parents
- add them
- divide each recombinant by total progeny and multiple by 100
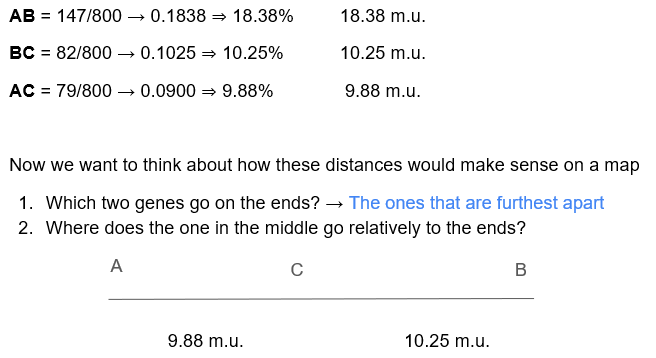
Making Recombination Map
recombination frequencies become map units
- the ones furthest apart go on the ends
Diagnostics of Linkage
genes are linked if they are on the same chromosome
- can be referred to as loci
- discovered by mendel’s laws
Linkage Map
spatial map of genes based on recombination frequencies
Genetic Map Units
distance between genes for which 1% of meiosis is recombinant
- corresponds to the progeny that has 1% of that specific recombinant
Unlinked Genes
independent assortment
- results in equal ratios for all phenotypes
- 50% chance of recombination
Linked Genes
genes on same chromosomes that are inherited together
- less than 50% chance of recombination due to being close together; the more close the less chances
Monohybrid Test Cross With No Linkage Ratio
1:1
Monohybrid Selfed Cross Ratio
3:1
Dihybrid Testcross with No Linkage Ratio
1:1:1:1
Dihybrid Selfed Crossed Ratio
9:3:3:1
Trihybrid Testcross with No Linkage
1:1:1:1:1:1:1:1
Molecular Markers
sequence variants used to map phenotypes to chromosomal regions
- used to find the genes for traits
- detected by whole genome sequencing and PCR primers
- neutral markers with no phenotypic effect
- minisatellites and microsatellites
Minisatellite Marker
variants are 15-100 bp long
Microsatellite Marker
variants that are 2 or 3 bp long
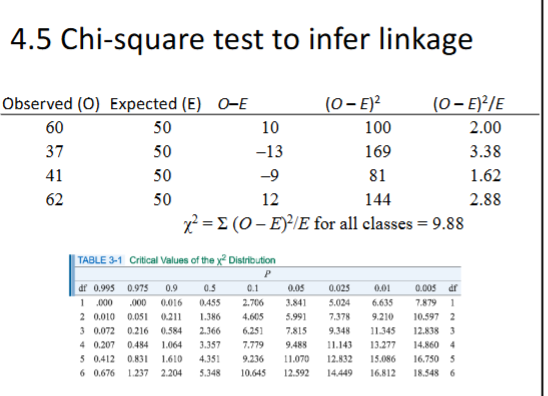
Chi-Square Test
used to infer genotypes and linkage between genes
- for linkage plug in observed progenies in chi square test to see if they deviation from the expectations of no linkage
- no linkage expectation: 1:1:1:1
- always four phenotypic classes, 3 df
Physical Maps
more accurate than linkage maps
- sequence based map of actual genomic DNA
- recombination maps represent hypothetical arrangement of genes on chromosome