Ap Macro Unit 3
1/55
There's no tags or description
Looks like no tags are added yet.
Name | Mastery | Learn | Test | Matching | Spaced | Call with Kai |
|---|
No analytics yet
Send a link to your students to track their progress
56 Terms
Aggregate is just a fancy word for
total and overall
aggregate demand
relationship between price levels and the quantity of aggregate output demanded by households, firms, and government
Aggregate Demand Curve x-axis (3) and y-axis and what does it look like?
x-axis: Real GDP(C+I+G+NX) / Real Output/Aggregate Output or Y
y-axis: price level (PL) of all goods
Downward sloping straight line labelled AD
Why is aggregate demand curve downward sloping, js name them (4)
Interest Rate Effect
Exchange Rate Effect
The Real Wealth Effect
The Multiplier Effect
Interest Rate Effect when price levels are rising of why aggregate demand curve is downward sloping
Price Levels are rising
To buy more goods or services you have to spend more money
You might not have so you might borrow
The banks are running short of money, so they want people to stop borrowing
So the banks will charge a higher interest rate
People will then just borrow less, and then overall spend less
Interest Rate Effect when price levels are falling of why aggregate demand curve is downward sloping
Price Levels are falling
So people can spend less money to buy the same amount goods
International Effect when price levels are falling in the USA of why aggregate demand curve is downward sloping
Price Levels fall in the United States
Price of US goods becomes more attractive relative to foreign goods
US Exports increase and US imports decrease
So the NX component of Aggregate Demand increases
International Effect when price levels are increasing in the USA of why aggregate demand curve is downward sloping
Price Levels increase in the United States
Price of US goods becomes less attractive relative to foreign goods
US Exports decrease and US exports decrease
So the NX component of Aggregate Demand decreases
Money Wealth Effect/ Wealth Effect when price levels are falling in the USA of why aggregate demand curve is downward sloping
Price Levels fall
Purchasing power increases, so your wealtheier than before
you will consume more goods and services
So consumption component of Aggregate Demand increases
What are the Determinants of Aggregate Demand, change in consumer spending
People spend their money → aggregate demand shifts right
People not spending their money → aggregate demand shifts left
What are the Determinants of Aggregate Demand, consumer expectations?
consumers optimistic → they spend more, shift right
consumer worried → they spend less, shift left
What are the Determinants of Aggregate Demand, changes in wealth?
when wealth rises → they spend more, shift right
when wealth decreases → they spend more, shift left
What are the Determinants of Aggregate Demand, js name them? (5)
Changes in Consumer Spending
Change in Consumer Expectations
Changies in Wealth
Changes in Investment Spending
Government Spending
Net Export Spending
Pattern of Determinants of Aggregate Demand and what is aggregate demand based on (same answer)
it matches the expenditure approach of calculating GDP (C+I+G+NX)
personal saving definition what is it and what’s the formula
part of disposable (after tax) income that is not consumed
S (Savings) = DI (Disposable income) - C (Consumption
what are the only 2 things you can do with your money?
save
spend/consumed
when you earn more income, what happens to savings and consumption?
they both increase
what is the word for negative savings, and what does it mean?
dissaving
consuming in excess of Disposable Income (DI)
what is propensity?
a fancy word for likelihood
what is the average propensity to consume (APC) formula?
Consumption (C) / Disposable Income (DI)
what is the average propensity to save formula?
Savings (S)/ Disposable Income
What does Average Propnesity to Consume (APC) + Average Propensity to Save (APS) have to equal
1
Marginal Propensity to Consume (MPC or MPE) formula and what does it mean
Change in Consumption/ Change in Disposable Income
Marginal Propensity to Save (MPC or MPE) formula and what does it mean
Change in Savings / Change in Disposable Income
What does Marginal Propensity to Consume (MPC) + Marginal Propensity to Save (MPS) have to equal?
1 meaning 100 percent
why the sum of MPC and MPS amust always equal 1?
because you can only save or spend
If an economy expands/shrinks and inc/dec spending what happens to price?
it doesn’t change
what happens when theres more spending and less spending?
more spending = inc GDP
less spending = dec GDP
multiplier effect story and what does it determine?
a change in a component of total spending leads to a larger change in GDP
basically a 80 dollars gets spents at someones shop, and the owner gets 80 dollars, and this adds to GDP, the owner than spends at another shop which adds to GDP
determines how much larger that change will be
multiplier effect formula and what does it mean when you end up calculating?
M= change real GDP / inital change in spending (or taxation that’s changing)
ex. multiplier effect = 3, so for every dollar spent in spending the Real GDP will increase by 3 dollars
spending multiplier effect 2 formulas and what do you use to (results in same thing)
1 / (1- mpc)
1/ MPS
use it when given spending
you plug into multiplier effect formula as what the equation
what do you do when you solve for the spending multiplier?
you plug into Multiplier Effect Formula for M
(M = Change in real GDP/ change in spending)
Tax Multiplier Effect Formula (2 both result in same), and when do you use it?
Tax Multiplier = -MPC/MPS or -MPC/(1-MPC)
the question will tell you if taxes are there
what do you need to remember to do for multipler effect formulas
put negatives and positives
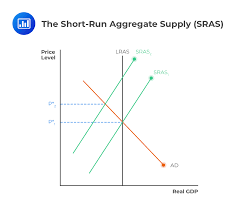
what are the 2 aggregate supply curves
short run aggregate supply
long run aggregate supply
what are short run and long run based of
the flexibility of wages and input prices
what does a short run supply curve look like and x-axis, y-axis?
upward sloping curve
you need to label it as SAS or SRAS
X-Axis: Real national Output
Y-Axis: Price Level
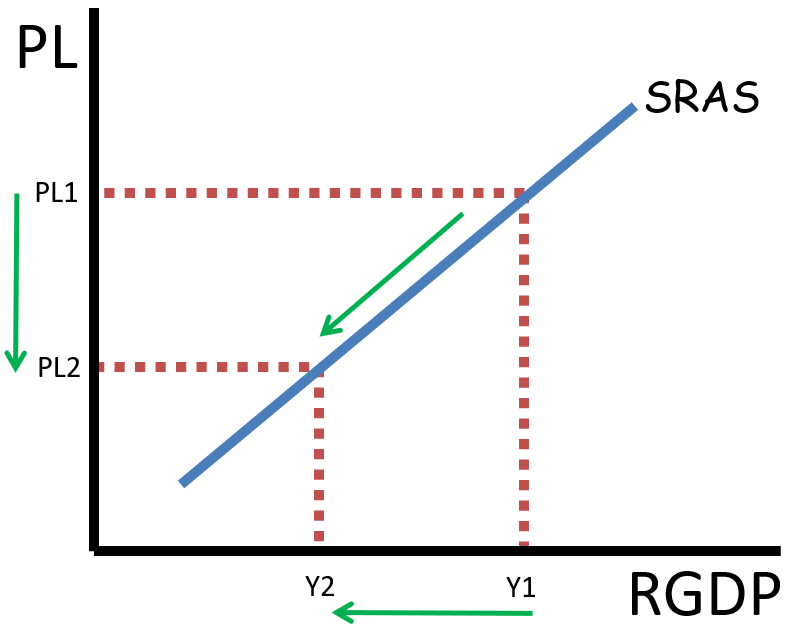
why is short run supply curve (SAS or SRAS) upward sloping js name them
Sticky Wage Theory, Sticky Price Theory
why is short run supply curve (SAS or SRAS) Sticky wage theory
during production times, nominal wages are slow to adjust when price levels adjust
why is short run supply curve (SAS or SRAS) sticky-price theory and why is this true (2)
nominal price of g/s/resources are slow to adjust too in economic conditions
deciding how much a product should cost is based on the cost of production, marketing, and delivery of the product, once a price is determined it is stuck for a period of time
so they will simply alter output instead of changing prices
also there are costs to adjusting prices, called menu costs
menu costs
costs to adjusting prices
What are the Determinants of Short Run Aggregate Supply (3 that have things under)?
Changes in resource/input prices
land (natural resources), labor (wages), capital (tools/machines)
Changes in Productivity
Worker productivity
Technology
Changes in Government Regulations
Safety
Environmental
what is the relationship between real gdp and unemployment and why
inverse
real GDP increases which means more stuff is being made, so more workers are needed so unemployment decreases
real GDP decreases which means less stuff is being made, so less workers are needed so unemployment increases
what does aggregate supply and aggregate demand represent?
supply: total production of an entire economy
demand: the total demand for an entire economy
what are the reasons that aggregate demand would shift? (6)
changes in all of the components of aggreage demand:
consumption (C)
investment (I)
government spending (G)
exports (X)
imports (M)
in the long run aggregate supply what do you need to know
there is no talk of changes in the price level, no prices are assumed to be held constant
long run aggregate supply curve what does it look like and what does it mean?
because price level doesn’t affect real GDP, the curve is vertical
in the long run, the quantity supplied is the same regardless of the price level (which is based on f.o.p)
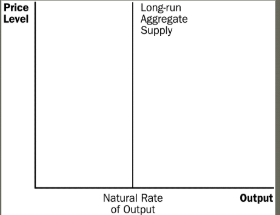
what are the other names of long run aggregate supply curve? (3)
Potential Output
Full-employment output
natural rate of output
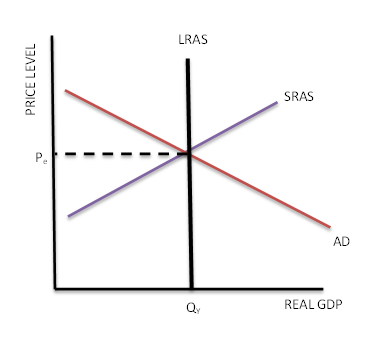
what does long run equilibrium look like and what do you call the real gdp level equilbirium on the real gdp?
all of them need to intersect at the same point for it to be in equilibrium
Y*
Yp
YF
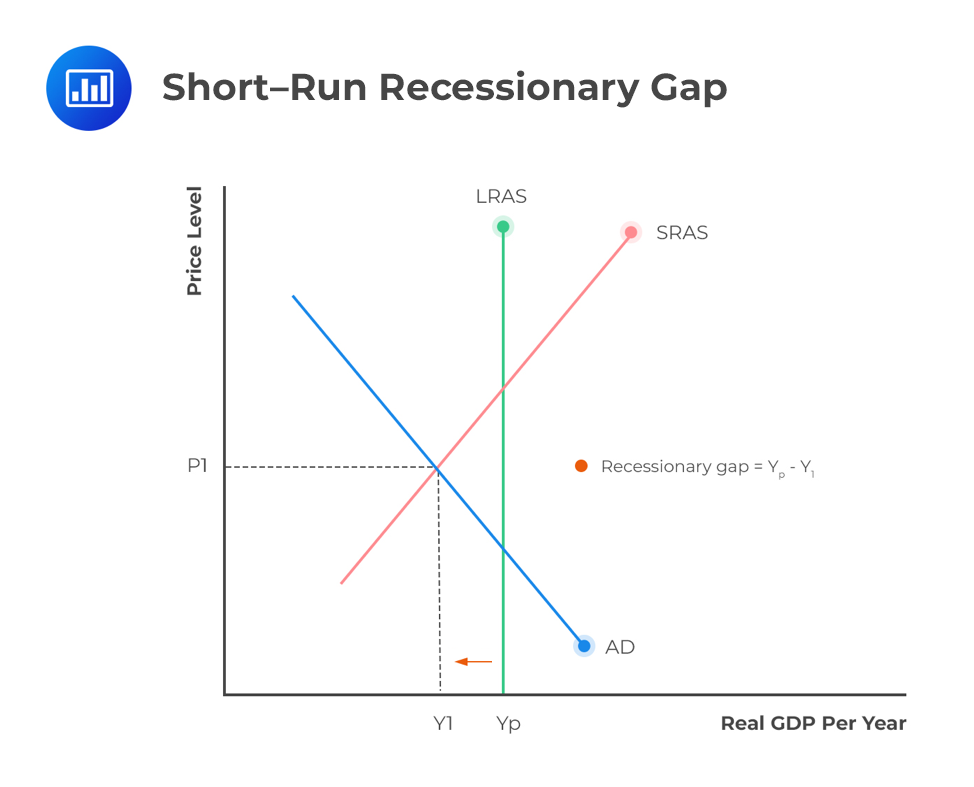
what does a graph look like when your economy has a recessionary gap (how do you draw it) and what does it mean?
you draw the Short Run Aggregate Supply Curve (upward sloping)
Aggregate Demand (downward sloping)
LRAS is to the right of equilibrium between aggregate demand and short run aggregate supply
the difference between the potential GDP and actual GDP
what is option A and option B for fixing recessionary gap?
option A: do not do anything
option B:
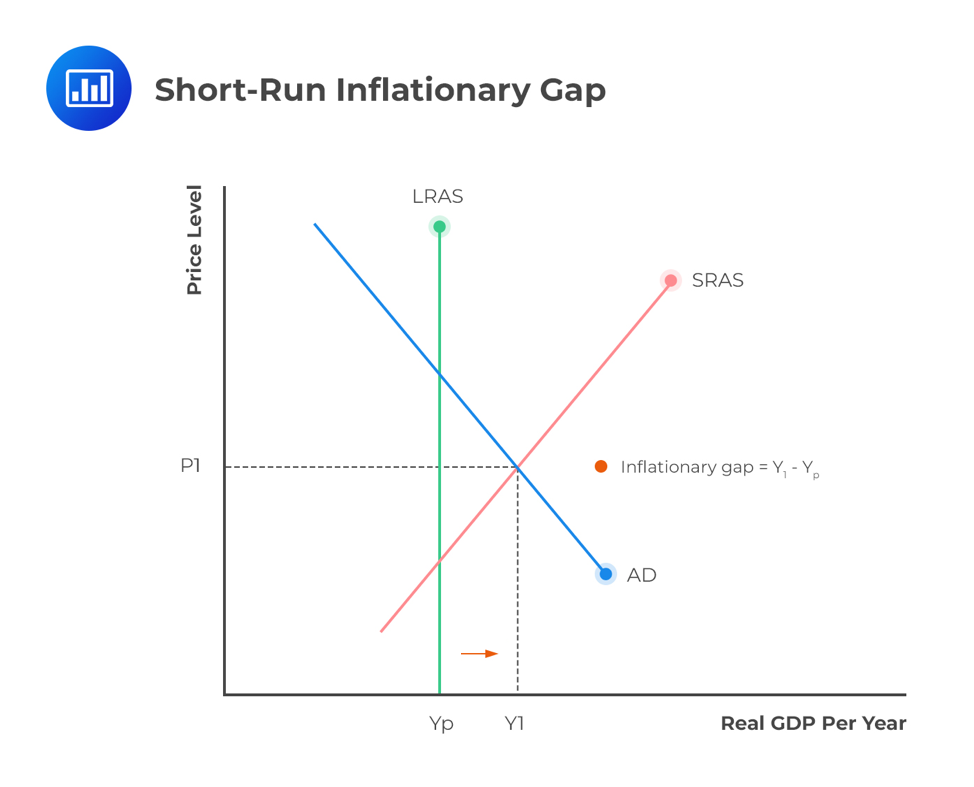
what does a graph look like when your economy has a inflationary gap (how do you draw it) and what does it mean?
you draw the Short Run Aggregate Supply Curve (upward sloping)
Aggregate Demand (downward sloping)
LRAS is to the left of equilibrium between aggregate demand and short run aggregate supply
the difference between the potential GDP and actual GDP
price level is too high,
can you achieve a real gdp above your potential gdp?
yes
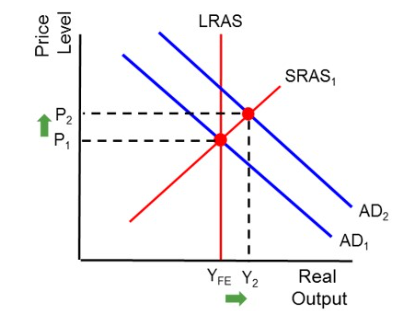
what does a demand pull inflation (short run) mean and look like?
LRAS to the left
aggregate demand went up (shift right)
so output increases, price level increases, nominal wages = so real wages decreases
this is because price level increases, and nominal wages stays the same
this causes
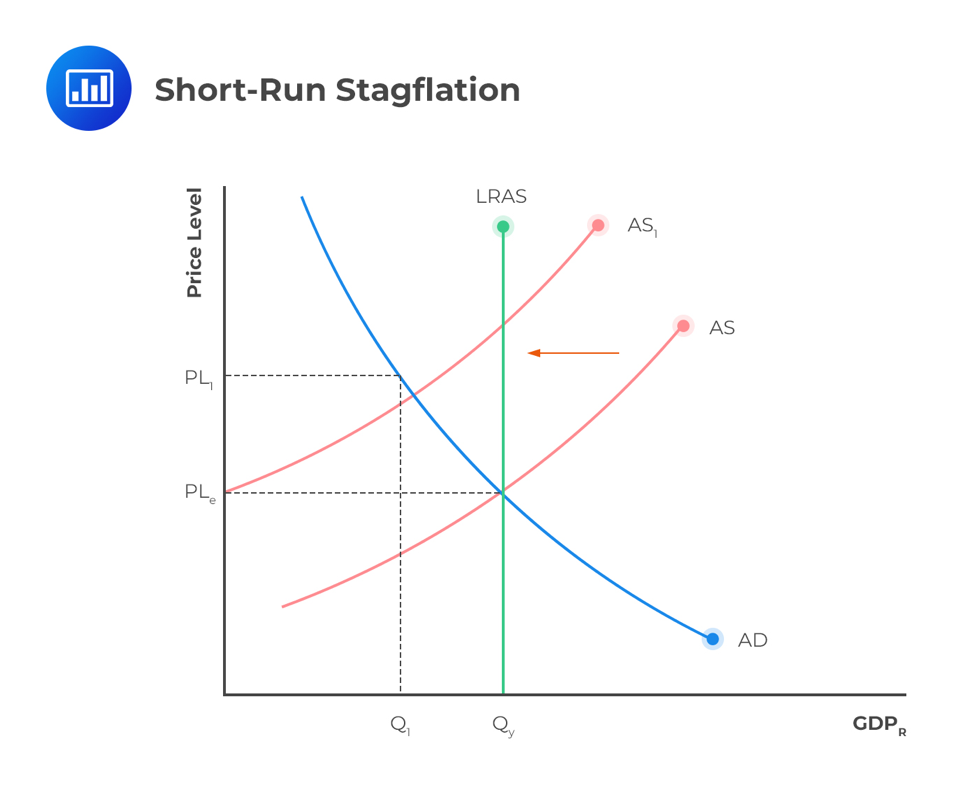
what does stagflation mean, look like, and whats another name for it?
SRAS decreases (all curves straight lines)
people losing their jobs, and the price level going up
unemployment rise → decrease in resource costs → businesses want to increase production → so SRAS goes back and the economy goes back and fixes itself
cost push inflation
short run nominal wages are what
sticky (they stay the same)