3.1: Correlation and Variate Relationships
Two-Variable (Bi-Variate) Relationships
- Explanatory variable: a variable that attempts to explain or influence observed outcomes
- What is being used to make the prediction
- Displayed on the x-axis
- Response variable: a variable that measures some outcome
- What is being predicted
- Displayed on the y-axis
Describing Scatterplots and Bi-Variate Data: FUDS
- Form: linear, curve, u-shape, etc.
- Unusual Points: outliers, influential points
- Outlier: a point with a large residual (usually decreases the correlation)
- Influential: a point which draws the line toward it (usually increases the correlation)
- Direction: positive or negative association (or neither)
- Positive association—as one variable increases, so does the other
- Negative association—as one variable increases, the other decreases
- Strength: how closely the points follow the form
- Strong, weak, moderately strong/weak
Residuals
- Individual points with large residuals are outliers in the y direction because they lie far from the line that describes the overall pattern
- Individual points that are extreme in the x direction may not have large residuals, but can be very important; such points are influential if removing them would markedly change the results of the calculation
Correlation (r)
- Gives the direction and strength of a linear relationship
- Does not imply causation
- Makes no distinction between explanatory and response variables
- Can switch x’s and y’s and they would still be correlated
- Both variables must be quantitative
- Standardized and will not change if we change/convert units of measurement from x, y, or both
- r itself has no units
- Positive r = positive association
- Negative r = negative association
- Correlation only measures strength and direction of linear relationships
- -1 ≤ x ≤ 1 always
- The closer r is to 1 or -1, the stronger the linear form
- The closer r is to 0, the weaker the linear form and the more scattered the points are
- r does not tell the whole story
Displaying Data
Two-Way Tables
- Two-way table: a table that displays data for two categorical variables about the same group of individuals
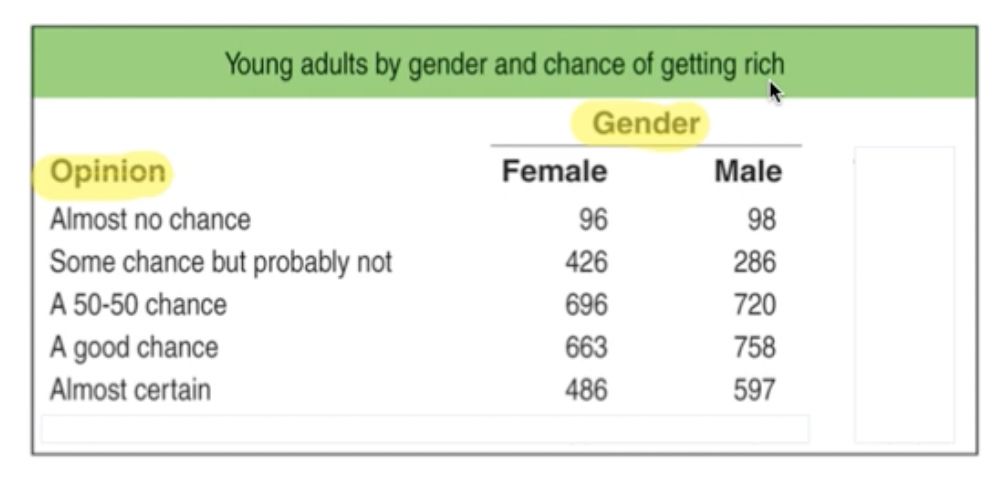
- Marginal distribution: the total for one categorical variable
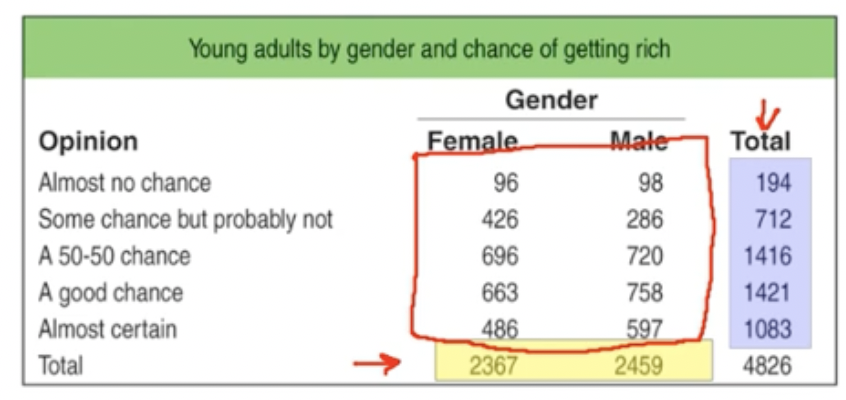
- The yellow box shows the marginal distribution for gender, and the purple box is the marginal distribution of opinions
- Conditional distribution: the distribution within just one value of one variable
- Often uses language of the probability of A “given” B
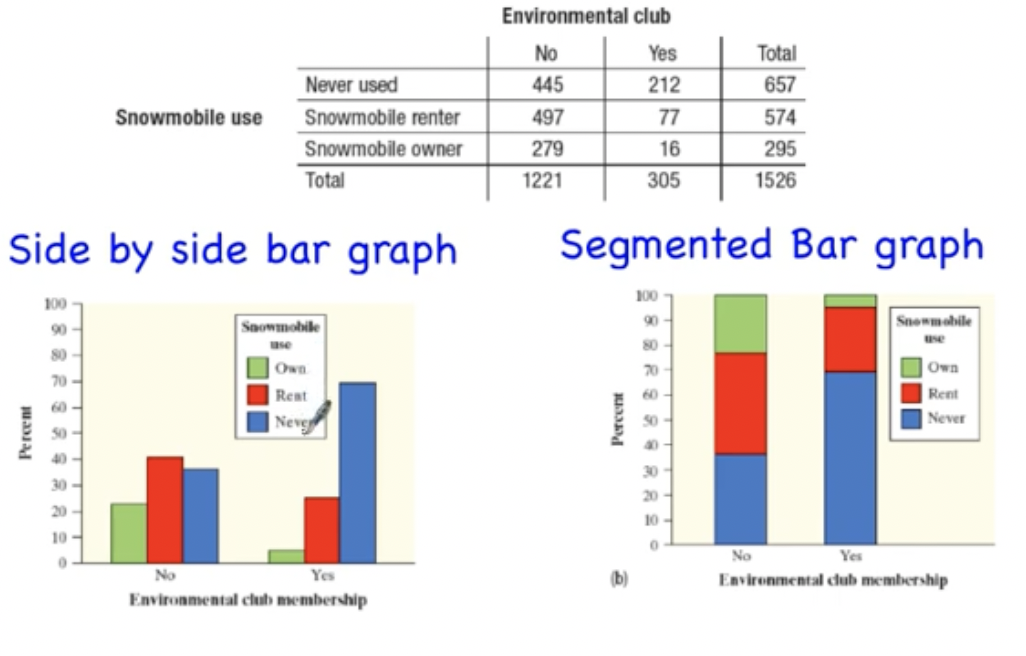
Segmented Bar Graphs
Also known as segmented bar charts
Segmented bar graph: a chart that displays categorical data as a percentage of the whole
- Similar to a pie chart
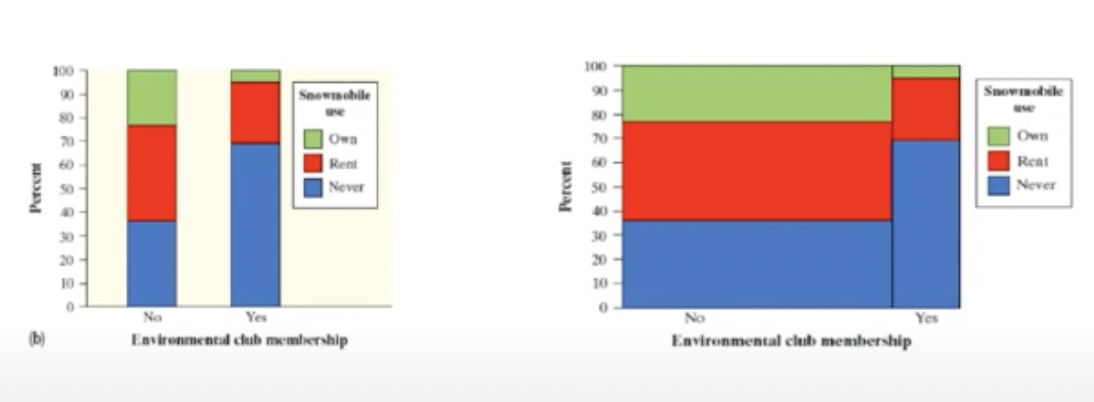
Mosaic Plots
- Mosaic plot: a segmented bar graph used to compare groups where the widths of the bars are proportional to the size of the groups
- Mosaic plots of the same data from the previous section: