Week 8 (25.03.2025) - Expectations, Consumption, and Policy
1/12
There's no tags or description
Looks like no tags are added yet.
Name | Mastery | Learn | Test | Matching | Spaced | Call with Kai |
|---|
No analytics yet
Send a link to your students to track their progress
13 Terms
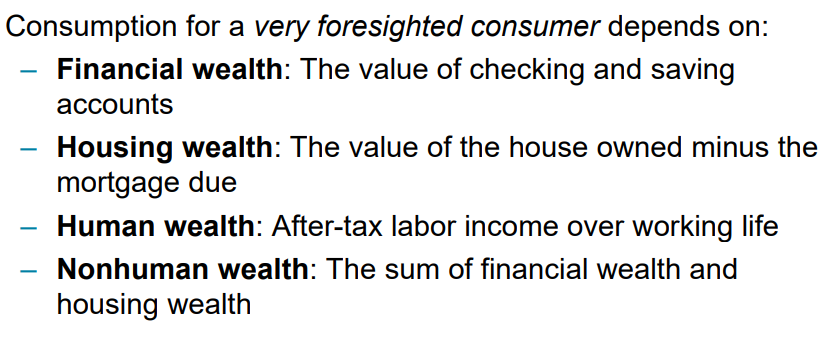
Consumption for a very foresighted consumer depends on:
Consumption decision:
If you want to consume the same amount every year, the constant level of consumption that you can afford equals your total wealth divided by your expected remaining life.
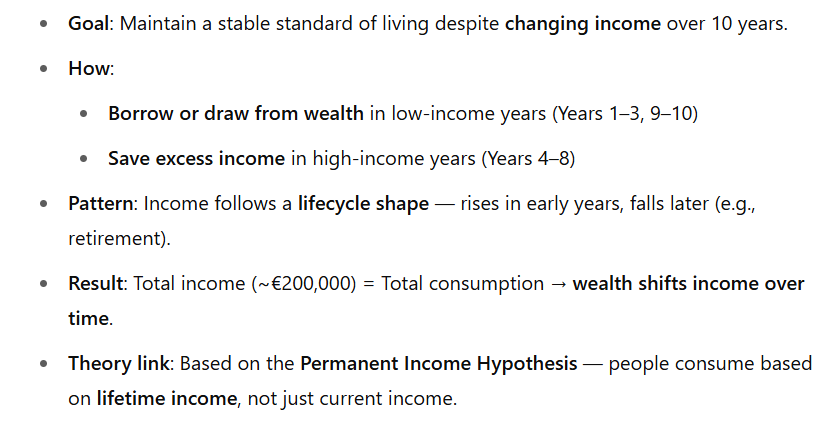
Consumption smoothing
a. Reduction in expected future real dividends
• Effect: non-human wealth ↓ → consumption ↓ → IS curve shifts left • Explanation: Lower expected dividends reduce household wealth, which decreases consumption. This shifts the IS curve to the left, as lower consumption means lower aggregate demand at each interest rate
Increase in expected future real after-tax profits
• Effect: present value of profits ↑ → investment ↑ → IS curve shifts right
• Explanation: Higher expected profits increase the present value of investment projects, stimulating more investment. This shifts the IS curve to the right, as higher investment increases aggregate demand.
c. Reduction in expected future taxes
• Effect: human wealth ↑ → consumption ↑ → IS curve shifts right
• Explanation: Lower future taxes increase households' lifetime disposable income (human wealth), leading to higher current consumption. This shifts the IS curve to the right.
d. Reduction in current cash flow (or current profits)
• Effect: investment ↓ → IS curve shifts left
• Explanation: Lower current profits/cash flow reduce funds available for investment, decreasing current investment spending. This shifts the IS curve to the left.
e. Increase in the real money supply in the current period
• Effect: LM curve shifts down, no shift of IS curve
• Explanation: An increase in real money supply increases the supply of loanable funds, lowering interest rates at each level of income. This shifts the LM curve downward. The IS curve is unaffected as it represents the goods market.
f. Reduction in expected future real interest rates
• Effect: human and non-human wealth ↑, present value of profits ↑ → IS curve shifts right
• Explanation: Lower future interest rates increase the present value of future income and dividends (both human and non-human wealth) and increase the present value of investment projects. These effects increase consumption and investment, shifting the IS curve to the right.
g. Reduction in expected future income
• Effect: human wealth ↓ → consumption ↓ → IS curve shifts left
• Explanation: Lower expected future income reduces households' lifetime resources (human wealth), decreasing current consumption. This shifts the IS curve to the left.
h. Increase in government spending in the current period
• Effect: G ↑ → IS curve shifts right
• Explanation: Higher government spending directly increases aggregate demand, shifting the IS curve to the right.
Role of Expectations in IS-LM
Short-run monetary expansion (not considering expectations):
Increases money supply → LM curve shifts down → interest rates fall → normally output rises.
📉 Why the IS curve gets steeper with expectations:
People expect policy reversal → don’t spend more now.
Firms look at long-term rates, which may not change much.
Inflation expectations rise → real interest rate doesn’t fall as much.
Low central bank credibility → people expect inflation, not growth.
➡ Result: Less response to lower interest rates → steep IS curve → small output change.
🔁 Two Scenarios: 🔹 Small effect (no expectation change):
LM shifts ↓, IS stays → small move A → B
Modest rise in output
Effect comes only from current interest rate drop (direct effect)
🔹 Large effect (expectation shift):
LM shifts ↓, IS also shifts →
People expect higher future income and lower future rates
Spending and investment rise more → big move A → C
(full effect)
Government spendings and expectations
🔻 When Deficit Reduction Decreases Output (Short Run)
• Expectations don’t change → People focus on immediate spending cuts → less demand → IS shifts left → output falls
• No monetary expansion to offset the cut → lower government spending leads to contraction
• Low credibility → If markets don’t trust the government to follow through, no positive expectations arise
• Front-loaded cuts → Big spending cuts now hurt demand before positive effects can appear
🔺 When Deficit Reduction Increases Output (Short Run)
• Expectations improve → People believe deficit cuts will help the future (e.g. lower debt, lower taxes) → they spend more now → IS shifts right
• Backloaded programs → Small cuts now, bigger later → less short-term pain, but expectations still rise
• Debt crisis situations → If markets are worried, a credible deficit cut lowers interest rates → boosts investment → offsets demand loss
🧠 The Role of Expectations in IS Curve Shift
• ↓ Current government spending (G) → IS shifts left
• ↑ Expected future output (Yᵉ) → IS shifts right
• ↓ Expected future real interest rate (rᵉ) → IS shifts right