12 ATAR Economics: Trade
1/61
There's no tags or description
Looks like no tags are added yet.
Name | Mastery | Learn | Test | Matching | Spaced | Call with Kai |
|---|
No analytics yet
Send a link to your students to track their progress
62 Terms
Globalisation
- the process by which the world is becoming increasingly interconnected.
- characterised by the growth in trade and international investment and by the rapid movement of information and people around the globe.
- "opening up" of international borders to the free movement of goods, services, workers, tourists and financial capital= world become more integrated + interdependent.
- argued to be the most important factor in raising the living standards of the world's population
COVID 2020 and globalisation
- world was plunged into its deepest economic contraction since the Great Depression of the 1930s.
- to control the spread there was lockdowns and strict borders domestically and internationally.
- some countries dealt with it quickly and efficiently- Aus and NZ, some not US and EU.
- benefit of a globalised community is that it enabled a coordinated effort to develop and disseminate a vaccine more quickly than in a non-globalised world.
What 4 trends did the World Trade Organisation (WTO) identify as affecting the relationship between trade and development since the start of the millennium?
•The economic growth of many developing countries
•The growing integration of global production through supply chains
•The increasing interdependence of the worlds economy, which causes shocks to reverberate more quickly and globally (e.g. the GFC and COVID)
•The higher prices for agricultural good and natural resources
Australia's linkage with TRADE (statistics)
•Exports contribute 25% of Australia's GDP (total goods flowing out of Aus= $536bn)
•25% of Australian workers are involved in trade related activities.
•Australia major exporter of iron ore, coal, natural gas, gold and bauxite
•Imports large quantities of capital goods, machinery, motor vehicles and consumer goods (total goods flowing to Aus = $444bn, total services flowing to Aus= $143bn)
Australia's linkage with IMMIGRATION
• vital source of skilled workers to Australia
• 30% of Australia's population born overseas.
• 2023- net migration to Aus was a record high of 518,000 which means that the population was boosted by over half a million people (migrants to Aus=737000, out of Aus= 219000)
• Aus has numerous global significant industries-agricultures, tourism, fuels and mining, foreign students, investment fund assets
Australia's linkage with TOURISM
•International tourism ranks 4th (after fuels, chemicals and automotive products) in global exports.
•Accounts for 30% of world's exports of commercial services.
•Overseas tourists (personal travel services) is Australia's 6th ranked export.
•Australian tourists traveling overseas is Australia's 1st ranked import.
•This means that more Australians travel overseas (11 million in 2024) than overseas tourists visit Australia (8 million in 2024)
Australia's linkage with FOREIGN INVESTMENT
- Aus always relied on foreign investment to supplement its domestic savings to help fund economic development
•The mining sector wouldn't have developed without it
•Foreign investment into Australia in 2024 $245b
•Australian investment abroad in 2024 $142b
Australia's globally significant industries
2nd largest exporter of beef
largest exporter of iron ore, coal and liquefied natural gas (LNG)
2nd largest producer of gold and wool
agricultural products - 12th largest exporter in the world
fuels and mining, education - 4th largest exporter in the world
financial services - 9th largest exporter in the world
largest producer of lithium, zircon, titanium mineral sands, iron ore and bauxite
investment fund assets - 3rd largest in the world
3rd largest exporter of copper ores
international tourism - 11th largest exporter in the world
US, China and Germany trade
•US, China and Germany have the largest economies and dominate world trade
-Make up 30% of world merchandise exports
-China = largest exporter
-USA = largest importer
-All three = largest commercial service exporters
Importance of trade for Australia (1)
- large part of the Australian economy- 48%of GDP.
- important driver of economic growth. Over the past 30 years, Australia's economy has doubled in size; exports have accounted for over a quarter of this growth
- Trade liberalisation over past 30 years has benefited the Australian economy, with both real GDP and real income being much higher than otherwise.
- many Australian jobs rely on trade; 1 in 5 Australian workers are employed in a trade-related activity (workers in export-focused industries like agriculture, minerals and energy, but also, in the many industries involved with the importation of goods and services)
Importance of trade for Australia (2)
- Consumers= big beneficiaries of trade: access to a wider variety of G&S at more competitive prices, boosting living standards. (price of audio, visual + computing equipment has fallen over 50% in the past 5yrs)
- Imports reduce Australian production costs and increase employment. Over half of all Australian imports are essential inputs that businesses use to produce goods locally.
- Exposure to competition from overseas compels Australian firms to innovate and adopt more efficient production methods. More efficient resource use boosts growth
Importance of trade for Australia (3)
•Australian economy has always relied on the international sector for the sale and purchase of goods and services and investment.
•Once known as a 'small open economy' due to population size & GDP, but no longer known as small as our population is over 26 mil and annual GDP over $2.5trill.
•'open' economy as the movement of goods and services and capital is unrestricted.
•Australia has reduced protectionist policies to historically low levels.
- exports add to national income which can then be used to consume imports= promote growth + high living standards
Australian trade statistics
•By 2024, total trade in Aus increased to nearly 50% of GDP.
•On the world stage, Australia is a relatively small exporter- accounting for just 1.5% of WORLD exports, compared with around 11.5% for China, the worlds leading exporter.
•Australia is ranked 21 as a world exporter but is the 12th largest economy-only economy located in the southern hemisphere and most in the north- location.
Trade Intensity
•useful way to measure the importance of international trade is to calculate the share of trade in its GDP.
•This trade-to-GDP ratio is often called the 'trade openness ratio' or the 'trade intensity ratio'.
• a sum of exports and imports of G+S as a percentage of GDP. The ratio can be expressed as:
Trade Intensity = [(X+M)/ GDP] x 100
- Australia's trade intensity= 48 (in 2023) increasing from 34% in 1992- only US, China, Brazil + Japan have lower ratios as large economies dont need to rely on trade as much as small economies like AUS (aus also has geographic isolation)
Composition of Australia's trade
- once known for its exports in agricultural sector (wool, meat, wheat) however large growth in wealth in mining, energy + rural resources caused mining industry to take over (Exporter of primary commodities- iron ore, coal, natural gas)
- exports of manufactured goods declined dramatically from 24% in 1990 to 11% in 2024
- service exports declined (normally between 20-25% of total exports, now at 18% due to impact of covid decimating export of both education + tourism= Aus' 2 most important services)
• Importer of manufactured goods (33%) + financial capital
• trade and investment has always played a large role in the development of the Australian economy (grew to medium sized economy)
Direction of Australia's trade
- significant shift from Europe (exports decreased from 15-7%, imports from 24-20%) to the Asia-pacific region (account of >80% of exports, 70% of imports)
- China, Japan, US + SK= >50% of Australia's total 2-way trade
- China now Aus' leading trade partner (33% share exports, 20% imports), followed by Japan (2nd most export-13%), US (2nd most import source- 12%)
- from 2000, share of exports to Asia have increased from 56-80%, imports from 43-56%
- Aus had strong ties w/ UK + europe but when they joined the European Union, Aus was forced to establish new markets
- Asia= lower transport cost, large + growing population (2/3 of the world), limited supply of raw materials + fast growing economies of East asia require long term supplies of cheap energy (coal, natural gas, iron ore)
The World Trade Organisation (WTO)
- AUS is a member of many international organisations (WTO, G20, Asia-Pacific Economic Cooperation)
- purpose is to increase trade and investment to promote Aus' long term economic growth and prosperity
- WTO= most important, established in 1995, intergovernmental organisation charged with regulating global trade between nations, a key driver of globalisation + aims to maintain safe global trade + raise living standards where countries can trade with clear rules, standards and ways to resolve disputes
-Successor to the General Agreement on Tariffs and Trade
•Since 1948 the GATT had provided rules for the international trading system + mainly dealt with the trade in goods, WTO added trade in service and IP
- 164 member countries (2020) = 98% of world trade
• Member countries have access to the WTO's experts whether that be economists, lawyers, statisticians or communications experts, which can help effectively facilitate trade agreements.
• WTO promotes multilateralism - alliance of multiple countries pursuing a common goal
Role of WTO and how they achieve this role
Role- Deals with rules of trading between countries, Aims to build trade capacity of developing countries + to Ensure trade flows smoothly and freely
How?- Negotiating the reduction/elimination of obstacles to trade such as import tariffs + Agreeing on rules governing the conduct of international trade such as antidumping and subsidies.
•Since 1945 there have been a number of rounds of multilateral trade negotiations which have been successful in cutting tariffs from an average of around 40% to around 4% on industry goods in developing economies
Key principles of WTO
> Non-discrimination - country shouldnt discriminate between its trading partners, between its own and foreign products/services = “national treatment”, “most favoured nations”
> Opening trade - Lowering trade barriers to encourage trade ( tariffs and measures- import bans/quotas)
> Fair competition - Discouraging "unfair" practices (export subsidies, dumping products at below normal cost to gain market share)
> Protection of the environment - permit members to take measures to protect not only public, animal + plant health but also the environment (members mustn't use these as a means of introducing discriminatory trade barriers)
Free Trade Agreements
- agreements between two or more countries that involve cooperation countries to reduce trade barriers in order to increase trade of goods and services with each other. Aims to standardize import and export laws and regulations.
- attractive as it may be easier for small group of neighbouring countries w similar concerns to agree on market opening in particular area
- has risks + may be discriminatory, making it harder for countries outside group to trade w those inside, may discourage further opening of markets= limit growth for all= acts as a 'trade bloc'
- FTAs= increased economic activity= more employment oppurtunities, make it easier for Aus businesses to access foreign markets + provide Aus consumers better access to wider range of G&S
2 principles FTAs must adhere to
- eliminate tariffs and other trade restrictions on 'substantially all the trade' in goods between the member countries, and
- eliminate substantially all discrimination against service suppliers from member countries.
Trade bloc
- group of countries that agree to reduce trade barriers between themselves, but impose barriers on countries outside of it
- typically applies a common external tariff on G&S imported from countries outside the bloc
- most important= EU, North American FTA, Association of South East Asian Nations (ASEAN)= 60% of world trade
- EU most powerful bloc, consisting of 27 countries removing all trade barriers w each other so they can trade freely
Trade creation vs diversion
CREATION= removing trade barriers to help increase the volume of trade between members
DIVERSION= when trade is diverted from a low cost producer outside trade agreement, to a high cost producer within the group (seen as a potential disadvantage)
Bilateral + regional trade agreements
Bilateral= made between 2 contracting parties
Regional= between 2+ contracting parties that share some common denomination known as a "region"
- purpose of these is to reinforce trade relations between the members.
Australia's position on trade
- Australia seeks to strengthen its global economic position through free trade agreements.
- It prioritizes economic growth, market access, and trade diversification.
Key FTA #1 - Australia - United Kingdom (A-UKFTA)
- signed on 17 December 2021 and entered into force on 31 May 2023.
- UK = significant trading partner for Australia, with $13 billion in exports and $18 billion in imports in 2023.
- contains commercially significant commitments that creates new export opportunities and reduce input costs for business, strengthen trade diversification, and help ease cost-of-living pressures for consumers
- the agreement has eliminated tariffs on over 99% of Australian goods exports to the UK.
- Australian businesses will save approx $200 million annually from elimination of tariffs on UK imports.
Key FTA #2- ASEAN-Australia-New Zealand Free Trade Agreement (AANZFTA)
The government has entered into a comprehensive ASEAN-Australia-New Zealand (AANZFTA) free trade agreement; with negotiations covering sectors including goods, services, investment and intellectual property. (Commenced 1 January 2010)
Key FTA #3- Australia New Zealand Closer Economic Relations Trade Agreement (ANZCERTA)
similar to an FTA but also includes non-trade related issues. It is one of the most comprehensive bilateral free trade agreements. (Took effect in January 1983). Aim of increasing the volume and value of trade
Key FTA #4- China Australia Free Trade Agreement (CHAFTA)
- Significant FTA as China is Australia's largest exporter for both G&S
- key outcomes include removal of Chinese tariffs on Australian dairy, beef, seafood and wine exports, the removal of tariffs on all Australian resource and energy exports; new or significantly improved market access into China for Australian banks, insurers, law firms and professional services suppliers, education services exporters, as well as health, aged care and construction companies
Gains from Trade (specialisation)
• Any form of trade/exchange involves gains to both the buyer + seller, whether at international or personal level
•Specialisation - countries and people specialise in tasks to which they are best suited and in which they have an advantage.
-Surplus production can then be exchanged or traded for other G&S
-International specialisation is made possible because of the uneven distribution and quality of resources between countries.
Efficiency= Relative efficiency is measured by opportunity cost, reflects the real cost of production
•Countries gain from both exports and imports- Both result in net increase in total surplus
Absolute Advantage (AA)
•A country has an absolute advantage in the production of a good if it can produce that good more efficiently than the other country.
•More efficiently=using less resources to produce a given quantity of output, or to produce more output from a given quantity of resources.
Comparative Advantage (CA)
•A country is said to have a CA in producing a g/s if it can produce it at a lower opportunity costs than another.
•When a country has an AA in the production of both goods, it’s CA lies where its absolute advantage is greatest.
- The country that has no AA has a comparative advantage where is absolute disadvantage is smallest
•Countries are better off if they export G&S in which they have a CA and import those in which they have a comparative disadvantage.
Sources of Comparative Advantage
•Determined by the quantity and quality of the nations human, natural and capital resources.
•Also includes technological processes
•Can be based on differences in climate and endowment of national resources
•Not all countries approach trade based on CA, as they want to protect certain industries.
Exports- comparative advantage
•A country will export a g/s if it has a CA in that g/s
•The demand/supply model determines the relative price of a good= opportunity cost.
-Meaning, by comparing the domestic price (Pd) with the world price (Pw) of a good, we can determine if a country has a CA.
-If the Pd is lower than the Pw, then the country must be more efficient in producing that good and will benefit from exporting the good.
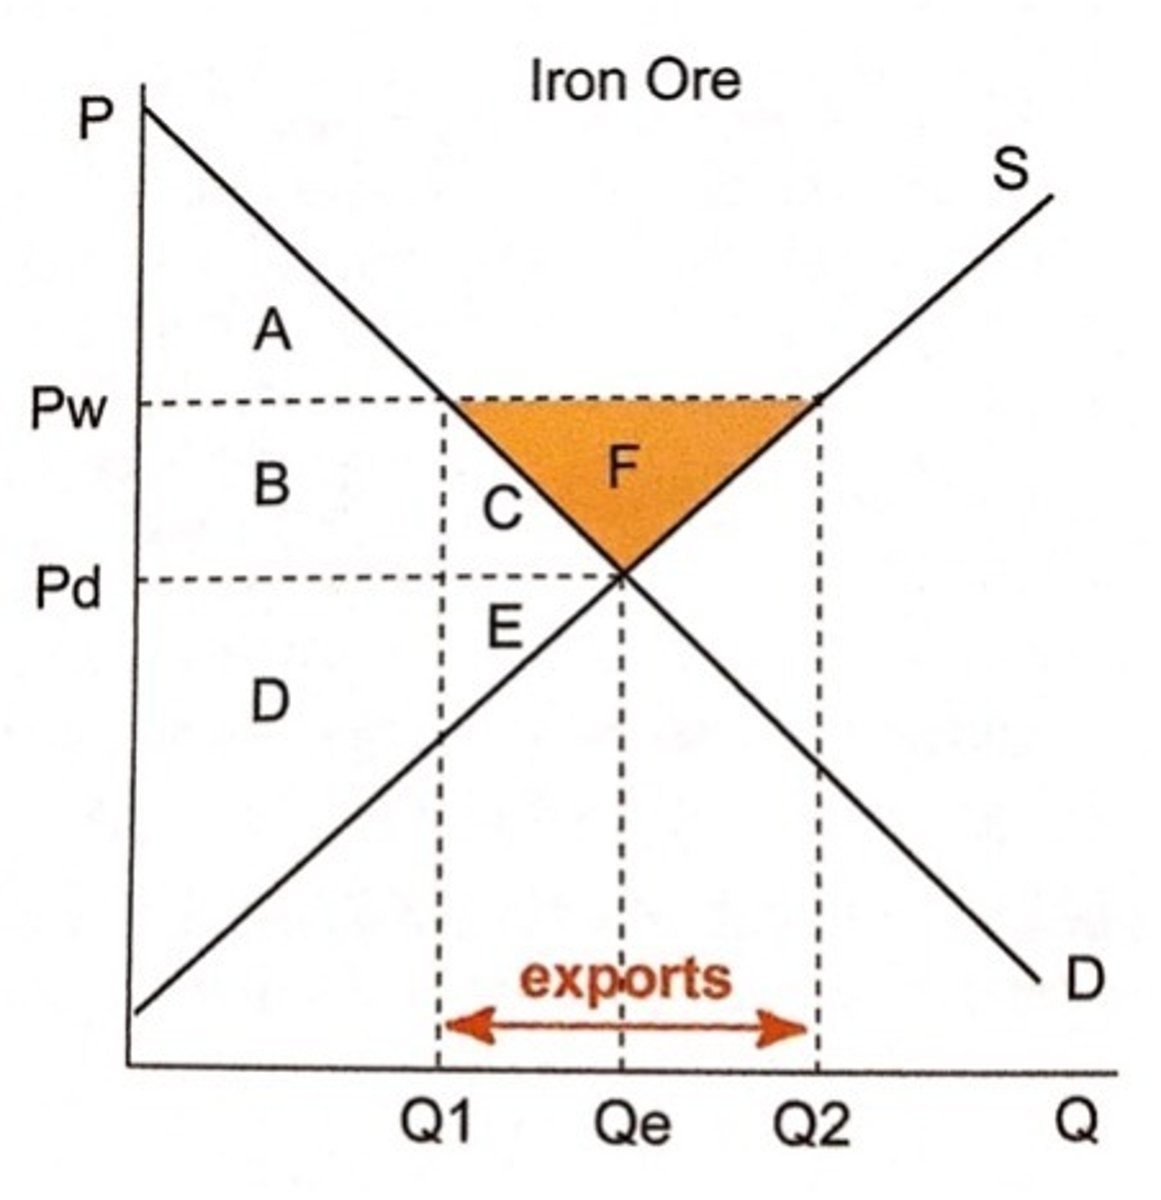
Gains from exports (iron ore) graph- before exporting
•Pd of iron ore is lower than the Pw
•If Australia enters the international market it can sell iron ore at the higher world price.
- iron ore production + consumption at Qe
- consumer surplus = A + B + C
- producer surplus = D + E

Gains from exports (iron ore) graph- after exporting
•Aus can now sell iron ore at higher Pw
•Iron ore consumption falls to Q1 (demand), production increases to Q2 (supply)
•Australia will now export iron ore equal to Q1Q2
•Iron ore consumer in Australia will lose- now have to pay more for iron ore= consumption will drop domestically (consumer surplus= A)
•After trade, producers gain by selling more and receiving a higher price (producer surplus= BCDEF), they gain B+E from consumers + F= net gain
•producers gain more than consumers lose so Australia should still export iron ore
-Overall economic welfare + total surplus will increase
Imports- comparative advantage
•If a country does not have a CA in producing a good, then the domestic price will exceed the world price
•The rest of the world is relatively more cost effective in producing the good
In this case it would benefit the country by importing the good
Gains from imports (computer industry) graph- before importing
•Pd of computers is above the Pw so Aus will benefit by importing the cheaper foreign good
- production and demand at Qe
- consumer surplus = A
- producer surplus = B+C
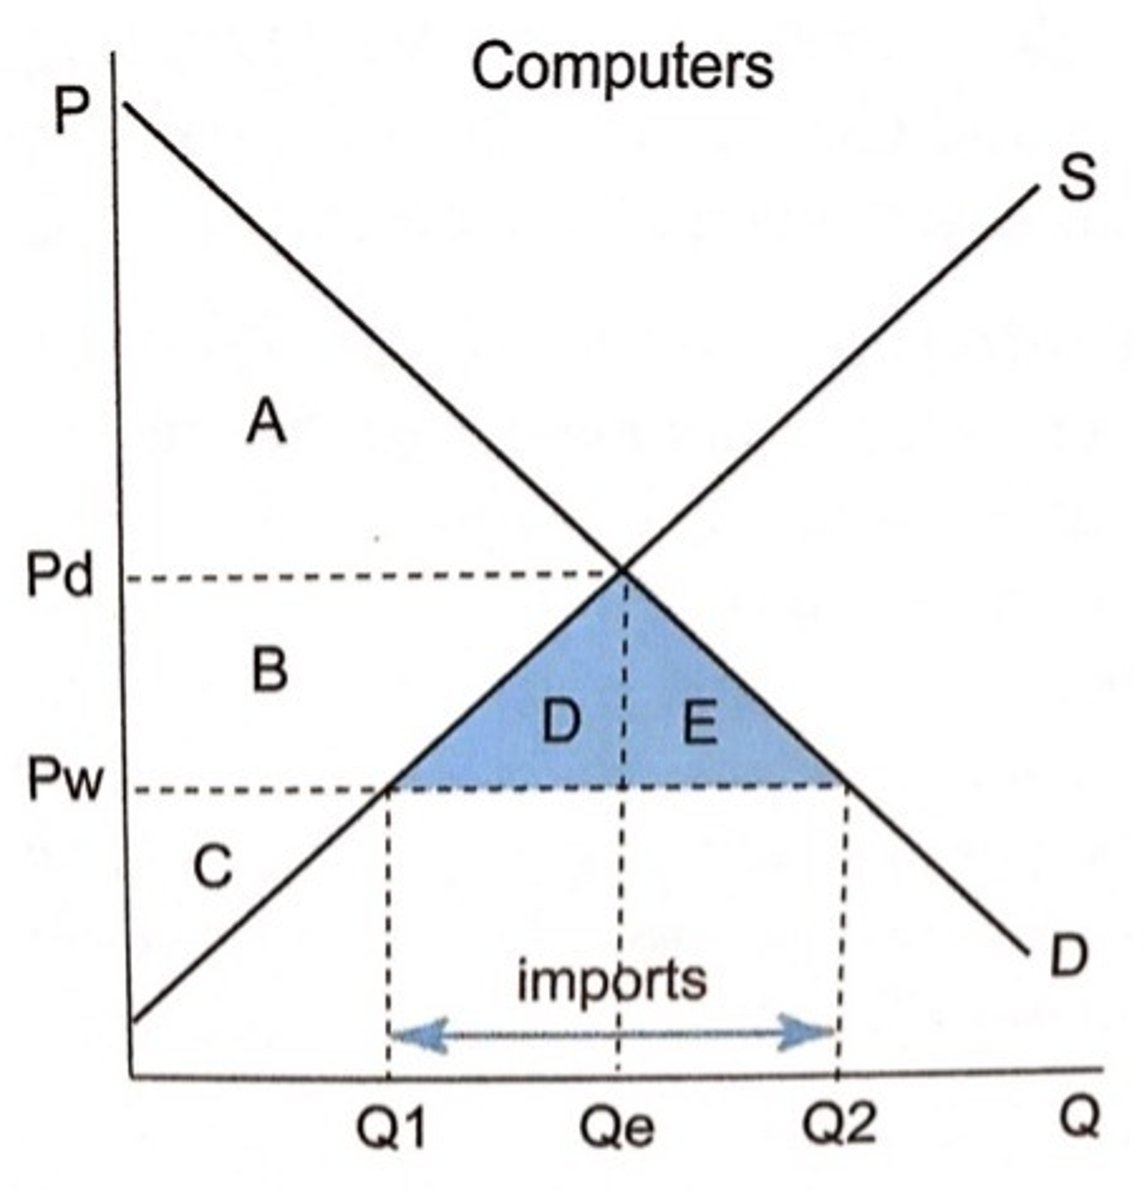
Gains from imports (computer industry) graph- after importing
•Consumption will increase to Q2, Production decrease to Q1
•Computer imports equal Q1Q2
•Domestic producers lose as they receive lower prices and sell less; producer surplus= C
•Domestic consumers gain from the lower price; consumer surplus= A + B + D + E
- D+E= net gain from imports + consumers gain more than producers lose overall
• thus Economic welfare + total surplus increases
Protection
•Any action by the government designed to give the domestic producer an artificial advantage over a foreign producer.
1. Those that increase domestic price of the foreign product such as a tariff
2. Those that provide domestic producers with a cost advantage such as a subsidy
3. Those that impose a quantitative restriction such as quotas.
•GOAL= increase domestic production in the protected industry and decrease consumption of imported goods.
Benefits + disadvantages of protection
•Benefits: owners and workers in the industry, sometimes the govt from revenue.
•Disadvantages: cost to the economy, consumers, those in the non-protected industries.
•ALL forms of protection result in a welfare loss for the economy
•Losses always outweigh the gains.
Tariff
•Tax on imports set by the government
•Most widely used protection measure
•In Australia, tariffs were used on imported motor vehicles, clothing/footwear.
•Designed to increase price of foreign G&S so that the competing (domestic) industry receives a price benefit
•Also an important source of revenue for the government.
- Raises the price of both domestic and imported goods
Tariff graph- before tariff
•At the Pw the foreign supply (Sf) is perfectly elastic - many qty of imports can be supplied at Pw= domestic production is at Q1
•Demand for domestic goods (quantity consumed) is at Q2
•Imports before tariff is Q1Q2
•Consumer surplus before tariff = A+B+C+D+E+F
•Producer surplus before tariff = G
- govt revenue= N/A, deadweight loss= N/A
Tariff graph- after tariff
•Tariff is imposed by the govt. so less imports will be sold in the domestic market, as they're sold at a higher price.
•Higher price means that supply increases to Q3 and demand decreases to Q4.
•Consumers surplus after tariff = A+B
•Producer surplus after tariff = G+C
•Govt. revenue after tariff = E (Q3Q4)
•Deadweight loss (lost consumer surplus) = D+F > may appear small but it will multiply throughout economy as every other industry would use computers/the import + will pay higher prices for them
Economic effects of a tariff
• ripples through economy as it lowers production + consumption in other sectors
•Decrease imports= decrease in exports
•Stimulates production in domestic industry and thus employment (more resources- labour- needed)
-Imports more expensive = domestic cheaper + more competitive
•Consumers pay a higher price / receive fewer goods (Pw + Tariff, Less imported goods = less options= decline in living standards)
•Raises money for the govt (tariff revenue p/unit (import) goes to the govt BUT, more successful a tariff is, the less imports will come = less revenue for the govt)
Tariff effect overview
If a tariff is placed on imports, it will cause the Pw line to increase, imports to decrease, producer surplus to increase, consumer surplus to decrease and total surplus to decrease
Subsidies
•Grants/payments made by govt to domestic producers.
•Enables a domestic producer to sell their product at a lower price to compete against imports
-Result in lowering the domestic producers costs so they can compete more favourably against imports
-Paid out of general taxation revenue
•Govt. subsidies worth billion of dollars were used to support the motor vehicle industry in Australia for many years
Subsidy graph- before subsidy
•World price for the good is at Pw
•Total demand for this price (Pw) is at Q2
•Total supply for this price (Pw) is at Q1
•Total imports is at Q1Q2
Subsidy graph- after subsidy
•If govt. pays subsidy to local firms then supply curve increases (ss) - shifts right
•As a subsidy has the same affect as a decrease in the cost for the firms, they can increase production and supply more at the same price
-Production expands to Q3
-Imports reduced to Q3Q2
•Hidden tax on consumers- Cost of subsidy (couldve been used for other more important industries that need the money) = DABW
•Increase in producer surplus = DACW
•Cost is greater than benefit, by area ABC= deadweight = a welfare loss for society.
Economic effects of a subsidy
•No direct adverse effect on consumers
-Pay same price and purchase the same amount however do bear an indirect burden in that the cost has to be paid from govt. tax revenue.
-Money can be spent on more important services such as health and education
•Inefficient producers are being rewarded at the expense of those that are efficient
Quota
• a limit on the quantity of a particular good that can be imported into a country (imposed by importing country)
• can be country specific, or global in scope.
•common in agricultural markets.
• have very similar effect to tariffs- result in higher prices for both domestic + imported goods. Consumer surplus decreases because of the increased price + reduced quantity. Producer surplus increases because domestic suppliers gain from the larger market share.
• biggest difference is that quotas do not raise government revenue like a tariff but it still creates a DWL.
Trade war
- a country places tariffs on another nation's imports to protect its domestic industries, where the other nation retaliates with its own tariffs
- 2018= Trump started trade war w/ China + other countries as that he believed were trading unfairly w/ the US (national security, to prevent other countries from 'dumping', increase US employment + reduce US trade deficit)
- everyone loses- consumers pay more while higher costs are imposed on other domestic industries= reduce production + employment + can push world into recession
Arguments for protection
- economists would argue that no protection is good protection , as they believe free trade allows for overall high growth + living standards
- however there are some circumstances + arguments when a case can be made for temporary, short term protection:
•Anti-dumping, infant industry, diversification, defence (national security), increased employment, cheap foreign labour + favourable balance of trade arguments
1. The Anti-Dumping argument
· WTO defines dumping as "the practise whenever company exports of products at a lower price then the prices normally charges on its own home market"
· foreign firms engaging in unfair competition to drive out domestic producers
· overseas firms may be large enough to sustain short run losses by selling at low prices and then increase its price in long run
· dumping may also occur when firms have large surfaces they can't sell in our own market or product is banned ( due to health issues/illegal) where they may off-load product in overseas market for whatever it can get
· Difficulty= proving dumping is actually occurring; foreign goods maybe lower price due to productive efficiencies
2. Infant Industry
· Newly established industries need protection in early years until matured + take advantage of economies of scale, overtime become internationally competitive + develop CA (used in support of AUS manufacturing industries)
· lack experience + size to compete effectively against established competitors abroad
· problem is protection tends to become long term rather than short term like originally designed
· I.I becomes accustomed to operating with little comp + incentive to innovate + increase efficiency is removed
· crucial that level of protection be frequently reviewed and reduced overtime (eventually it turns into old age pension)
3. Diversification
· instead of putting all resources into the products/ industries the countries comparatively advantages in (can change world demand + price), a country may benefit by diversifying its industrial base established using protection
· overtime industry may increase its efficiency and become competitive so in long run, level of protection decreases
· weakened by the fact that no countries only have CA in 1-2 industries as economies are dynamic + change as tech and world demand change
4. National Security (defence/strategic industries)
· Import barriers necessary to protect industries vital economy in case of wartime emergency, problem is identifying these industries
· every industry could be as important; outdated argument now but popular in global conflict era
· trade fosters international cooperation, while protection decreases it
5. Increased employment
· protection shifts consumer spending from foreign to domestic goods ∴ increased employment in protected industry
· however employment in protected industry may increase but employment in other d. industries will suffer (industries that use products of protected industry as inputs face increased production costs + consumers have less to spend on output of other industries)
· gain in employment in protected industry = loss of employment in other industries
6. Cheap foreign labour
· AUS industries need protection from lower wage countries (as their costs + wages are higher= less competitive)
· this could flip to say underdeveloped countries need protection from AUS due to superior capital equipment/tech
· level of wages= function of productivity, AUS workers have increased wage due to increased productivity
· countries w abundance of labour relative to other resources will have CA in labour intensive goods ∴ countries like AUS should reap benefits by importing these goods + producing those goods in which are more efficient
7. Favourable balance of trade
· A trade deficit could be reduced by restricting imports, assuming; imports= bad, exports= good, implying that a trade surplus is favourable + deficit is unfavourable= incorrect
· protectionist policies designed to decrease M will decrease X too, as it increases costs of other domestic industries which decrease their competitiveness + ∴ decrease exports
· other countries may also retaliate and impose restrictions on imports
· both M&X bring gains to economy ∴ countries should aim to increase both
Trade Liberalisation
•removal or reduction of restrictions or barriers on the free exchange of G&S between nations
•Having fewer boundaries to trade reduces the cost of goods sold in importing countries
Benefits of Trade Liberalisation
•Consumers gain through lower prices and greater variety + quality of goods
•Exporters gain through higher prices and market gain/access
•Increase in real incomes and living standards
•Increase in productivity through effective resource allocation
•Increase efficiency through greater competition
•Domestic producers gain through lower input prices
•Greater specialisation + economies of scale
•major catalyst for economic growth