Econ Labor Market and Economic Disparities
1/49
There's no tags or description
Looks like no tags are added yet.
Name | Mastery | Learn | Test | Matching | Spaced |
|---|
No study sessions yet.
50 Terms
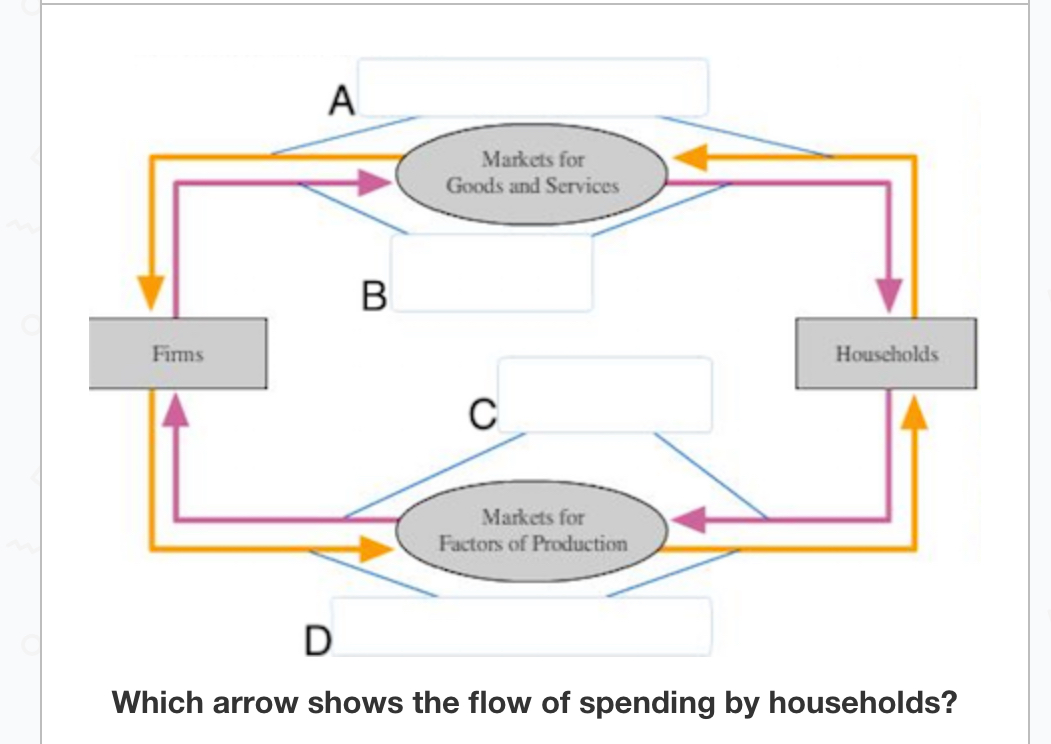
Which arrow shows the flow of spending by households?
A
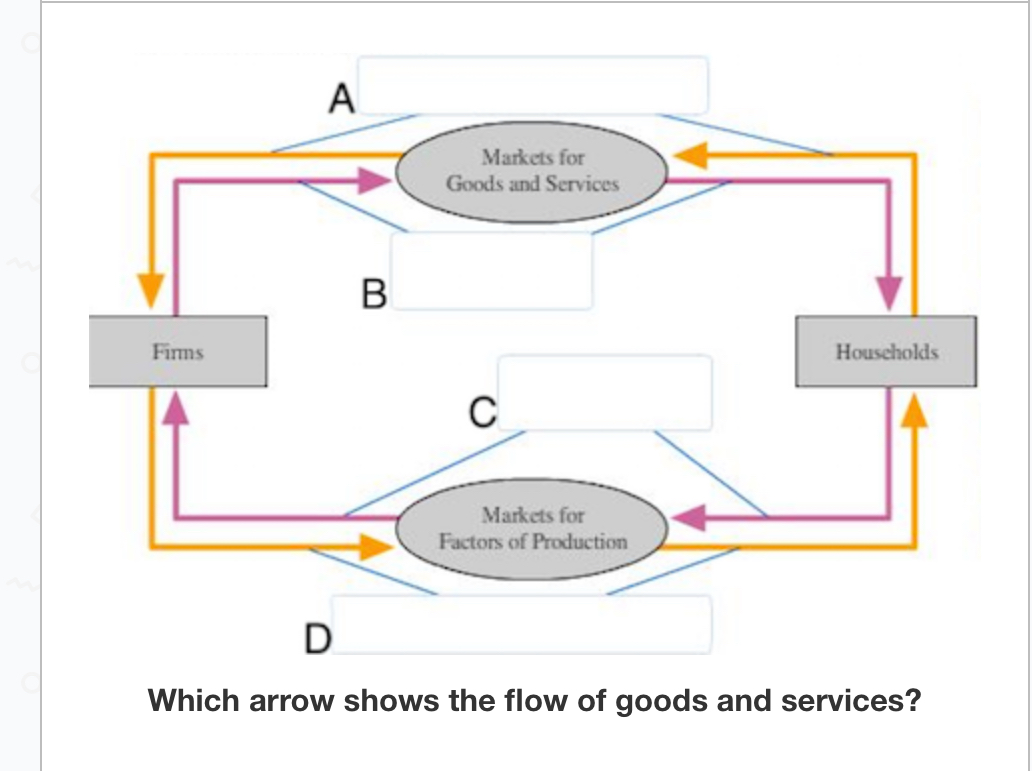
Which arrow shows the flow of goods and services?
B
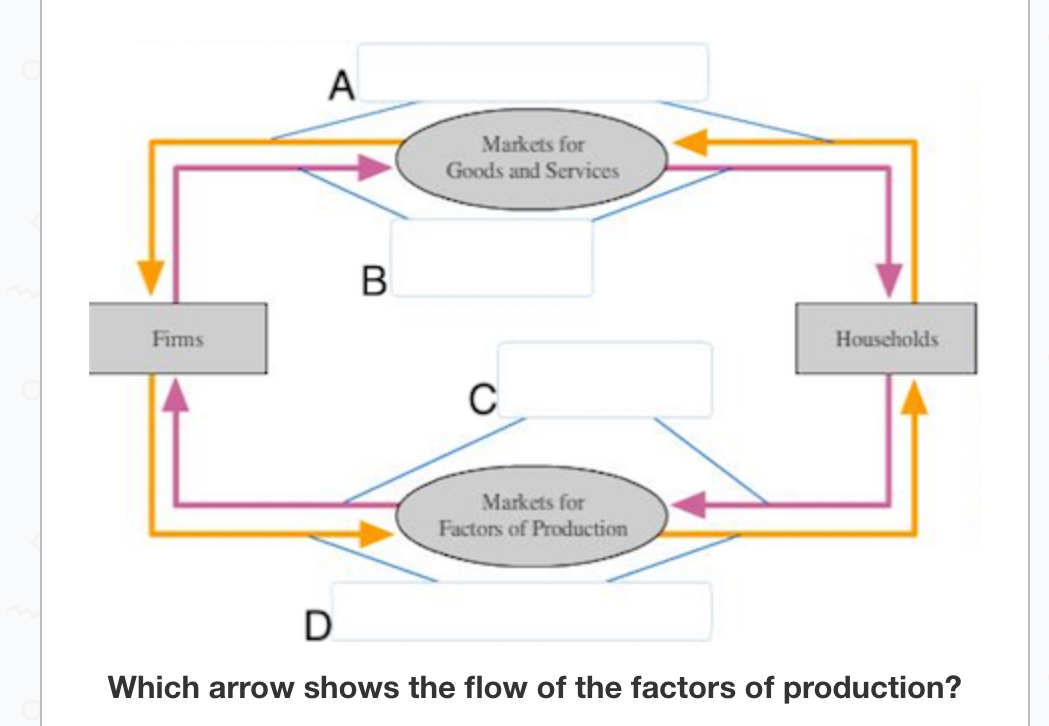
Which arrow shows the flow of the factors of production?
C
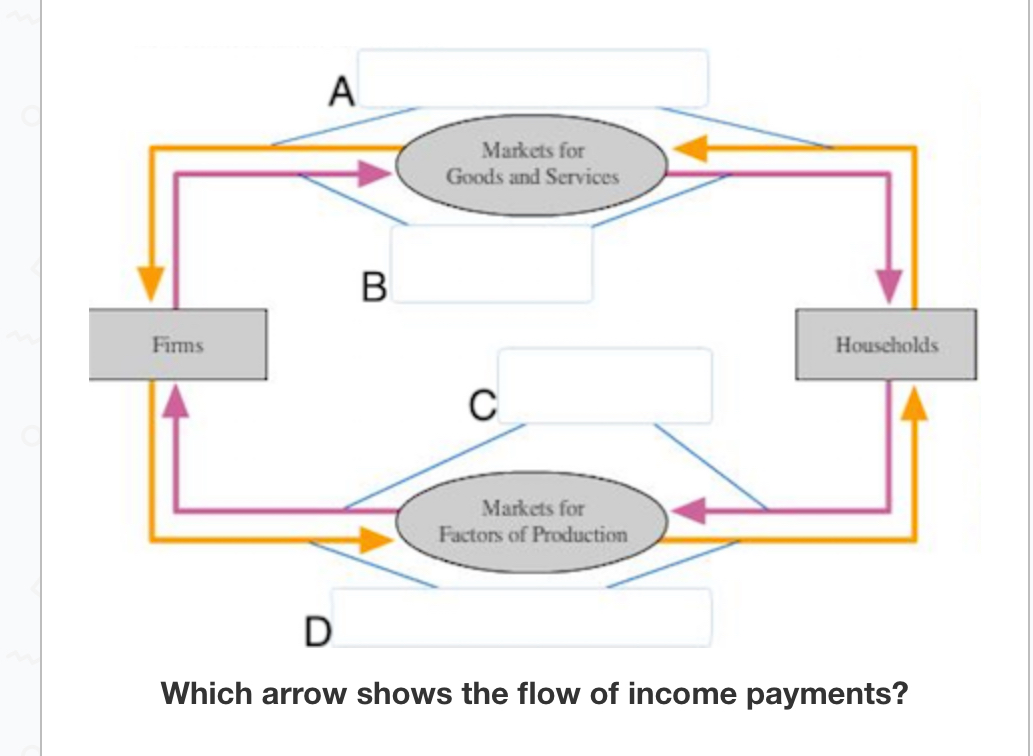
Which arrow shows the flow of income payments?
D
Factors of Production
The inputs used to produce goods and services, this includes land, labor, and capitol
In the circular flow model households become suppliers and firms become demanders
Derived Demand
Demand for a factor of production derived from the output being produced (usually the price of the product)
What does the demand for labor consist of?
Marginal Product of Labor (MPL), Diminishing Marginal Product (DMP), and Value of the Marginal Product of Labor (VMPL)
Marginal Product of Labor (MPL)
The increase in the amount of output from an additional unit of labor (slope of the wage vs output graph)
Diminishing Marginal Product (DMP)
The marginal product of an input declines as the quantity of the input increases
Value of the Marginal Product of Labor (VMPL)
The extra revenue à from gets from hiring an additional unity of a factor of production
VMPL = P * MPL
What causes the Labor Demand Curve to shift?
Output price, technological change, and the supply of other factors
** wage shifts along the curve, not the curve itself
Output Price
an increase in product P raises VMPL and increases D for labor
A decrease in product P lowers VMPL and decreases D for labor
Technological change
Raises MPL and VMPL: as tech improves, it raises the value of each worker even though the amount of workers decreases
Supply of other factors
The quantity available of one factor can affect MP of another and will likely affect the D for labor
Why is the supply curve upward sloping?
As wage increases, so does the cost of leisure (everything someone does other than work)
What causes the labor supply curve to shift?
changes in taste (leisure vs working)
Changes in alternative opportunities (other occupations)
Changes in population
Equilibrium in the Labor Market
the point where the wage = VMPL (supply and demand cross)
Firms buy as much labor as they find profitable at the equilibrium wage
Monopsony
a market with one buyer
That single buyer (which is a firm) hires fewer workers than a competitive labor market and pays a lower wage
Not efficient
Perfectly Competitive Labor Market
A market in which firms can hire all the labor they wish at the going market wage
Think of a big city with many hospitals and many nurses
Operates at efficiency where MR=MC
Demand for Other Factors (Land and Capital)
the VMPL or the demand curve still slopes downward
Influenced by rental rate
Rental Rate
Cost (explicit and implicit) of using a factor of production for a given period of time
How are factors of production used in the real world?
used together in a way that makes the productivity of each factor dependent on the other factors available to be used in the production process
A change in the supply of any one factor can change the earnings of all the other factors
As the supply of workers falls…
MPL and VMPL rises which means the remaining workers now have a higher value
In perfectly competitive labor market what is true?
Firms are wage takers
Workers are assumed to have identical skills
The demand curve for labor is downward sloping
All 3 are true
What factors determine wage?
Compensating differential
Human capital
Ability, effort, chance
Compensating Differential
A difference in wages that arises to offset the non monetary (not relating to or consisting of money) characteristics of different jobs
Jobs that are difficult, dull, or dangerous will pay higher wages
Human Capital
The accumulation of investments in people like education and on the job training
Workers with more human capital average higher earnings
Higher educated workers have higher MP
What are the reasons that above-equilibrium wage occurs?
minimum wage laws (a price floor)
Unions
Efficiency wages
All three of these reasons increase QS of labor and decrease QD, creating a SURPLUS of labor
Unions
a worker association that bargains with employers over wages and working conditions
Strike/collective bargaining: the organized withdrawal of labor from a firm by a union
Efficiency Wages
Above equilibrium wages paid by firms to increase worker productivity
Discrimination
very difficult to prove or verify
Makes no economic sense
Shifts the supply curve to the left
Poverty Rate
The percentage of the population whose family income falls below an absolute level (poverty line)
Poverty Line/Threshold
An absolute level of income set by the federal government for each family size below which a family is deemed to be in poverty
In-Kind Transfers
Transfers to the poor given in the form of goods and services rather than cash
Not taken into account for standard measurements
May change poverty rates
Examples include soup kitchens, churches, and shelters
Life Cycle
The regular pattern of income variation over a person’s life
Peaks around age 50
Borrow young and save later to make this curve smoother
Economic Mobility
The movement of people among income classes
Ways of Income Distribution
Utilitarianism
Liberalism
Libertarianism
Utilitarianism
The political philosophy according to which the government should choose policies to MAXIMIZE the total utility (usefulness) of everyone in society
Redistributed based on need
Progressive tax system (taking from the rich to give to the poor)
Utility
a measure of happiness or satisfaction
Based on diminishing marginal utility
Not all incomes need to be equal
Government must find balance
Liberalism
the political philosophy according to which the government should choose policies deemed to be just
Raise the welfare of the worst-off in society
Libertarianism
The political philosophy according to which the government should punish crimes and enforce voluntary agreements but redistribute income
The Lorenz Curve
shows the unequal distribution of income
The straight line represents communism where income is equal
The farther back the curve lies from the straight line, the more unequal the distribution is
Gini Coefficient
shows the distribution income inequality within a population
Ranges from 0 (perfect equality) to 1 (maximum inequality)
Budget Constraint
The limit on the consumption bundles that a consumer can afford
Indifference Curve
Shows the consumption bundles that give equal levels of satisfaction
Marginal Rate of Substitution
The rate at which a consumer is willing to trade for another good
Properties of Indifference curves
higher curves are preferred to lower ones
Downward sloping
Do not cross
Bowed inward
Straight lines if they are perfect substitutes
Right angles if they are perfect complements
Optimization
occurs when budget constraint matches the highest indifference curve
Occurs when MRS is the same as the relative price of the two goods
Marginal Rate of Substitution
abstract measure of consumer satisfaction
Equation: MUx/Px = MUy/Py
P = price
MU = marginal utility
Different for everyone
What is the goal of a consumer?
To maximize utility and have the highest possible indifference curve