Global Change Biology: Exam III
1/23
There's no tags or description
Looks like no tags are added yet.
Name | Mastery | Learn | Test | Matching | Spaced | Call with Kai |
|---|
No analytics yet
Send a link to your students to track their progress
24 Terms
Outline some of the climate adaptations that India and Bangladesh have adopted
Identify areas in the U.S. that have experienced increasing frequency of flooding
Dangers of Bangladesh Flooding (+2 Videos)
Bangladesh has a population of 163 million in only 1/70th of the land area of the US
The Bangladesh coastline is extremely vulnerable to rising sea levels
Flooding in Bangladesh
High population density in a monsoon-prone area
Delta region of the Ganges Brahmaputra river, most of the country is very low-lying
Water mismanagement & pollution cause GROUNDWATER to be the sole source of drinking water
By 2050, over 18 million people could be DISPLACED by rising sea levels and loss of land
Storms cause surging of sea water, inducing salinization of farmland & groundwater, flooding and damage to houses, etc
Adaptation Efforts in Bangladesh
Government has invested in an EARLY WARNING SYSTEM for storms and floods
Over 2,500 concrete storm shelters have been built
Sea walls have been built in some places to hold back tides and storm surges
LOW MUD WALL is the only thing that protects citizens of Bangladesh living off the Ganges Brahmaputra River
By end of century, entire area off the delta will be submerged
Groundwater has become nearly as salty as the ocean
Every year floods cover one-third of the land in the Bangladesh
Historical Trends in Flood Magnitude (1920-2008)
Flooding in local areas can be affected by multiple factors including land-use change, dams, and diversions of water for use
INCREASING TRENDS for floods in Midwest and Northeast of US
DECREASING trend in the Southwest of the US
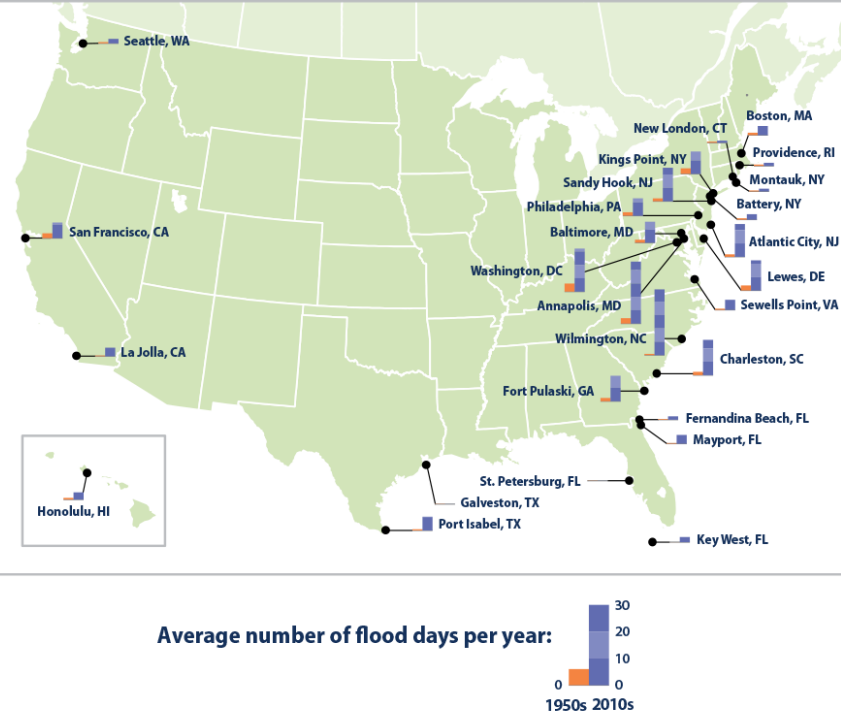
Flood Trends in the US: Coastal Flooding due to Storm Surges (GRAPH 1)
Where are the greatest increase in average number number of coastal flood days per year occurring?
By far the NORTHEAST of the US (off the ATLANTIC)
Wilmington, NC: 50 day increase (in # of flood days)
Annapolis, MD: 40 day increase (in # of flood days)
Washington DC: 30 day increase (in # of flood days)
San Fran is the most of the West Coast but still only 10 day increase
The Gulf Stream, which helps regulate sea levels along the East Coast, has been weakening.
This leads to higher sea levels along the Mid-Atlantic and Northeast.
Explain why New Orleans and certain areas of Houston were susceptible to a flooding disaster
Describe some potential solutions in response to flooding risk
Major Flooding in the U.S: Hurricane Katrina: August 28, 2005
New Orleans’ low elevation and vicinity to multiple rivers and the Gulf of Mexico, failing infrastructure, and loss of natural flood defenses made it highly susceptible to disaster.
When Hurricane Katrina struck, the levee system failed, leading to catastrophic flooding that submerged 80% of the city.
Hurricane Katrina was one of the deadliest and costliest hurricanes in U.S. history. Making landfall on August 29, 2005, as a Category 3 storm
*************************************************
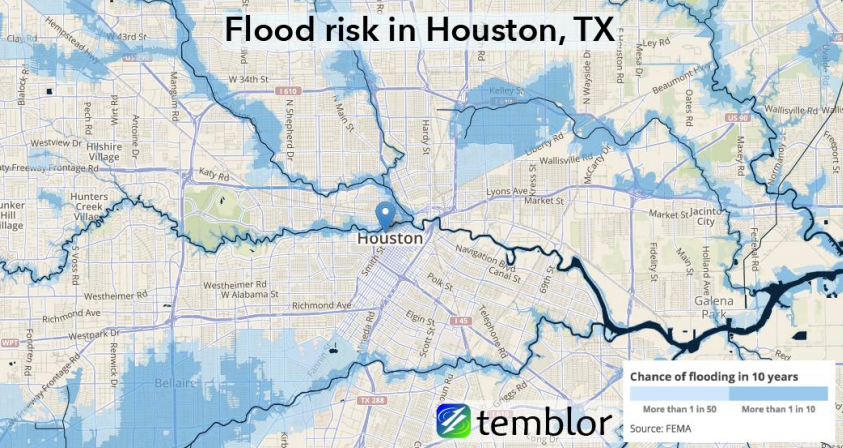
Houston in the Wake of Hurricane Harvey (2017) Increased Flood Risk
The risk of FLOODING in Houston, Texas, has significantly INCREASED in 10 years
Around RIVERS: “More than 1 in 10”
More INLAND: “More than 1 in 50”
Lack of Preparedness
Few people anticipated the scale of the disaster, leading to inadequate preparation.
Upstream Flooding of CINCO RANCH to Protect Downtown
To prevent catastrophic flooding in downtown Houston and cities downstream, authorities intentionally flooded upstream areas, including the Texas suburb of Cinco Ranch.
In effect, Cinco Ranch was sacrificed to protect central Houston.
The Problem During Hurricane Harvey
Harvey brought record-breaking rainfall, FILLING the TWO RESERVOIRS beyond their capacity.
If the reservoirs overflowed uncontrollably, the water would rush downstream into downtown Houston, causing catastrophic flooding in highly populated areas.
To prevent this, authorities had two choices:
Let the reservoirs overflow naturally—which would flood Houston uncontrollably.
Release water in a controlled way—which would flood upstream areas but spare downtown.
Why Flood Upstream Areas Like Cinco Ranch?
By holding water in this upstream area, authorities delayed its movement toward downtown, buying time and reducing flood levels in central Houston.
However, this meant that places like Cinco Ranch, which weren’t considered official flood zones, were INTENTIONALLY flooded—even though many residents didn’t know they were at risk.
The reservoirs acted as buffers, preventing water from immediately flowing into Houston.
The Army Corps of Engineers' Longstanding Knowledge
Since the 1940s, the U.S. Army Corps of Engineers (ACoE) recognized that in the event of a major storm, land behind Houston’s reservoirs would flood. They designated these areas as part of a "flood pool"—land meant to hold excess water when reservoirs exceeded capacity.
Aftermath and Support
Despite this proximity TO TWO RESERVOIRS, Cinco Ranch was not officially classified as a flood zone, meaning homeowners were not required to purchase flood insurance. Government agencies never formally warned residents about the potential flood risks.
Following the disaster, FEMA provided financial assistance, and churches played a significant role in aiding affected families.
Adaptation to Flooding in New Jersey
ELEVATED Homes on SUPPORTS (Pilings or Stilts)
A home is built on a dozen sturdy supports, raising the living area above potential floodwaters.
This method prevents damage from storm surges and coastal flooding by allowing water to flow underneath the structure rather than into the living space.
OPEN and UNREACHABLE Garages
Some homes have garages that remain open but UNREACHABLE during floods.
This prevents cars and valuable items from being stored in flood-prone areas and allows floodwaters to pass through without causing structural damage.
Breakaway Walls
Many homes built on stilts include breakaway walls on the lower level.
These walls are designed to collapse under the force of water, reducing structural damage and preventing the entire house from being lifted or destroyed by storm surges.
Flood Vents
Homes in flood zones often have flood vents installed in foundation walls or garages.
These vents allow water to flow through the structure instead of building up pressure that could damage walls or floors.
Storm-Resistant Windows and Doors
Impact-resistant windows and stormproof doors are commonly used to withstand hurricane-force winds and flying debris.
Some homes also have elevated entryways or watertight doors to prevent floodwaters from entering.

Comparison of Normal vs. Submerged Rice Paddies:
How do rice farmers deal with annual risk of flooding?
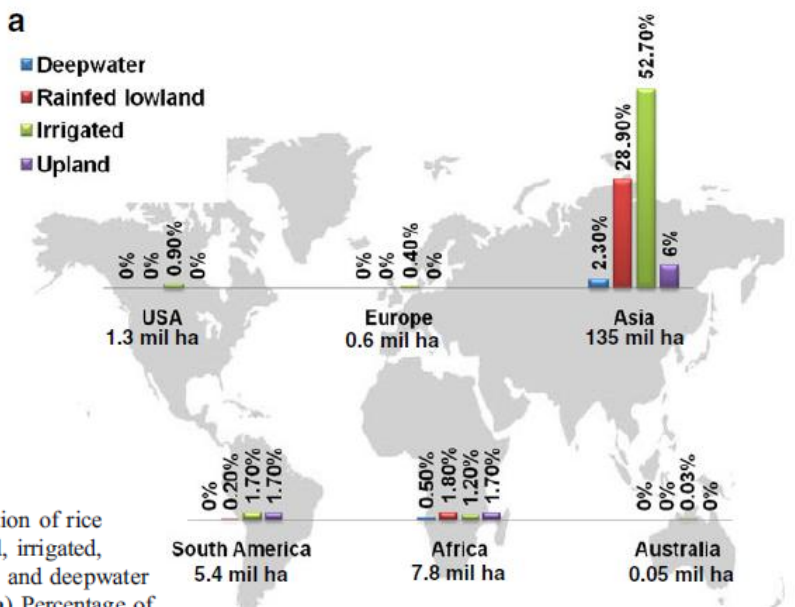
35% of the world’s rice-growing regions are susceptible to flash-flooding
The majority of every type of rice in the world is grown in ASIA (135 MILLION HECTARES ALONE)
Irrigated Rice (55% of global rice)
IR of China: Most/18% of global total
Rainfed Lowland Rice (25% of global rice)
RLR India: Most/9.30% of global total
Upland Rice (13% of global rice)
UI India: Most/3.40% of global total
Deepwater Rice (7% of global rice production)
DRPY Indonesia: Most/1.10% of global total
Comparison of Normal vs. Submerged Rice Paddies
Differences:
Rice Varieties:
Normal paddies: Standard irrigated or rainfed rice varieties.
Submerged paddies: Require submergence-tolerant rice (e.g., "scuba rice") or deepwater rice
Oxygen Availability:
Normal paddies: Roots receive sufficient oxygen for healthy growth.
Submerged paddies: Oxygen deprivation can cause stunted growth or crop failure.
Yield Stability:
Normal paddies: More stable and predictable yields.
Submerged paddies: Higher risk of yield loss due to unpredictable flood conditions.
How Deepwater Rice Adapts to Flooding:
Elongation Ability: Unlike regular rice, deepwater rice can extend its stem and leaves as water levels rise, keeping its foliage above water.
Flood Avoidance Strategy: Instead of staying submerged, the plant grows taller rapidly (up to 25 cm per day) to keep pace with rising water.
Strong, Hollow Stems: These provide buoyancy and allow oxygen transport even in flooded conditions.
Common in Specific Regions: Grown in parts of Bangladesh, India, Thailand, and Indonesia, where seasonal floods can reach 1–5 meters deep.
Difference Between Deepwater Rice and Submergence-Tolerant Rice:
Deepwater Rice: Can grow with rising water levels (up to 5 meters).
Submergence-Tolerant Rice (e.g., "scuba rice" with the SUB1 gene): Can survive temporary flooding (1–2 weeks) by going dormant, but not prolonged deep water.
How do rice farmers deal with annual risk of flooding? (GRAPH 2)
Farmers grow BOTH high-yielding semi-dwarf rice (6-8 t/ha) and flood-tolerant landraces (≈2 t/ha) to balance yield and flood resilience.
Farmers can plant a MIXTURE of high-yielding semi-dwarf plants with deepwater/flood-tolerant landraces
There is typically a TRADE-OFF of grain yield and flood tolerance
Yield Trade-off: Flood-RESISTANT varieties tend to have LOWER grain yield.
Modern semi-dwarf mega-varieties: 6-8 t/ha
Flood-tolerant landraces: ~2 t/ha
Up to a FOURTH reduction
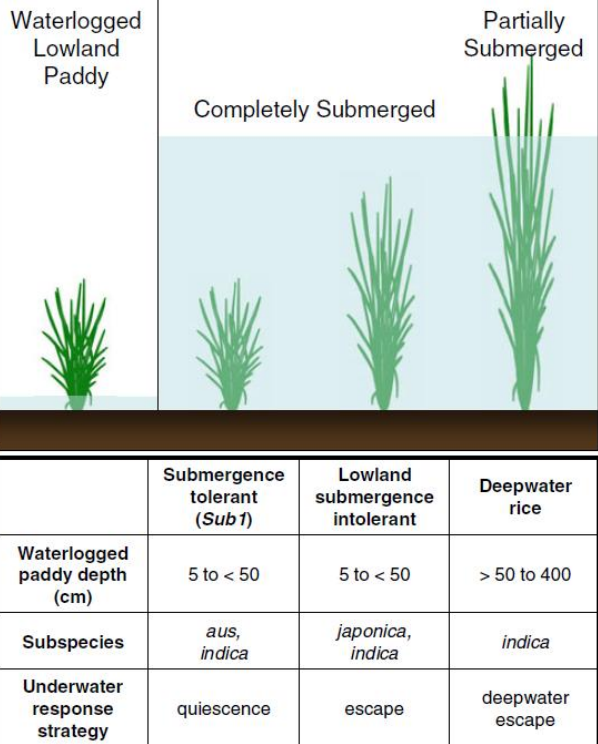
Submergence Tolerant (Sub1)
Survives waterlogging (5-50 cm) using QUIESCENCE strategy
Includes AUS AND INDICA (AI) Subspecies
Quiescence is a survival strategy where a plant slows or halts its growth during submergence to conserve energy and avoid excessive elongation.
This allows the plant to RESUME normal growth once floodwaters recede, reducing the risk of LODGING (falling over) or WASTING NRG in unfavorable conditions.
In rice, the Sub1 gene enables this response, making Submergence-Tolerant (Sub1) rice varieties more resilient to temporary flooding.
Lowland Submergence INTOLERANT
Survives waterlogging (5-50 cm) using ESCAPE strategy
The plant rapidly elongates its stem and leaves to keep above rising water levels.
Includes JAPONICA AND INDICA Subspecies
Deepwater Rice
Survives SEVERE waterlogging (50-400 cm) using DEEPWATER ESCAPE strat
The plant EXTENDS its INTERNODES significantly, allowing it to float and continue growth even in deep, prolonged flooding.
Mostly INDICA Subspecies

Compare and contrast the natural adaptations of rice plants to both types of flooding stress:
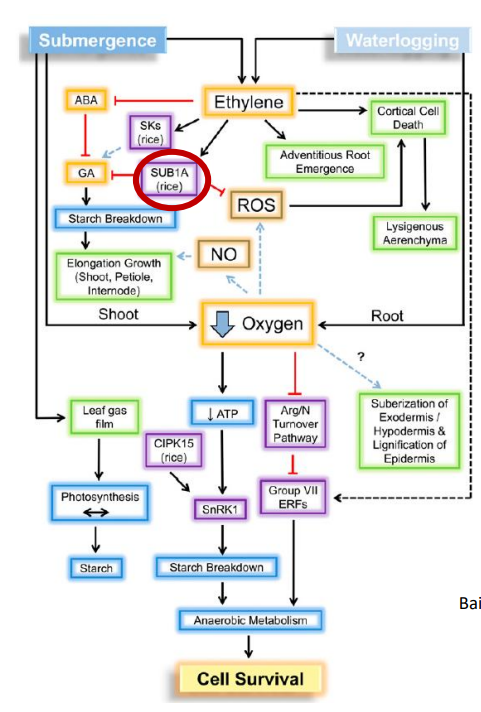
Explain the role of ethylene, ABA, and GA on submergence stress response
Why is flooding stressful to plants?
Waterlogging: Saturation of soil with H2O, leading to oxygen deprivation (hypoxia/anoxia) in plant roots, which disrupts nutrient uptake and metabolism.
Hypoxia/anoxia of roots
Salinity of floodwater
Decrease in soil pH, increasing metal toxicity
Submergence: plant is fully or partially underwater, causing both roots and shoots to experience oxygen deprivation while also limiting light and CO₂ availability for photosynthesis.
Hypoxia/anoxia of roots AND shoots
Salinity of floodwater
Decrease in soil pH, increasing metal toxicity
SAME BUT WITH ADDED Decreased light and CO2 availability
Examples of Survival Traits Displayed in Flooded Plants
Leaf Gas Films
Thin layer/film of GAS around leaves, which helps maintain oxygen levels for photosynthesis despite submergence.
Hyponasty
UPWARD BENDING OF LEAVES
Elongation: Shoot, Petiole, Internode
Shoot, petiole, and internode ELONGATION
Root aeration
SPECIALIZED air spaces in their ROOTS, allowing them to take in oxygen from above the water's surface, which is vital for respiration.
Radial oxygen loss barrier (suberin around hypodermal cells and lignification of epidermis)
Helps conserve oxygen within the roots during waterlogging.
How do organisms deal with abiotic stress?
Stress Tolerance
Organisms WITHSTAND unfavorable conditions by adapting internally to reduce damage
E.g. Producing heat shock proteins to stabilize damaged proteins, or increase transpiration to cool down.
Stress Avoidance
Organisms ESCAPE unfavorable conditions by either moving away (e.g., migration) or altering behavior or physiology (e.g., dormancy).
E.g. Some organisms avoid heat stress by becoming nocturnal or moving to cooler areas during the hottest parts of the day.
Escape v. Quiescence: Flooding Stress in Rice Plants
Escape from submergence stress — elongation of shoots to reach air above the water
Quiescence — Survive the submergence stress by reducing cellular activities (i.e., hibernation) until the water recedes
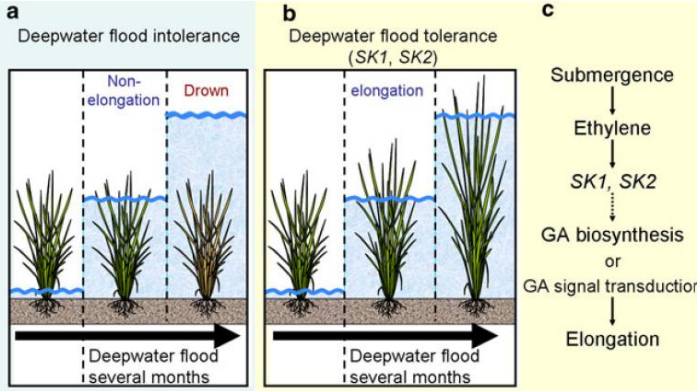
GRAPH 1: Model of DEEPWATER FLOOD tolerance and plant hormones in rice.
ELONGATION RESPONSE
A: The strategy of non-deepwater rice in a deepwater flood.
Non-deepwater rice does NOT elongate the internodes, so it DIES from oxygen starvation.
B: The strategy of deepwater rice in a deepwater flood.
Deepwater rice has adapted to deepwater flood by elongating its leaves and internodes to rise above the water level.
C: The scheme of deepwater tolerance in deepwater rice. (B CONTINUED)
Submergence Occurs → The plant becomes fully or partially underwater.
Ethylene Accumulates → Water slows ethylene diffusion, causing it to build up in plant tissues.
Ethylene Induces SNORKEL QTLs SK1 and SK2
SK1 and SK2 ACTIVATE Gibberellin GA Biosynthesis
Abscisic Acid (ABA) Declines → Normally, ABA inhibits growth, but its reduction removes this suppression, allowing GA to act more strongly.
Gibberellin (GA) Stimulates Elongation → GA promotes internode and leaf elongation, enabling the plant to RISE above the water surface and survive
SUB1C is Activated by GA → SUB1C promotes carbohydrate (CHO) consumption to fuel the energy-demanding elongation process.
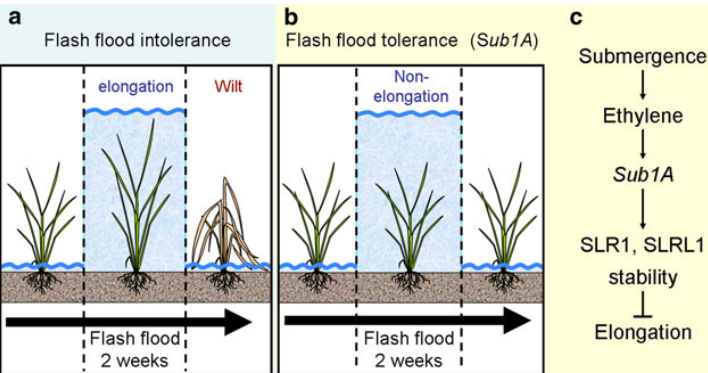
GRAPH 2: Model of FLASH FLOOD Tolerance and Plant Hormones in Rice
QUIESCENCE RESPONSE
A: The strategy of flash flood-INTOLERANT rice
A normal rice plant elongates its leaves during a flash flood to avoid drowning; as a result, it wilts and dies after the water recedes
B: The strategy of flash-flood TOLERANT rice
Flash flood tolerant rice plants STOP growing so as not to consume energy while submerged
The plant restarts its growth using accumulated energy after the water recedes
C: The scheme of flash-flood TOLERANCE (B CONTINUED)
Submergence Occurs → The plant becomes fully or partially underwater.
Ethylene Accumulates → Water slows ethylene diffusion, causing it to build up in plant tissues.
Sub1A is Activated → Flash flood-tolerant rice carries the Sub1A gene, which regulates the plant’s response to submergence.
Sub1A Promotes the Accumulation of SLR1 and SLRL1 → These proteins act as negative regulators of GA signaling, preventing excessive growth.
Abscisic Acid (ABA) Levels Increase → ABA reinforces the SUPPRESSION of gibberellin (GA), further inhibiting leaf elongation and conserving energy.
Growth is Temporarily Halted → The plant enters a quiescent state, minimizing energy use while submerged.
Water Recedes → Once floodwaters drain, the plant resumes normal growth, using stored energy to recover quickly.
The best strategy depends on the flooding duration and severity.
Explain the role of ethylene, ABA, and GA on submergence stress response
Key Role of Ethylene
Ethylene accumulates when the plant is DROWNING because water prevents it from escaping, leading to an internal buildup that triggers the plant’s flood response.
Triggers SK1 & SK2 in deepwater rice, promoting gibberellin (GA) signaling and internode elongation.
Activates Sub1A in flash flood-tolerant rice, leading to SLR1 & SLRL1 accumulation, which inhibits GA signaling and prevents elongation.
Regulates energy conservation strategies, allowing plants to either elongate (escape strategy) or enter quiescence (survival strategy) based on flooding conditions.
Key Role of Abscisic Acid (ABA)
ABA enhances stress tolerance by reinforcing the suppression of GA (Gibberellin, which promotes internode & leaf elongation), ensuring the plant does not waste energy on elongation.
Higher ABA levels in flash flood-tolerant rice help maintain dormancy, allowing the plant to survive prolonged submergence.
This strategy CONTRASTS with deepwater rice, where ABA levels decline, allowing GA-driven elongation to help escape deep floods.
Key Role of Gibberellin (GA)
Regulates growth responses to flooding, determining whether a plant elongates or remains dormant.
Promotes elongation in deepwater rice by stimulating internode and leaf growth, helping the plant rise above water.
Is INHIBITED in flash flood-tolerant rice, where Sub1A suppresses GA signaling to prevent excessive growth and conserve energy.
Interacts with abscisic acid (ABA)—low ABA levels in deepwater rice allow GA-driven elongation, while high ABA levels in flash flood-tolerant rice reinforce GA suppression.
Mediates energy allocation, ensuring plants either grow rapidly (escape) or pause growth (quiescence) based on flood conditions.
Describe the role of SNORKEL genes in deepwater rice
Describe the QTL SUB1 locus and its physiological mechanism of submergence tolerance
Describe the process through which SUB1 was identified, isolated, and then put into modern rice varieties
Articulate the success of the SUB1 project and identify several reasons for why the new SUB1 floodtolerant rice varieties have been widely adopted by farmers
Describe the role of SNORKEL genes (SK1 and SK2) in deepwater rice
Ethylene triggers the activation of SNORKEL QTLs (Quantitative Trait Loci), (SK1 and SK2), in deepwater rice when submerged.
SK1 and SK2 genes stimulate gibberellin (GA)-mediated elongation, promoting rapid growth of the internodes to help the plant rise above the water.
This growth response enables the plant to increase its height by up to 25 cm per day, allowing it to escape submergence and survive.
Escape strategy: By elongating its internodes, the plant can reach the water surface for oxygen and light, supporting survival during prolonged flooding.
Describe the QTL SUB1 locus and its physiological mechanism of submergence tolerance
The SUB1 locus contains the SUB1A gene, which plays a critical role in submergence tolerance in rice, particularly under flash floods or short-term flooding.
SUB1A functions by suppressing ethylene-induced gibberellic acid (GA)-mediated shoot elongation during submergence, preventing the plant from wasting energy on unnecessary growth while submerged.
When rice is submerged, ethylene levels rise, typically triggering GA signaling that promotes shoot elongation.
However, the SUB1A gene INHIBITS this process by downregulating GA signaling, causing the plant to enter a quiescent state and conserving energy.
This suppression of elongation allows the plant to survive prolonged submergence by limiting growth and reducing metabolic demands until the floodwaters recede, after which the plant can resume growth.
The SUB1A gene essentially induces quiescence in rice under submergence conditions by suppressing shoot elongation. This allows the plant to conserve energy and survive until the floodwaters recede, after which it can resume growth.
In short, waterlogging primarily affects the root system, while submergence affects both roots and shoots.
Articulate the success of the SUB1 project and identify several reasons for why the new SUB1 floodtolerant rice varieties have been widely adopted by farmers
SUBMERGENCE TOLERANCE GENE SUB1 was discovered in the rice landrace FR13A from India/Sri-Lanka
FR13A is very tolerant to short-term (7-14 day) submergence stress
This stress tolerance has been localized to a SUB1 locus on Chr9 coding for ethyleneresponse factor (ERF) transcription factors, which regulates plant responses to water
The SUB1 locus on Chromosome 9 was identified as a critical region controlling submergence tolerance.
This locus codes for ethylene response factor (ERF) transcription factors, which regulate plant responses to flooding.
The SUB1A gene within the SUB1 locus SUPPRESSES ethylene-induced gibberellic acid (GA)-mediated shoot elongation, inducing a quiescent state under submergence.
This prevents unnecessary growth during flooding and conserves energy, allowing the rice to survive floods lasting up to 14 days.
The introduction of SUB1A into high-yielding rice varieties has allowed them to maintain their productivity even in flood-prone areas.
These flood-tolerant varieties can endure floods without losing the ability to recover after water levels recede, improving overall yield.
The new SUB1 varieties were widely adopted by farmers because they offer significant economic benefits, including reduced crop loss from floods.
Farmers in flood-prone areas can now grow rice with greater confidence, even in regions with unpredictable rainfall or flood risks.
After the floodwaters recede, SUB1 rice varieties can quickly resume growth, leading to higher yields compared to traditional varieties that are more susceptible to flood damage.
This contributes to greater food security and more stable income for farmers.
The Sub1 gene was added to modern rice varieties by selecting plants with the Sub1A gene from flood-tolerant rice, then breeding them with high-yielding rice to pass on the submergence tolerance.
Submergence-tolerance and intolerance in rice have been linked to the particular alleles of SUB1
Ethylene response factor (ERF) gene composition (haplotype) at the SUB1 locus of submergence tolerant and intolerant rice
Alleles are defined based on the nucleotide sequence encoding the ERF and not flanking or intervening sequences which have additional polymorphisms
Japonica haplotypes LACK Sub1A (the Japs are not submergence-tolerant)
Indica haplotypes are more VARIABLE
Submergence Tolerant (Sub1) I AM INDIAN
Survives waterlogging (5-50 cm) using QUIESCENCE strategy
Includes Aus and Indica Subspecies
Quiescence is a survival strategy where a plant slows or halts its growth during submergence to conserve energy and avoid excessive elongation. This allows the plant to resume normal growth once floodwaters recede, reducing the risk of lodging (falling over) or wasting energy in unfavorable conditions.
In rice, the Sub1 gene enables this response, making Submergence-Tolerant (Sub1) rice varieties more resilient to temporary flooding.
Lowland Submergence INTOLERANT
Survives waterlogging (5-50 cm) using ESCAPE strategy
The plant rapidly elongates its stem and leaves to keep above rising water levels.
Includes Japonica and Indica Subspecies
Deepwater Rice
Survives SEVERE waterlogging (50-400 cm) using DEEPWATER ESCAPE strat
The plant extends its internodes significantly, allowing it to float and continue growth even in deep, prolonged flooding.
Mostly Indica Subspecies
Why is elongation only beneficial for deepwater rice?
Once they grow tall they never grow small again, too much energy and may fall over after flash flood passes, as such, we crossbreed plants in areas prone to FLASH floods with SUB1 genes for quiescence rather than elongation
Sixty-Year Timeline of Field, Laboratory, and Regulatory Accomplishments that Led to Release of Sub1 mega-varieties with submergence tolerance in Asia
Sixty-Year Timeline of Field, Laboratory, and Regulatory Accomplishments that Led to Release of Sub1 mega-varieties with submergence tolerance in Asia
1950s: Farmer’s submergence tolerant landraces collected, including FR13A
1975: IRRI seed brank screened for tolerant varieties
1980: Breeding for tolerance begins
1993: First high-yielding submergence tolerant semi-dwarf
1995: SUB1 mapped to Chr. 9; 70% variation in tolerance
Initiation of fine-mapping & marker development
2002: Swarna crossed with IR49840-7 (Sub1)
2006: Swarna-Sub1 developed by marker assisted backcrossing
2008: SUB1A shown to inhibit response to gibberillins
2009: Swarna-Sub1 certified by Indian Government
2010: Sub1 mega varieties released in India, Philippines, Indonesia, Bangladesh
Field trials of widely grown mega-varieties with SUB1 locus bred in
Field plot test of submergence tolerance of Sub1 and non-Sub1 varieties
The SUB1 locus from FR13A was introduced into the native varieties (IR64 and Samba) by crossbreeding
14-day-old seedlings were transplanted into a field with high leaves, grown for 14 days, and then completely submerged with about 1.25 m of water for 17 days.
The field was drained and the plants were allowed to recover under non-stress conditions
The aerial photograph revealed that while the IR64 and Samba native species were decimated by the flooding, that the Sub1 crossbred species were very lush and able to flourish despite the bad conditions
Strengths of the SUB1 Project
Not transgenic (non-GMO); marker-assisted backcross breeding method was used to NATURALLY INCORPORATE this locus into existing megavarieties
No noticeable decrease in the grain yield and quality of megavarieties due to insertion of SUB1A
Successful field trials and incorporation of farmer input resulted in widespread adoption of these new tolerant varieties by many governments and local farmers
Outline the role that IRRI plays in rice crop adaptation to climate change and public health
Outline the role that IRRI plays in rice crop adaptation to climate change and public health
1. Developing New Rice Varieties
44 new rice varieties have been developed and introduced across Asia and Africa, aimed at improving productivity, disease resistance, and tolerance to climate stressors like drought, flooding, and heat.
2. Reducing Poverty
By developing high-yielding, resilient rice varieties, IRRI helps farmers improve their income, thereby contributing to the reduction of poverty in rural communities, where rice farming is a key livelihood.
3. Tackling Climate Change
IRRI focuses on developing rice varieties that are more resilient to the adverse effects of climate change, such as flooding, drought, and temperature extremes, ensuring that farmers can still grow rice in changing climates.
4. Engaging Women
IRRI actively works to empower women farmers by providing training, resources, and support in adapting to new rice farming techniques, helping to boost their role in agricultural productivity and improve their social and economic status.
5. Protecting the Environment
Through sustainable farming practices and environmentally friendly rice varieties, IRRI aims to reduce the environmental impact of rice production, particularly by improving water efficiency and reducing the need for chemical inputs.
6. Increasing Food Security
IRRI works to increase food security by ensuring that rice, a staple crop for over 3 billion people, can be grown sustainably and withstand environmental stresses, ensuring reliable food sources even under challenging conditions.
7. Making Rice Healthier
IRRI is working on projects to make rice more nutritious and healthier, addressing malnutrition and deficiencies in essential vitamins and minerals among populations that rely heavily on rice as their primary food source.
Golden Rice – Elaboration
Golden Rice is a genetically modified (GM) rice developed by IRRI to address vitamin A deficiency (VAD), which is a major public health issue, especially in developing countries. The key features of Golden Rice include:
Enhanced Nutritional Value:
Golden Rice is rich in provitamin A (beta-carotene), which the body can convert into vitamin A. This is crucial for preventing blindness and immune system deficiencies that arise from a lack of vitamin A.
Solving Vitamin A Deficiency:
Vitamin A deficiency is a widespread issue in many countries where rice is a staple, leading to malnutrition, especially in children and pregnant women. Golden Rice aims to provide a sustainable solution by fortifying rice with this vital nutrient.
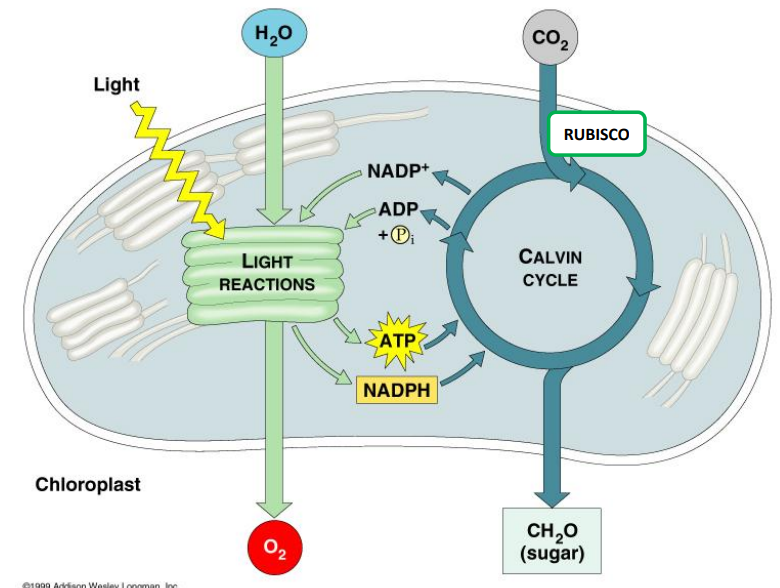
Outline the basic overall process of photosynthesis in higher plants
A Brief Review/Overview of Photosynthesis
6CO2+12H2O+hv —> C6H12O6 + 6H2O + 6O2
Water+Light helps convert Carbon Dioxide into chemical energy in form of GLUCOSE
Chloroplasts trap light energy
Water enters leaf
CO2 enters leaf through stomata
Sugar LEAVES leaf
GRAPH 1: Photosynthesis in a Nutshell
1. Light-Dependent Reactions (Left Side)
Occur in the thylakoid membranes of chloroplast
Light energy is absorbed by chlorophyll and used to split H₂O (water), producing O₂ (oxygen) as a byproduct.
This process generates ATP and NADPH, which carry energy to the next stage.
2. Calvin Cycle (Right Side)
Takes place in the stroma (fluid-filled space of chloroplast)
Uses CO₂ (carbon dioxide) and energy from ATP and NADPH to produce CH₂O (sugar).
Rubisco, an enzyme, helps fix carbon by incorporating CO₂ into organic molecules.
Key Takeaways
Light reactions provide the energy (ATP & NADPH) for the Calvin Cycle.
Water is split, releasing oxygen.
CO₂ is converted into sugar, providing energy for the plant.
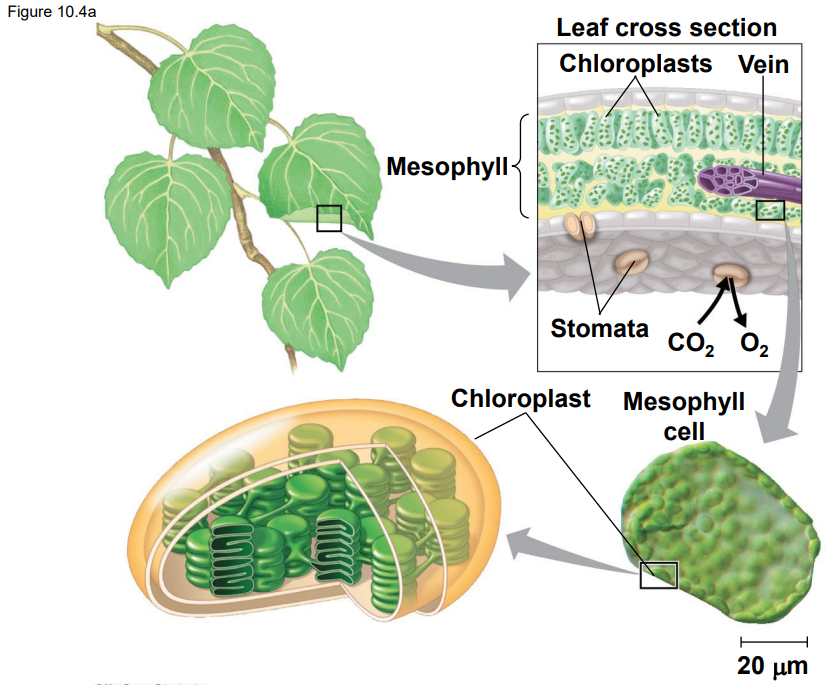
Structure of a leaf and how photosynthesis occurs within it (GRAPH 2)
The mesophyll (middle layer of the leaf) contains chloroplasts, which are the site of photosynthesis.
Leaf Cross-Section
Chloroplasts are concentrated in mesophyll cells.
Veins transport water and nutrients.
Stomata (tiny openings) allow gas exchange: CO₂ enters, and O₂ exits.
Chloroplast Structure
Contains thylakoids (stacked membranes where light reactions occur).
Surrounding fluid (stroma) is where the Calvin Cycle takes place.
Overall Process:
CO₂ enters through the stomata.
Chloroplasts use CO₂, water, and light energy to produce oxygen and sugars.
O₂ exits as a byproduct through the stomata.
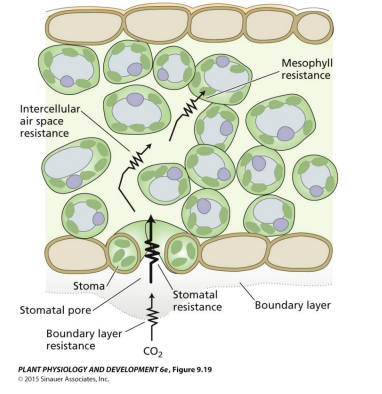
Describe the pathway of CO2 diffusion into leaves to the site of photosynthesis and the major resistances to diffusion
CO2 Diffusion Pathway within Leaves (GRAPH 1)
CO₂ first crosses the boundary layer, a thin layer of still air on the leaf surface which slows down gas exchange and is the first barrier to CO2 entry
CO₂ enters through the stomatal pores, tiny openings controlled by guard cells which affects how easily CO₂ can diffuse inside.
Once inside, CO₂ moves through the intercellular air spaces between mesophyll cells which is influenced by the diffusion rate and resistance within the air spaces.
Finally, CO₂ diffuses through the cell walls and membranes of mesophyll cells to reach the chloroplasts, where it is used in the Calvin Cycle for photosynthesis.
Key Takeaways:
Each step presents a form of resistance that affects the efficiency of CO₂ diffusion.
The largest resistances usually come from the stomata (if partially closed) and the boundary layer.
Efficient CO₂ diffusion is crucial for maximizing photosynthesis rates in plants.
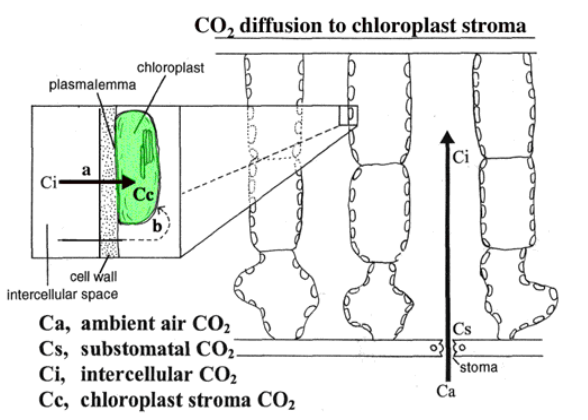
CO2 Diffusion Pathway within Leaves (GRAPH 2)
Key Takeaways:
CO₂ movement follows a stepwise diffusion gradient from the outside air to the chloroplasts.
Stomatal and mesophyll conductance determine how much CO₂ reaches the Calvin Cycle.
Any increase in resistance (r) or decrease in conductance (g) lowers the available CO₂ for photosynthesis.
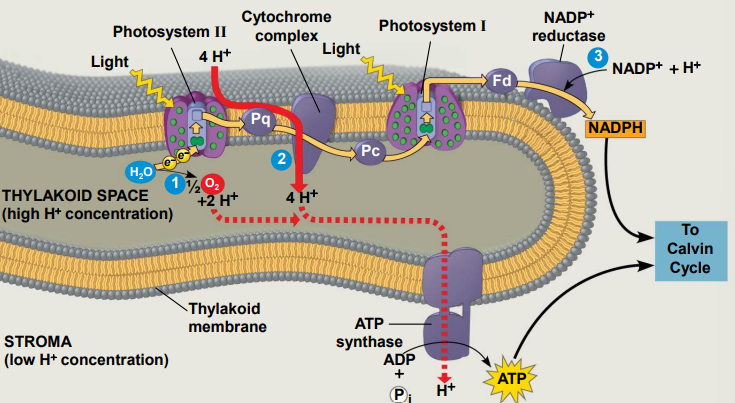
Where does photosynthesis occur in the cell in a nutshell?
Photosynthesis in a Nutshell
Occurs in and around the thylakoid membrane within the chloroplast
1. Light Reactions (In the Thylakoid Membrane)
Driven by light energy, these reactions CREATE ATP and NADPH, which FUEL the Calvin cycle.
Photosystem II (PSII) absorbs light, exciting electrons.
These electrons are TRANSFERRED to the cytochrome complex, while water is split, releasing O₂ and protons (H⁺) into the thylakoid space.
The cytochrome complex passes electrons down an electron transport chain (ETC), using their energy to pump more H⁺ into the thylakoid space, creating a proton gradient (high H⁺ inside, low outside).
Photosystem I (PSI) re-excites the electrons using light and passes them to NADP⁺ reductase, which reduces NADP⁺ to NADPH in the stroma.
The H⁺ gradient drives ATP synthase, which allows H⁺ to flow back into the stroma, generating ATP from ADP + Pᵢ.
2. Calvin Cycle (In the Stroma)
Uses ATP and NADPH from the light reactions to fix carbon into sugars.
Carbon Fixation – Rubisco enzyme attaches CO₂ to RuBP, forming 3-PGA.
Reduction – ATP and NADPH convert 3-PGA into G3P, a sugar precursor.
Regeneration – Some G3P leaves to form glucose, while the rest is used to regenerate RuBP using ATP.
End Result: ATP and NADPH fuel carbon fixation, while the proton gradient across the thylakoid membrane drives ATP synthesis.
Calvin-Benson-Bassham Cycle broken down into 3 major phases, briefly explain them
Rubisco’s active site can catalyze both CO2 and O2, how is this a problem?
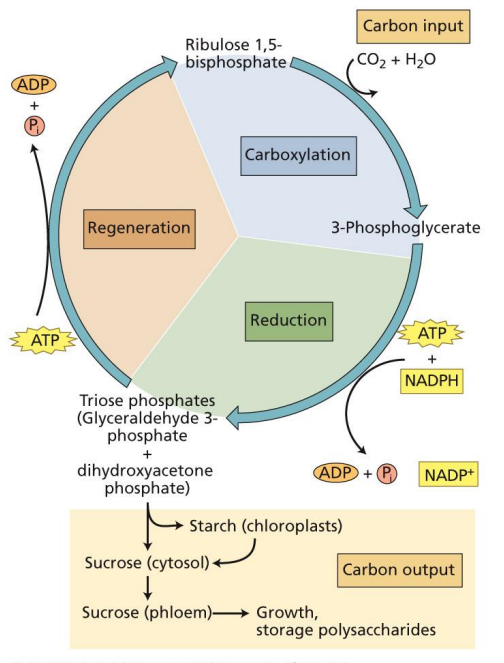
Calvin Cycle has 3 Major Steps (GRAPH 1)
Carboxylation (Carbon Fixation) - Most Important Step
CO₂ enters the cycle and is directly involved in this step.
The enzyme Rubisco catalyzes the reaction, attaching CO₂ to ribulose 1,5-bisphosphate (RuBP).
This produces 3-phosphoglycerate (3-PGA), which moves to the next phase.
2. Reduction
NADPH + ATP → NADP+ + ADP + Pi
ATP and NADPH (from the light reactions) are used to convert 3-PGA into triose phosphates (G3P and DHAP).
3-PGA—> G3P + DHAP
NADPH is OXIDIZED to NADP⁺, and ATP is hydrolyzed to ADP + Pᵢ in the process.
G3P is the main product, which can be used for energy storage and biosynthesis.
3. Regeneration of RuBP
Some G3P molecules go on to regenerate RuBP, ensuring the cycle can continue.
ATP is consumed in this phase to facilitate RuBP regeneration.
INPUTS
CO2, ATP, NADPH
Outputs & Carbon Allocation
Triose phosphates (G3P and DHAP) are key products.
These molecules can be further converted into starch (chloroplasts), sucrose (cytosol), or sucrose (phloem) for growth and storage.
Key Takeaways
The Calvin Cycle fixes CO₂, uses ATP and NADPH, and produces sugars.
It is indirectly dependent on light since it needs ATP and NADPH from light reactions.
The fixed carbon is crucial for plant metabolism, supporting growth and energy storage.
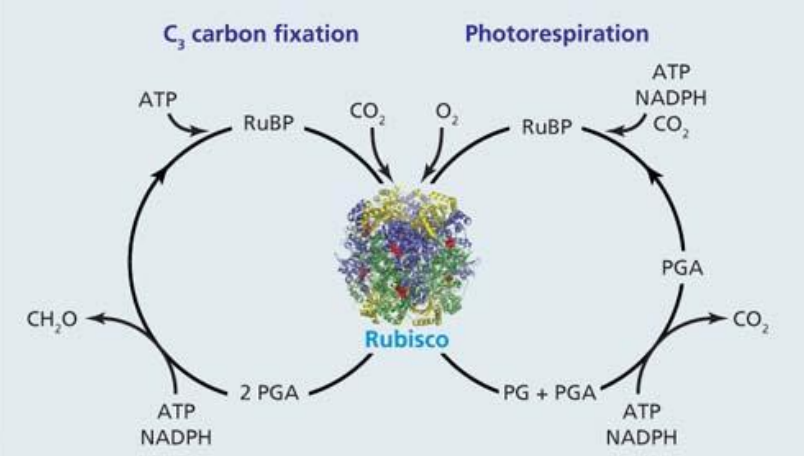
A Problem is the fact that RubisCO catalyzes reactions involving either CO2 or O2 which are 2 competing processes (GRAPH 2)
Active site of RubisCO can accept/catalyze reactions involving either CO2 or O2 which are two DISTINCT competing processes
1. C₃ Carbon Fixation (Efficient, Productive Pathway)
CO₂ enters the Calvin cycle and reacts with RuBP (Ribulose-1,5-bisphosphate) in the chloroplast.
This reaction, catalyzed by Rubisco, produces 2 molecules of 3-PGA (3-phosphoglycerate).
ATP and NADPH (from the light reactions) reduce 3-PGA into sugars, which contribute to plant biomass and metabolism.
Importantly, the RuBP pool remains stable because RuBP is continuously regenerated.
All sugars and carbon in plants originate from this CO₂ fixation.
2. Photorespiration (Wasteful, Unproductive Pathway)
SUCKS TO BE PG
Instead of binding CO₂, Rubisco mistakenly binds O₂, leading to the production of PGA and PG (phosphoglycolate) instead of two PGA molecules.
PG CANNOT directly enter the Calvin cycle and must be salvaged through a costly process that requires ATP and NADPH while releasing CO₂.
Unlike carbon fixation, photorespiration leads to a net loss of carbon and energy, making it inefficient for growth.
RuBP is lost, and ATP + NADPH must be used to RESTORE it, further DRAINING plant resources.
Why This Matters (no need to know this?)
To counteract this, plants have evolved mechanisms like C₄ and CAM photosynthesis, which reduce photorespiration and improve carbon fixation efficiency.
Explain what photorespiration is and why it is undesirable for plants
Describe the basic features of the FvCB model of C3 leaf photosynthesis
Photorespiration is an energy-intensive and complicated process involving multiple organelles
What is Photorespiration?
A process where Rubisco mistakenly binds O₂ instead of CO₂, leading to the BREAKDOWN of RuBP.
Instead of producing useful sugars, it releases CO₂ and consumes ATP and NADPH to regenerate the Rubisco
Involves the chloroplast, peroxisome, and mitochondrion, making it complex and wasteful.
CPM
Why is it Undesirable for Plants?
Wastes energy – Uses ATP and NADPH without making sugars.
Reduces carbon fixation – Less CO₂ is converted into organic molecules.
Releases CO₂ – OPPOSITE of what plants want in photosynthesis.
Competes with the Calvin Cycle – Takes away RuBP that could be used for productive carbon fixation.
Occurs more in hot, dry conditions – When stomata close to prevent water loss, O₂ builds up inside the leaf, increasing photorespiration.
Seminal Paper in Modeling of PS: Farquhar et al. 1980 Planta
Title: A Biochemical Model of PS CO2 Assimilation in Leaves of C3 Species
Cited over 9900 times! (ITS OVER 9000!)
Provides a biochemical framework for CO₂ assimilation in C₃ plants, describing photosynthesis as being limited by either
Rubisco activity (carboxylation)
RuBP regeneration (electron transport), or
TPU (Triose Phosphate Utilization).
It mathematically links CO₂ diffusion, enzyme kinetics, and light reactions, making it foundational for understanding and modeling leaf gas exchange and photosynthetic efficiency in various environmental conditions.
Foundation of the FVCB Model
FVCB Model
Gold standard for modeling C3 photosynthesis and is widely used in plant physiology, climate models, and ecological research
Describe the basic features of the FvCB model of C3 leaf photosynthesis
Describe the 3 primary biochemical limitations to C3 photosynthesis
Be able to draw and interpret features of a CO2 response curve
The FvCB Model of Photosynthesis
Purpose: To model/SIMULATES photosynthetic carbon assimilation in C3 plants under a variety of environmental conditions, in a form which is compatible with gas exchange measurements of leaves
C3 v. C4 v. CAM: Dawn of Plants
Key Features of FvCB Model of Photosynthesis
Applies to C3 plants only, not C4 or CAM plants
Based on biochemistry in the chloroplast
Describes “steady-state” photosynthesis, NOT dynamic
Has been extended to whole plant, canopy, even ecosystem level
C3 photosynthesis is the most common (of 85% of plant species)
Derives its name from the 3-carbon molecules produced as an intermediary in photosynthesis
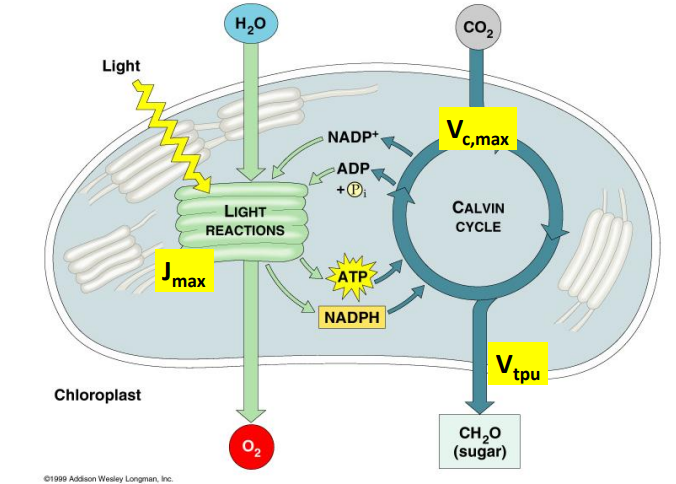
The FvCB Model of PS - Current (GRAPH 1)
3 Key Biochemical Limitations (chokepoints/weakest chain in process) to PS Carbon Assimilation Rate:
Maximum Carboxylation Rate of RubisCO activity (Vc,max)
Occurs in the STROMA of the chloroplast, where Rubisco catalyzes CO₂ fixation in the Calvin cycle.
Maximum Electron Transport Rate (Jmax) [RuBP regeneration)
Takes place in the thylakoid membrane, where PS ETC generates ATP and NADPH.
Rate of Triose Phosphate (G3P, DHAP) utilization (Vtpu)
If plant is MAKING these triose phosphates FASTER than it is taking them out and using them elsewhere it can build up in chloroplasts creating HARD CEILING which limits rate of PS
Happens in the stroma and cytosol, where G3P and DHAP are either used for
For STARCH SYNTHESIS (chloroplast) or
EXPORTED to the cytosol for SUCROSE production.
At any given time under any set of conditions, the rate of PS is determined by 1-3 of these factors (weakest link in chain determines strength in chain)
Modifications to the Original FvCB Model (current version is revised compared to what it once was)
Triose Phosphate Utilization rate (TPU) limitation
Sink-limited photosynthesis, where starch and sucrose synthesis limit availability of phosphate for ATP formation in photosynthesis
Does not occur in leaves; depends on species and environmental conditions
FvCB Model of Photosynthesis: The CO2 response (A-Ci) curve (GRAPH 2)
At low CO₂ concentrations inside the leaf, photosynthesis is Rubisco-limited (carboxylation is the bottleneck).
The rate follows the black line, increasing as more CO₂ becomes available for Rubisco to fix.
As CO₂ concentration increases, the black line would continue increasing, but in reality, the system becomes RuBP regeneration-limited (electron transport and NADPH supply become limiting).
This follows the red curve, which has a rectangular hyperbolic shape as RuBP regeneration reaches saturation.
At very high CO₂ concentrations, photosynthesis hits a hard ceiling, where it becomes triose phosphate utilization (TPU)-limited.
This results in a horizontal line, meaning further increases in CO₂ do not increase photosynthesis.
The ideal CO₂ response curve (orange line) reflects how real plants behave under changing CO₂ levels, limited by the lowest of the three constraints (Vcmax, Jmax, or Vtpu) at any given point.
When plants are measured in real-world conditions, their CO₂ assimilation follows the orange line, rather than the theoretical black or red lines.
Photosynthesis Rate is Limited By Rubisco at Current [CO2] levels
The equation A=min{f1(Vc,max),f2(Jmax),f3(VTPU)} (GRAPH 2)
The photosynthesis rate (A) is dictated by the most limiting factor at any given CO₂ concentration.
At low CO₂ → Rubisco limitation (Vc,max).
At moderate CO₂ → Electron transport limitation (Jmax).
At high CO₂ → TPU limitation (VTPU).
This is why the CO₂ response curve follows the orange line in the graph, transitioning from Rubisco-limited to electron transport-limited to TPU-limited photosynthesis.
AT CURRENT CONCENTRATIONS IN WILD, PS IS PRIMARILY LIMITED BY RUBISCO (Vc,max), as levels increase then it will SHIFT UP towards Electron Transport Limitation (Jmax)
In nature plants tend to operate near beginning of CO2-limited photosynthesis and light-limited photosynthesis (where orange touches black line
The more rubisco there is, the higher PS will be
More Rubisco increases the maximum carboxylation rate (Vc,max) allowing the plant to fix CO₂ more efficiently at low concentrations, thereby enhancing photosynthesis overall.
KNOW TOP EQUATION
![<p><strong><u>The FvCB Model of Photosynthesis</u></strong></p><ul><li><p><strong>Purpose</strong>: To model/SIMULATES photosynthetic carbon assimilation in C3 plants under a variety of environmental conditions, in a form which is compatible with gas exchange measurements of leaves</p></li></ul><p></p><p><strong><u>C3 v. C4 v. CAM: Dawn of Plants</u></strong></p><p><strong>Key Features of FvCB Model of Photosynthesis</strong></p><ul><li><p>Applies to C3 plants only, not C4 or CAM plants</p></li><li><p>Based on biochemistry in the chloroplast</p></li><li><p>Describes “steady-state” photosynthesis, NOT dynamic</p></li><li><p>Has been extended to whole plant, canopy, even ecosystem level</p><p></p><p><strong><u>C3 photosynthesis </u></strong>is the most common (of 85% of plant species)</p><ul><li><p>Derives its name from the 3-carbon molecules produced as an intermediary in photosynthesis</p></li></ul></li></ul><p></p><p><strong><u>The FvCB Model of PS - Current</u> (GRAPH 1)</strong></p><ul><li><p>3 Key Biochemical Limitations (chokepoints/weakest chain in process) to PS Carbon Assimilation Rate:</p><p></p><ol><li><p><strong>Maximum Carboxylation Rate of RubisCO activity (V<sub>c,max</sub>)</strong></p><ul><li><p>Occurs in the <strong>STROMA of the chloroplast</strong>, where <strong>Rubisco</strong> catalyzes CO₂ fixation in the Calvin cycle.</p><p></p></li></ul></li><li><p><strong>Maximum Electron Transport Rate (J<sub>max</sub>) [RuBP regeneration)</strong></p><ul><li><p>Takes place in the <strong>thylakoid membrane</strong>, where <strong>PS ETC </strong>generates ATP and NADPH.</p><p></p></li></ul></li><li><p><strong>Rate of Triose Phosphate (G3P, DHAP) utilization (V<sub>tpu</sub>)</strong></p><ul><li><p>If plant is MAKING these triose phosphates FASTER than it is taking them out and using them elsewhere it can build up in chloroplasts creating HARD CEILING which limits rate of PS</p></li><li><p>Happens in the <strong>stroma and cytosol</strong>, where <strong>G3P and DHAP</strong> are either used for</p><ul><li><p>For STARCH SYNTHESIS (<strong>chloroplast</strong>) or</p></li><li><p>EXPORTED to the <strong>cytosol </strong>for SUCROSE production.</p><p></p></li></ul></li></ul></li></ol></li></ul><p>At any given time under any set of conditions, the rate of PS is determined by 1-3 of these factors (weakest link in chain determines strength in chain)</p><p></p><p><strong><u>Modifications to the Original FvCB Model </u>(current version is revised compared to what it once was)</strong></p><ol><li><p><strong>Triose Phosphate Utilization rate (TPU) limitation</strong></p><ul><li><p>Sink-limited photosynthesis, where starch and sucrose synthesis limit availability of phosphate for ATP formation in photosynthesis</p></li><li><p>Does not occur in leaves; depends on species and environmental conditions</p></li></ul></li></ol><p></p><p><strong><u>FvCB Model of Photosynthesis: The CO<sub>2</sub> response (A-C<sub>i</sub>) curve</u> (GRAPH 2)</strong></p><ul><li><p>At <strong>low CO₂ concentrations</strong> inside the leaf, <strong>photosynthesis is Rubisco-limited</strong> (carboxylation is the bottleneck).</p><ul><li><p>The rate follows the <strong>black line</strong>, increasing as more CO₂ becomes available for Rubisco to fix.</p></li></ul></li></ul><ul><li><p>As <strong>CO₂ concentration increases</strong>, the <strong>black line would continue increasing</strong>, but in reality, the system becomes <strong>RuBP regeneration-limited</strong> (electron transport and NADPH supply become limiting).</p><ul><li><p>This follows the <strong>red curve</strong>, which has a <strong>rectangular hyperbolic shape</strong> as RuBP regeneration reaches saturation.</p></li></ul></li><li><p>At <strong>very high CO₂ concentrations</strong>, photosynthesis hits a <strong>hard ceiling</strong>, where it becomes <strong>triose phosphate utilization (TPU)-limited</strong>.</p><ul><li><p>This results in a <strong>horizontal line</strong>, meaning further increases in CO₂ <strong>do not increase photosynthesis</strong>.</p></li></ul></li><li><p>The <strong>ideal CO₂ response curve</strong> (orange line) reflects how real plants behave under changing CO₂ levels, <strong>limited by the lowest of the three constraints (Vcmax, Jmax, or Vtpu) at any given point</strong>.</p><ul><li><p>When plants are measured in real-world conditions, their <strong>CO₂ assimilation follows the orange line</strong>, rather than the theoretical black or red lines.</p></li></ul></li></ul><p></p><p><strong><u>Photosynthesis Rate is Limited By Rubisco at Current [CO<sub>2</sub>] levels</u></strong></p><ul><li><p>The equation <strong>A=min{f1(V<sub>c,max</sub>),f2(J<sub>max</sub>),f3(V<sub>TPU</sub>)}</strong> (GRAPH 2)</p><ul><li><p>The <strong>photosynthesis rate (A) is dictated by the most limiting factor</strong> at any given CO₂ concentration.</p></li><li><p>At low CO₂ → <strong>Rubisco limitation</strong> (<strong>V<sub>c,max</sub>)</strong>.</p></li><li><p>At moderate CO₂ → <strong>Electron transport limitation</strong> (<strong>J<sub>max</sub></strong>).</p></li><li><p>At high CO₂ → <strong>TPU limitation</strong> (<strong>V<sub>TPU</sub></strong>).</p></li><li><p>This is why the CO₂ response curve follows the <strong>orange line in the graph</strong>, transitioning from <strong>Rubisco-limited</strong> to <strong>electron transport-limited</strong> to <strong>TPU-limited</strong> photosynthesis.</p></li></ul></li><li><p>AT CURRENT CONCENTRATIONS IN WILD, PS IS PRIMARILY LIMITED BY RUBISCO (V<sub>c,max</sub>), as levels increase then it will SHIFT UP towards Electron Transport Limitation (J<sub>max</sub>)</p></li><li><p><strong><u>In nature plants tend to operate near beginning of CO2-limited photosynthesis and light-limited photosynthesis (where orange touches black line</u></strong></p><p></p></li></ul><ul><li><p>The more rubisco there is, the higher PS will be</p><ul><li><p>More Rubisco increases the maximum carboxylation rate (V<sub>c,max</sub>) allowing the plant to fix CO₂ more efficiently at low concentrations, thereby enhancing photosynthesis overall.</p></li></ul></li></ul><p></p><p></p><p>KNOW TOP EQUATION</p>](https://knowt-user-attachments.s3.amazonaws.com/9a9898d3-2783-4076-a5b9-3b8494bd3a08.png)
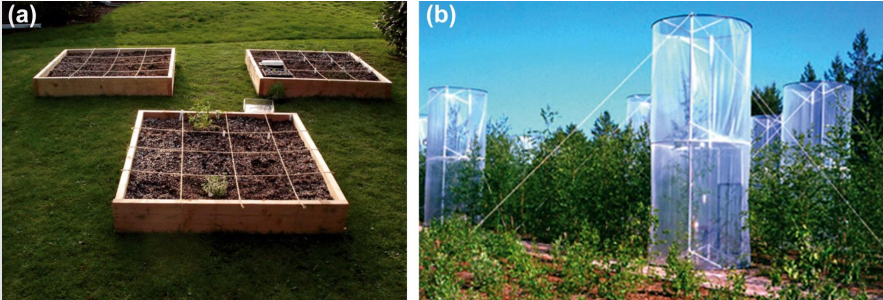
Describe the 3 main approaches to conducting CO2 experiments and their advantages and disadvantages
Explain how FACE technology works and give some examples of its application
Passive Warming Experiment
Passive warming devices are often simply circles or boxes of glass or clear plastic, which act much like miniature greenhouses but allow multispecies interactions and have minimal impact on received precipitation.
Transplantation (Graph 1: A)
Transplantation preserves plant–plant interactions and soil properties
It is usually implemented with the movement of plants embedded in whole soil.
3 ways to conduct experiments with elevated [CO2]?
CONTROLLED ENVIRONMENT GROWTH CHAMBERS
Advantages
Environmental conditions can be specified and kept constant
Experiments are repeatable
Disadvantages
ARTIFICIAL conditions (constant light, temperature, wind)
Limited in size/scale as plants need to be grown in POTS (affects rooting depths as plants respond to being grown in pots)
OPEN-TOP CHAMBERS (OTC) (GRAPH 1)
OTC reserve plant and soil relationships over a limited area
Advantages:
Small-scale and lower cost of CO2
High REPLICATION possible
Can examine multiple factors at the same time
Disadvantages:
Edge effects of the chambers
Higher TEMPERATURE or humidity inside the OTC
Limited in size/scale (affects rooting depth)
Precipitation and airflow are altered from natural field conditions
Interactions with insects are HINDERED
FREE-AIR CO2 ENRICHMENT (FACE)
Target treatment is 200 ppm above the real-time ambient [CO2]
Trtmnt plot is an octagon ring of diameter 17 m, area of ~240m2
FACE uses vertical pipes to release CO₂ around an open-air plot, mimicking future atmospheric conditions.
Wind sensors at the center detect speed and direction to regulate CO₂ distribution.
A computer-controlled system adjusts CO₂ release dynamically to maintain even exposure.
This setup allows plants to grow naturally while studying the effects of elevated CO₂.
Pros and Cons of FACE
Advantages:
Plants are grown in near-natural conditions
Minimum disturbance of microenvironment around plants
Ability to examine season-long ecosystem-level effects (e.g. interaction of soil, plants, insects, atmosphere)
Disadvantages:
Very expensive to set up and run ($20k per ring per month)
CO2 fluctuates wildly over time, NOT stable at short timescales
Treatment control accuracy dependent on wind speed
![<p>Describe various ways in which plant physiology & growth respond to increases in [CO2]:</p><p></p><p>Describe the general response of plant photosynthesis, stomatal conductance, and growth to elevated [CO2 ] as determined by the meta-analysis of FACE studies:</p>](https://knowt-user-attachments.s3.amazonaws.com/e3c52a2d-f4d0-4e39-8a45-8ecae6a46e96.png)
Describe various ways in which plant physiology & growth respond to increases in [CO2]:
Describe the general response of plant photosynthesis, stomatal conductance, and growth to elevated [CO2 ] as determined by the meta-analysis of FACE studies:
THE FOLLOWING ARE ALL FACE STUDIES META-ANALYSIS
Schematic of the Direct Initial Effects of Rising [CO2] on C3 Plant Production (GRAPH 1)
Inhibits oxygenation reaction thus DECREASING photorespiration rate
Increases rate of Rubisco carboxylation
Increases leaf area development, providing positive feedback on the plant PS rate
DECREASES transpiration and IMPROVES leaf water status
Increases leaf area growth
Mean response to elevated [CO2]
INCREASES in
Height
Stem diameter
Branch # and Leaf #
Leaf-area index (LAI)
Above-ground dry matter production (DMP)
Crop yield
DECREASES in
SLA (Specific Leaf Area)
Elevated CO₂ leads to thicker, denser leaves with less area per gram of tissue, hence lower SLA—even though overall leaf number, LAI, and biomass go up
Leaf Physiological Response to e[CO2] for many plant species in FACE experiments
e[CO2]=elevated CO2
INCREASES in
Light-saturated CO2 uptake (Asat)
Diurnal carbon assimilation (A’)
Apparent Quantum Yield of CO2 uptake (AQY)
Instantaneous Transpiration Efficiency (ITE)
DECREASES in
Stomatal conductance (gs)
Ci:ca
Ratio of intercellular to atmospheric CO2 concentration
Photosynthetic Acclimation (downregulation of PS capacity in elevated CO2)
Has been observed in plants grown in elevated [CO2]
Photosynthetic acclimation is a DOWNREGULATION of photosynthetic capacity in plants exposed to prolonged elevated CO₂, often due to reduced demand for photosynthetic enzymes like Rubisco.
In WHITE CLOVER, this means that although initial photosynthesis rates increase, the plant later adjusts by producing fewer photosynthetic proteins, balancing its internal carbon and nutrient economy.
What causes downregulation of PS under eCO2?
DRIVING FACTOR of downregulation of photosynthesis is PRIMARILY caused by: A reduction in total LEAF NITROGEN CONTENT
This limits the synthesis of Rubisco and other PS proteins
Decreases in Vc,max (maximum rubisco carboxylation rate) and Jmax (maximum rate of electron transport) are ultimately due to these decreases in Rubisco content and other PS proteins
This ultimately reflects a lower PS capacity despite high CO2 availability
Effect of eCO2 on evapotranspiration & WUE
Evapotranspiration (ET) typically DECREASES mildly in most plants grown under eCO2
Thus, water-use efficiency (WUE) of plants generally IMPROVES under eCO2
Lower ET (Evapotranspiration) may cause HIGHER canopy temperatures
This results in INCREASED risk of heat stress
False-color IR photographs show the INCREASE in leaf surface temperature due to reduced evapotranspiration as a result of eCO2
Ambient CO2 levels give average of 26.1 C in Illinois Soybean
Elevated CO2 levels give average of 27.5 C in Illinois, Soybean
Response of Soybeans to Growth in e[CO2]—growth chamber vs. FACE
A comparison of light-saturated PS (Asat), daily carbon uptake (A’), stomatal conductance (gs), and in-vivo maximum carboxylation rate (Vc,max) from a meta-analysis of:
Growth chamber/controlled environment (CE) studies of soybean grown at eCO2
Free-Air Carbon Dioxide Enrichment (FACE) studies of soybeans grown at eCO2
On AVERAGE, % increase of different values at eCO2 is slightly greater/more pronounced in CE/growth chambers than at FACE
Grain Yield Response to e[CO2] differs amongst rice varieties-GxE interaction (GRAPH 2)
Intraspecific variability in biomass response to eCO2 at the Tsukuba FACE site in 2010
Not all rice varieties respond the same way to eCO2
Rice varieties differ in how much more biomass they produce under elevated CO₂ — some benefit a lot, others barely.
Varieties like Takanari (6), Akidawara (7), and Norin 8 (8) show larger increases in biomass under eCO₂, compared to varieties like Akihikari (1) or Akitakomachi (2).
The FACE/Ambient ratio increases with days to heading, suggesting that later-heading varieties respond more strongly to eCO₂.
This reflects genotype × environment (G×E) interactions, which are crucial for breeding climate-resilient crops.
Genotype × Environment (G×E) interaction
Means that different genetic varieties (genotypes) respond differently to changes in environmental conditions.
In this context, it shows that some rice genotypes gain MORE biomass than others under elevated CO₂, highlighting the importance of choosing the right varieties for future climates.
![<p><span style="color: blue"><strong>THE FOLLOWING ARE ALL FACE STUDIES META-ANALYSIS</strong></span></p><p></p><p><strong><u>Schematic of the Direct Initial Effects of Rising [CO<sub>2</sub>] on C<sub>3</sub> Plant Production</u> (GRAPH 1)</strong></p><ul><li><p>Inhibits oxygenation reaction thus DECREASING photorespiration rate</p></li><li><p>Increases rate of Rubisco carboxylation</p><ul><li><p>Increases leaf area development, providing positive feedback on the plant PS rate</p></li></ul></li><li><p>DECREASES transpiration and IMPROVES leaf water status</p><ul><li><p>Increases leaf area growth</p></li></ul></li></ul><p></p><p><strong>Mean response to elevated [CO2]</strong></p><ul><li><p>INCREASES in</p><ul><li><p>Height</p></li><li><p>Stem diameter</p></li><li><p>Branch # and Leaf #</p></li><li><p>Leaf-area index (LAI)</p></li><li><p>Above-ground dry matter production (DMP)</p></li><li><p>Crop yield</p></li></ul></li><li><p>DECREASES in</p><ul><li><p>SLA (Specific Leaf Area)</p><ul><li><p>Elevated CO₂ leads to <strong>thicker, denser leaves</strong> with <strong>less area per gram of tissue</strong>, hence <strong>lower SLA</strong>—even though overall leaf number, LAI, and biomass go up</p></li></ul></li></ul></li></ul><p></p><p><strong><u>Leaf Physiological Response to e[CO<sub>2</sub>] for many plant species in FACE experiments</u></strong></p><ul><li><p>e[CO<sub>2</sub>]=elevated CO<sub>2</sub></p></li><li><p>INCREASES in</p><ul><li><p>Light-saturated CO2 uptake (A<sub>sat</sub>)</p></li><li><p>Diurnal carbon assimilation (A’)</p></li><li><p>Apparent Quantum Yield of CO2 uptake (AQY)</p></li><li><p>Instantaneous Transpiration Efficiency (ITE)</p></li></ul></li><li><p>DECREASES in</p><ul><li><p>Stomatal conductance (g<sub>s</sub>)</p></li><li><p>C<sub>i</sub>:c<sub>a</sub></p><ul><li><p>Ratio of intercellular to atmospheric CO<sub>2</sub> concentration</p></li></ul></li></ul></li></ul><p></p><p><strong><u>Photosynthetic Acclimation (</u>downregulation of PS capacity in elevated CO2)</strong></p><ul><li><p>Has been observed in plants grown in elevated [CO<sub>2</sub>]</p></li><li><p>Photosynthetic acclimation is a <strong>DOWNREGULATION of photosynthetic capacity</strong> in plants exposed to prolonged elevated CO₂, often due to reduced demand for photosynthetic enzymes like Rubisco.</p></li><li><p> In WHITE CLOVER, this means that although initial photosynthesis rates increase, the plant later adjusts by producing fewer photosynthetic proteins, balancing its internal carbon and nutrient economy.</p></li></ul><p></p><p><strong><u>What causes downregulation of PS under eCO2?</u></strong></p><ul><li><p>DRIVING FACTOR of downregulation of photosynthesis is PRIMARILY caused by: A reduction in total LEAF NITROGEN CONTENT</p><ul><li><p>This limits the synthesis of Rubisco and other PS proteins</p></li></ul></li><li><p>Decreases in <strong>V<sub>c,max</sub></strong> (maximum rubisco carboxylation rate) and <strong>J<sub>max</sub> </strong>(maximum rate of electron transport) are ultimately due to these decreases in Rubisco content and other PS proteins</p></li><li><p><strong><em>This ultimately reflects a lower PS capacity despite high CO<sub>2</sub> availability</em></strong></p></li></ul><p></p><p><strong><u>Effect of eCO<sub>2</sub> on evapotranspiration & WUE</u></strong></p><ul><li><p>Evapotranspiration (ET) typically DECREASES mildly in most plants grown under eCO<sub>2</sub></p></li><li><p>Thus, water-use efficiency (WUE) of plants generally IMPROVES under eCO<sub>2</sub></p></li></ul><p></p><p><strong><u>Lower ET (Evapotranspiration) may cause HIGHER canopy temperatures</u></strong></p><ul><li><p>This results in INCREASED risk of heat stress</p></li><li><p>False-color IR photographs show the INCREASE in leaf surface temperature due to reduced evapotranspiration as a result of eCO2</p></li><li><p>Ambient CO<sub>2</sub> levels give average of 26.1 C in Illinois Soybean</p></li><li><p>Elevated CO<sub>2</sub> levels give average of 27.5 C in Illinois, Soybean</p></li></ul><p></p><p><strong><u>Response of Soybeans to Growth in e</u>[CO<sub>2</sub>]—growth chamber vs. FACE</strong></p><ul><li><p>A comparison of light-saturated PS (A<sub>sat</sub>), daily carbon uptake (A’), stomatal conductance (g<sub>s</sub>), and in-vivo maximum carboxylation rate (V<sub>c,max</sub>) from a meta-analysis of:</p><ul><li><p>Growth chamber/controlled environment (CE) studies of soybean grown at eCO<sub>2</sub></p></li><li><p>Free-Air Carbon Dioxide Enrichment (FACE) studies of soybeans grown at eCO<sub>2</sub></p></li></ul></li><li><p>On AVERAGE, % increase of different values at eCO<sub>2</sub> is slightly greater/more pronounced in CE/growth chambers than at FACE</p></li></ul><p></p><p><strong><u>Grain Yield Response to e[CO<sub>2</sub>] differs amongst rice varieties-GxE interaction</u> (GRAPH 2)</strong></p><ul><li><p>Intraspecific variability in biomass response to eCO<sub>2</sub> at the Tsukuba FACE site in 2010</p><ul><li><p>Not all rice varieties respond the same way to eCO<sub>2</sub></p></li><li><p>Rice varieties differ in how much more biomass they produce under elevated CO₂ — some benefit a lot, others barely.</p></li></ul></li><li><p>Varieties like <strong>Takanari (6)</strong>, <strong>Akidawara (7)</strong>, and <strong>Norin 8 (8)</strong> show <strong>larger increases in biomass under eCO₂</strong>, compared to varieties like <strong>Akihikari (1)</strong> or <strong>Akitakomachi (2)</strong>.</p></li><li><p>The <strong>FACE/Ambient ratio increases with days to heading</strong>, suggesting that <strong>later-heading varieties respond more strongly</strong> to eCO₂.</p></li><li><p class="">This reflects <strong>genotype × environment (G×E) interactions</strong>, which are crucial for breeding climate-resilient crops.</p></li></ul><p class=""></p><p class=""><strong><u>Genotype × Environment (G×E) interaction</u></strong> </p><ul><li><p class="">Means that different genetic varieties (genotypes) respond differently to changes in environmental conditions. </p></li><li><p class="">In this context, it shows that some rice genotypes gain MORE biomass than others under elevated CO₂, highlighting the importance of choosing the right varieties for future climates.</p></li></ul><p></p>](https://knowt-user-attachments.s3.amazonaws.com/6e0309f8-588e-44c9-a0df-c2905485263b.png)
Describe the differential response to eCO2 between plant functional groups and between C3 vs. C4 plants.
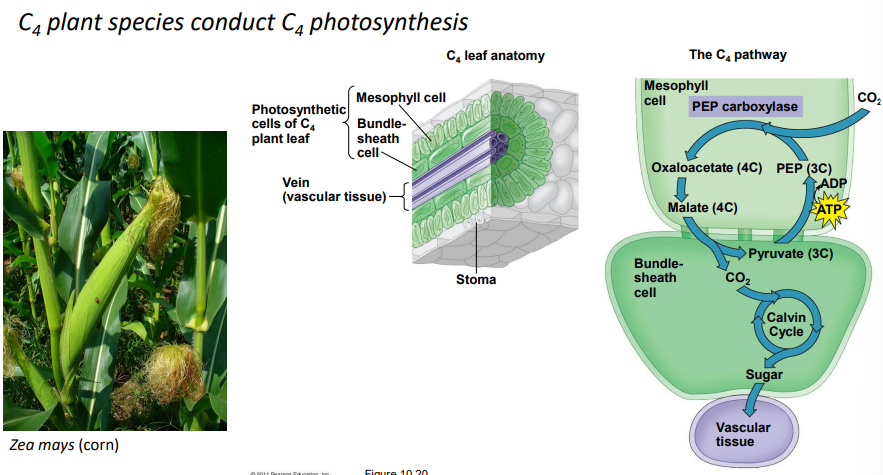
C4 Plant Species Conduct C4 Photosynthesis/PS (GRAPH 1)
C4 photosynthesis is more common in arid/desert plants
The PS rate of C4 plants is more resilient and LESS responsive to higher temperatures than are C3 plants
C₄ plants already have a built-in mechanism to concentrate CO₂ near Rubisco, which:
Reduces photorespiration
Increases photosynthetic efficiency, especially in hot, dry, and bright conditions
Example of C4 plant species: Zea Mays (CORN)
C₄ plants like corn are less responsive to rising CO₂ than C₃ plants.
Because they already optimize CO₂ usage internally, adding more CO₂ in the air doesn’t help them much further.
C4 Photosynthesis (Nutshell Version)
Step 1 (in mesophyll cells):
CO₂ is captured by the enzyme PEP carboxylase, not Rubisco.
This forms oxaloacetate (4C), then malate (4C).
Step 2 (transport):
Malate is shuttled into the bundle-sheath cells.
Step 3 (in bundle-sheath cells):
Malate is broken down to release CO₂ near Rubisco, where the Calvin Cycle happens.
This concentrates CO₂ around Rubisco, reducing photorespiration.
FINAL PRODUCT: Sugar → sent to the vascular tissue.
Comparison of C3 vs. C4 species & between functional groups (GRAPH 2)
Elevated CO₂ reduces stomatal conductance in both C₃ and C₄ species, improving water-use efficiency.
C₃ species show large increases in photosynthesis with CO₂ enrichment.
C₄ species show limited photosynthetic response because their CO₂-concentrating mechanism already makes them efficient under current CO₂ levels.
The response to elevated CO₂ varies across plant functional groups, with C₃ crops showing particularly strong positive responses.
It's true that C₄ plants perform better than C₃ plants in hot, dry environments—but that’s due to their temperature and water-use efficiency, not because they respond better to elevated CO₂.
[Ambient CO2]=366 ppm
[Elevated CO2]=566 ppm
Meta-Analysis of FACE Experiments: Growth response variability across plant functional types
LAI=Leaf Area Index
DMP=Dry Matter Production (Biomass)
Crop Yield=Amount of grain or agricultural production
All crops involved (Trees, Shrubs, C3 Crops, C3 grasses, legumes, C4, Rice, Wheat, Cotton, Sorghum)
Experience increases to varying degrees in height, LAI, DMP, and crop yield
Summary of FACE Results vs. Previous CE or OTC Results
Comparison of the general results of plant responses to elevated [CO2] from this analysis of large-scale FACE experiments (FACE) vs previous quantitative reviews of elevated [CO2] experiments (prior) used with controlled environmental chambers (CE/OTC)
FACE experiments, which simulate real-world conditions more accurately than enclosed chambers (CE/OTC), suggest that earlier studies may have OVERESTIMATED plant and crop responses to elevated CO₂—particularly for C₄ species and yield gains.
Crop yield stimulation
FACE: Small
Prior: Large
→ Suggests earlier studies overstated yield benefits from eCO₂.
C₃ vs. C₄ response
FACE: C₃ >> C₄ (strong difference)
Prior: C₃ > C₄ or no group difference
→ Stronger contrast seen under real-world FACE conditions; C₄ benefits are minimal.
Leaf Area Index (LAI)
FACE: Increase only in trees
Prior: Increase across plant types
→ Indicates prior studies overestimated structural growth responses in other groups.
Photosynthetic acclimation
FACE: Yes (downregulation via Vcₘₐₓ/Jₘₐₓ)
Prior: No change observed
→ FACE shows plants adjust and reduce their photosynthetic machinery over time, limiting long-term gains.
Here's how to think about it:
In prior CE/OTC studies, plants looked like they were thriving under elevated CO₂—more biomass, higher yield, etc.
This led to the assumption: "More CO₂ = Better performance"
But in FACE studies, plants in open-air conditions:
Acclimate (e.g., reduce Rubisco and photosynthetic proteins)
Downregulate photosynthesis over time
Show smaller yield increases, especially for crops
And C₄ plants, already efficient, show little to no extra benefit
So in a way:
A strong early response (like more photosynthesis or biomass) can trigger feedback mechanisms (like N dilution, Rubisco reduction) that limit long-term benefit.
It’s not that a greater response is a “detriment” in itself—but rather that:
It masks internal adjustments the plant makes
Those adjustments often reduce sustained gains
FACE experiments, which simulate real-world conditions more accurately than enclosed chambers (CE/OTC), suggest that earlier studies may have OVERESTIMATED plant and crop responses to elevated CO₂—particularly for C₄ species and yield gains.
![<p><strong><u>C<sub>4</sub> Plant Species Conduct C<sub>4 </sub>Photosynthesis/PS</u> (</strong><span style="color: rgb(13, 187, 235)"><strong>GRAPH 1</strong></span><strong>)</strong></p><ul><li><p>C4 photosynthesis is more common in arid/desert plants</p></li><li><p>The PS rate of C4 plants is more resilient and LESS responsive to higher temperatures than are C3 plants</p></li><li><p>C₄ plants already have a built-in mechanism to <strong>concentrate CO₂ near Rubisco</strong>, which:</p><ul><li><p class=""><strong>Reduces photorespiration</strong></p></li><li><p class=""><strong>Increases photosynthetic efficiency</strong>, especially in hot, dry, and bright conditions</p></li></ul></li><li><p>Example of C4 plant species: Zea Mays (CORN)</p><ul><li><p>C₄ plants like corn are <strong>less responsive to rising CO₂</strong> than C₃ plants.</p></li><li><p>Because they already optimize CO₂ usage internally, <strong>adding more CO₂ in the air doesn’t help them much further</strong>.</p></li><li><p></p></li></ul></li></ul><p></p><p><strong><u>C4 Photosynthesis (Nutshell Version)</u></strong></p><ul><li><p class=""><strong>Step 1 (in mesophyll cells):</strong></p><ul><li><p class="">CO₂ is captured by the enzyme PEP carboxylase, not Rubisco.</p></li><li><p class="">This forms oxaloacetate (4C), then malate (4C).</p></li></ul></li><li><p class=""><strong>Step 2 (transport):</strong></p><ul><li><p class="">Malate is shuttled into the bundle-sheath cells.</p></li></ul></li><li><p class=""><strong>Step 3 (in bundle-sheath cells):</strong></p><ul><li><p class="">Malate is broken down to release CO₂ near Rubisco, where the Calvin Cycle happens.</p></li><li><p class="">This concentrates CO₂ around Rubisco, reducing photorespiration.</p></li></ul></li><li><p class=""><strong>FINAL PRODUCT</strong>: Sugar → sent to the <strong>vascular tissue</strong>.</p></li></ul><p class=""></p><p class=""><strong><u>Comparison of C3 vs. C4 species & between functional groups</u> (GRAPH 2)</strong></p><ul><li><p class="">Elevated CO₂ reduces stomatal conductance in both C₃ and C₄ species, improving water-use efficiency.</p></li><li><p class="">C₃ species show large increases in photosynthesis with CO₂ enrichment.</p></li><li><p class="">C₄ species show limited photosynthetic response because their CO₂-concentrating mechanism already makes them efficient under current CO₂ levels.</p></li><li><p class="">The response to elevated CO₂ varies across plant functional groups, with <strong>C₃ crops</strong> showing particularly strong positive responses.</p></li><li><p class="">It's true that C₄ plants <strong>perform better than C₃ plants in hot, dry environments</strong>—but that’s due to their <strong>temperature and water-use efficiency</strong>, <em>not</em> because they respond better to elevated CO₂.</p></li><li><p class="">[Ambient CO<sub>2</sub>]=366 ppm</p></li><li><p class="">[Elevated CO<sub>2</sub>]=566 ppm</p></li></ul><p class=""></p><p class=""><strong><u>Meta-Analysis of FACE Experiments: </u>Growth response variability across plant functional types</strong></p><ul><li><p class="">LAI=Leaf Area Index</p></li><li><p class="">DMP=Dry Matter Production (Biomass)</p></li><li><p class="">Crop Yield=Amount of grain or agricultural production</p></li><li><p class="">All crops involved (Trees, Shrubs, C3 Crops, C3 grasses, legumes, C4, Rice, Wheat, Cotton, Sorghum)</p><ul><li><p class="">Experience increases to varying degrees in height, LAI, DMP, and crop yield</p></li></ul></li></ul><p class=""></p><p class=""><strong><u>Summary of FACE Results vs. Previous CE or OTC Results</u></strong></p><ul><li><p>Comparison of the general results of plant responses to elevated [CO<sub>2</sub>] from this analysis of large-scale FACE experiments (FACE) vs previous quantitative reviews of elevated [CO<sub>2</sub>] experiments (prior) used with controlled environmental chambers (CE/OTC)</p><ul><li><p>FACE experiments, which simulate real-world conditions more accurately than enclosed chambers (CE/OTC), suggest that <strong>earlier studies may have OVERESTIMATED </strong>plant and crop responses to elevated CO₂—particularly for <strong>C₄ species and yield gains</strong>.</p></li></ul></li></ul><p><strong>Crop yield stimulation</strong></p><ul><li><p class=""><strong>FACE</strong>: Small</p></li><li><p class=""><strong>Prior</strong>: Large</p></li><li><p class="">→ Suggests <strong>earlier studies overstated yield benefits</strong> from eCO₂.</p></li></ul><p class=""><strong>C₃ vs. C₄ response</strong></p><ul><li><p class=""><strong>FACE</strong>: C₃ >> C₄ (strong difference)</p></li><li><p class=""><strong>Prior</strong>: C₃ > C₄ or no group difference</p></li><li><p class="">→ <strong>Stronger contrast</strong> seen under real-world FACE conditions; <strong>C₄ benefits are minimal</strong>.</p></li></ul><p class=""><strong>Leaf Area Index (LAI)</strong></p><ul><li><p class=""><strong>FACE</strong>: Increase only in trees</p></li><li><p class=""><strong>Prior</strong>: Increase across plant types</p></li><li><p class="">→ Indicates <strong>prior studies overestimated structural growth responses</strong> in other groups.</p></li></ul><p class=""><strong>Photosynthetic acclimation</strong></p><ul><li><p class=""><strong>FACE</strong>: Yes (downregulation via Vcₘₐₓ/Jₘₐₓ)</p></li><li><p class=""><strong>Prior</strong>: No change observed</p></li><li><p class="">→ FACE shows plants <strong>adjust and reduce their photosynthetic machinery</strong> over time, <strong>limiting long-term gains</strong>.</p></li></ul><p class=""></p><p class="">Here's how to think about it: </p><ul><li><p class="">In <strong>prior CE/OTC studies</strong>, plants looked like they were thriving under elevated CO₂—more biomass, higher yield, etc.</p><ul><li><p class="">This led to the assumption: <strong>"More CO₂ = Better performance"</strong></p></li></ul></li><li><p class="">But in <strong>FACE studies</strong>, plants in open-air conditions:</p><ul><li><p class=""><strong>Acclimate</strong> (e.g., reduce Rubisco and photosynthetic proteins)</p></li><li><p class=""><strong>Downregulate photosynthesis over time</strong></p></li><li><p class=""><strong>Show smaller yield increases</strong>, especially for crops</p></li><li><p class="">And C₄ plants, already efficient, <strong>show little to no extra benefit</strong></p></li></ul></li></ul><p class=""></p><p class="">So in a way: </p><figure data-type="blockquoteFigure"><div><blockquote><p class="">A <strong>strong early response</strong> (like more photosynthesis or biomass) can <strong>trigger feedback mechanisms</strong> (like N dilution, Rubisco reduction) that <strong>limit long-term benefit</strong>.</p></blockquote><figcaption></figcaption></div></figure><p class="">It’s not that a greater response is a “detriment” in itself—but rather that:</p><p> </p><ul><li><p class="">It <strong>masks internal adjustments</strong> the plant makes</p></li><li><p class="">Those adjustments often <strong>reduce sustained gains</strong></p></li><li><p>FACE experiments, which simulate real-world conditions more accurately than enclosed chambers (CE/OTC), suggest that <strong>earlier studies may have OVERESTIMATED </strong>plant and crop responses to elevated CO₂—particularly for <strong>C₄ species and yield gains</strong>.</p></li></ul><p></p>](https://knowt-user-attachments.s3.amazonaws.com/fa6fa74f-3c64-4927-9cd8-596999f244b4.png)
![<p>Describe the effect of elevated [CO2] on nutrient concentrations in plant tissue</p><p></p><p>Outline 2 hypotheses for the decrease in nutrient concentrations</p>](https://knowt-user-attachments.s3.amazonaws.com/49270ec8-8aa6-4c1c-ab83-bf103bc6f7e3.png)
Describe the effect of elevated [CO2] on nutrient concentrations in plant tissue
Outline 2 hypotheses for the decrease in nutrient concentrations
Crops grown in eCO2 show DECREASES in nutrient concentrations in PLANT TISSUE
Response of nutrient concentration to growth in eCO2
Nutrients like Ni, Al, Co, Mg, K, Fe, etc all had recorded DECREASES in concentration within plant tissue as a result of being grown in eCO2
Growth in eCO2 decreases nutrient concentrations in grains too
Zn, Fe, Protein, Phytate all recorded decreases in
C3 Grasses
Wheat and Rice
C3 Legumes
Field peas and soybeans
C4 Grasses (least affected
Maize and Sorghum
Mass Flow (Bulk Flow)
Nutrients and water are taken up by root hairs via mass (bulk) flow, driven by POSITIVE PRESSURE in the root zone.
Water is conducted upward through the XYLEM into the leaves, primarily driven by transpiration pull (NEGATIVE PRESSURE)
Sugars produced in leaves (source) are loaded into the PHLOEM , creating an osmotic gradient that draws in water from nearby xylem, generating POSITIVE PRESSURE that drives sugar transport from source to sink (e.g., roots).
At the SINK/ROOTS, sugars are unloaded, and water exits the phloem. Xylem helps recycle this water back from the sink to the source, helping maintain the phloem pressure gradient.
During CO₂ diffusion into leaves, water evaporates through stomata (transpiration), reinforcing the tension that pulls water UPWARD in the xylem.
Two/Three Hypotheses for the Decrease in Nutrient Concentrations
REDUCED transpiration in eCO2 reduces mass flow of nutrients to roots; reducing nutrient uptake.
Changes in physiological processes differentially affect proteins and their mineral constituents, thus altering allocation and possibly total demand of nutrients
Dilution Effect (not in slides)
Dilution by enhanced production of carbohydrates is already known to decrease nutrient concentration in elevated [CO2] independent of effects of mass flow
This figure DOES NOT support Hypothesis #1 (GRAPH 1)
Hypothesis 1: “Reduced transpiration in elevated CO₂ reduces mass flow of nutrients to roots, reducing nutrient uptake.”
Why this hypothesis CAN be supported:
Here, we show a statistically significant correlation between percentage of uptake acquired through mass flow and reduction in nutrient concentration, supporting the hypothesis that reduced transpiration in elevated [CO2] contributes to the DECLINE of nutrients
Overall, the regressions between percent of uptake acquired through mass flow and change in nutrient concentration tended to result in negative slopes and intercepts at levels of eCO2
In regards to nutrient decreases under elevated CO2, we see that DECREASED mass flow is part of the reason why
Magnesium an example of Hypothesis #2? (GRAPH 2)
Hypothesis 2: “Changes in physiological processes differentially affect proteins and their mineral constituents, thus altering allocation and possibly total demand of nutrients.”
The reduction of Mg concentration was pretty much the same as any other nutrient in all plant tissues EXCEPT in STEMS and LEAVES where the Magnesium/Mg was MUCH MORE SIGNIFICANT
Magnesium’s role in chlorophyll and Rubisco—both reduced under eCO₂—explains the greater drop in leaves and stems.
For SOME nutrients, we do see a changed allocation of where that nutrient ends up or how much of that nutrient ends up in different parts of the plant
This suggests FUNCTIONAL DEMAND changes, NOT just general dilution or TRANSPORT issues.
![<p><strong><u>Crops grown in eCO<sub>2</sub> show DECREASES in nutrient concentrations in PLANT TISSUE</u></strong></p><ul><li><p>Response of nutrient concentration to growth in eCO<sub>2</sub></p></li><li><p>Nutrients like Ni, Al, Co, Mg, K, Fe, etc all had recorded DECREASES in concentration within plant tissue as a result of being grown in eCO<sub>2</sub></p></li></ul><p></p><p><strong><u>Growth in eCO<sub>2</sub> decreases nutrient concentrations in grains too</u></strong></p><ul><li><p>Zn, Fe, Protein, Phytate all recorded decreases in</p></li><li><p><strong>C3 Grasses</strong></p><ul><li><p>Wheat and Rice</p></li></ul></li><li><p><strong>C3 Legumes</strong></p><ul><li><p>Field peas and soybeans</p></li></ul></li><li><p><strong>C4 Grasses (least affected</strong></p><ul><li><p>Maize and Sorghum</p></li></ul></li></ul><p></p><p><strong><u>Mass Flow (Bulk Flow)</u></strong></p><ol><li><p class=""><strong>Nutrients and water</strong> are taken up by <strong>root hairs</strong> via <strong>mass (bulk) flow</strong>, driven by <strong>POSITIVE PRESSURE </strong>in the root zone.</p></li><li><p class=""><strong>Water</strong> is conducted <strong>upward through the XYLEM </strong>into the leaves, primarily driven by <strong>transpiration pull</strong> (<strong>NEGATIVE PRESSURE</strong>)</p></li><li><p class=""><strong>Sugars</strong> produced in leaves (source) are loaded into the <strong>PHLOEM </strong>, creating an <strong>osmotic gradient</strong> that draws in water from nearby xylem, generating <strong>POSITIVE PRESSURE</strong> that drives sugar transport <strong>from source to sink</strong> (e.g., roots).</p></li><li><p class="">At the <strong>SINK/ROOTS</strong>, sugars are unloaded, and water exits the phloem. <strong>Xylem helps recycle this water</strong> back from the sink to the source, helping maintain the <strong>phloem pressure gradient</strong>.</p></li><li><p class="">During <strong>CO₂ diffusion into leaves</strong>, <strong>water evaporates through stomata</strong> (transpiration), reinforcing the <strong>tension that pulls water UPWARD </strong>in the xylem.</p><p class=""></p></li></ol><p><strong><u>Two/Three Hypotheses for the Decrease in Nutrient Concentrations</u></strong></p><ol><li><p>REDUCED transpiration in eCO<sub>2</sub> reduces mass flow of nutrients to roots; reducing nutrient uptake.</p></li></ol><p></p><ol start="2"><li><p>Changes in physiological processes differentially affect proteins and their mineral constituents, thus altering allocation and possibly total demand of nutrients</p></li></ol><p></p><ol start="3"><li><p>Dilution Effect (not in slides)</p><ul><li><p>Dilution by enhanced production of carbohydrates is already known to decrease nutrient concentration in elevated [CO2] independent of effects of mass flow</p></li></ul></li></ol><p></p><p><strong><u>This figure DOES NOT support Hypothesis #1 </u>(GRAPH 1)</strong></p><ul><li><p>Hypothesis 1: “Reduced transpiration in elevated CO₂ reduces mass flow of nutrients to roots, reducing nutrient uptake.”</p></li><li><p><strong>Why this hypothesis CAN be supported:</strong> </p><ul><li><p class="">Here, we show a statistically significant correlation between percentage of uptake acquired through mass flow and reduction in nutrient concentration, supporting the hypothesis that reduced transpiration in elevated [CO2] contributes to the DECLINE of nutrients</p></li><li><p class="">Overall, the regressions between percent of uptake acquired through mass flow and change in nutrient concentration tended to result in negative slopes and intercepts at levels of eCO2</p></li><li><p class="">In regards to nutrient decreases under elevated CO2, we see that DECREASED mass flow is part of the reason why</p><p class=""></p></li></ul></li></ul><p><strong><u>Magnesium an example of Hypothesis #2?</u> (GRAPH 2)</strong></p><ul><li><p>Hypothesis 2: “Changes in physiological processes differentially affect proteins and their mineral constituents, thus altering allocation and possibly total demand of nutrients.”</p></li><li><p>The reduction of Mg concentration was pretty much the same as any other nutrient in all plant tissues EXCEPT in STEMS and LEAVES where the Magnesium/Mg was MUCH MORE SIGNIFICANT</p></li><li><p>Magnesium’s role in chlorophyll and Rubisco—both reduced under eCO₂—explains the greater drop in leaves and stems.</p></li><li><p>For SOME nutrients, we do see a changed allocation of where that nutrient ends up or how much of that nutrient ends up in different parts of the plant</p></li><li><p>This suggests <strong>FUNCTIONAL DEMAND </strong>changes, NOT just general dilution or TRANSPORT issues.</p></li></ul><p class=""></p><p></p>](https://knowt-user-attachments.s3.amazonaws.com/761a3711-9a8b-46b7-9510-e40b315497b9.png)
![<p>Explain why rising [CO2] is not a direct threat to human health</p><p></p><p>Describe several examples of animals or micro-organisms that sense and respond to carbon dioxide</p><p></p><p>Describe the primary categories or composition of air pollution and its causes</p><p></p><p>Describe the impacts of air pollution on human health</p><p></p><p>Distinguish between dose and exposure and explain its relevance to the issue of air pollution health impacts</p>](https://knowt-user-attachments.s3.amazonaws.com/56d68a0d-24a3-42e3-baf5-ebee277586ae.png)
Explain why rising [CO2] is not a direct threat to human health
Describe several examples of animals or micro-organisms that sense and respond to carbon dioxide
Describe the primary categories or composition of air pollution and its causes
Describe the impacts of air pollution on human health
Distinguish between dose and exposure and explain its relevance to the issue of air pollution health impacts
Impact of rising [CO2] on living organisms
Present concentration of atmospheric gasses
[N2]=78%
[O2]=21%
[Ar]=0.93%
[CO2]=420ppm=0.0420%
CO2 has to be AT LEAST 1% concentration for us to feel its effects, not really a concern
Inert gas asphyxiation—if [O2] drops below 19.5% as another gas concentration increases
In almost all situations, CO2-related asphyxiation is NOT a risk for humans
Main Symptoms of CO2 Toxicity
When you reach ~1% CO2
Drowsiness
When you reach ~3% CO2
Mild narcosis
Increased heart rate and blood pressure
Reduced hearing
When you reach ~5% CO2
Dizziness
Confusion
Headache
Shortness of breath
When you reach ~8% CO2
Unconsciousness
Sweating
Tremor
Dimmed sight
Examples of CO2-sensing Organisms
Plant GUARD cells: Adjust stomatal aperture in response to changes in [CO2]
Anthrax bacterium (Bacillus anthracis) & pathogenic fungi—senses HIGH [CO2] (~0.5%) to know when it arrives in a host’s lungs or bloodstreams
High CO₂ is a physiological cue for anthrax (and some fungi) to switch from an environmental survival mode (spore) to an active infection mode.
Ants, bees, termites sense [CO2] to monitor hive activity and location
Some herbivorous insects (e.g. Cactoblastic cactorum) track tiny decreases in [CO2] to locate cacti to feed on at night
Blood-sucking insects (mosquitoes, ticks, etc.) follow a trail to CO2 to locate their next meal
PRO TIP: Aim fan at door and mosquitoes will find it much more difficult to enter
**************************************************************************************
South Coast Air Quality Monitoring District SCAQMD) - Right to Breathe Video
Health Impacts:
Many individuals and families suffer from asthma, respiratory issues, and cancer, often linked to air pollution from industrial sources and traffic.
Breathing problems dominate every aspect of life—when you can’t breathe, nothing else matters.
Disproportionate Burden:
Low-income and minority communities often live near freeways, factories, and refineries, while wealthier neighborhoods are spared.
These communities face higher exposure to pollutants, yet have less representation in environmental decision-making.
Pollution Sources & Consequences:
Mobile sources (cars, trucks, planes, trains) are major contributors.
Pollution can ACTIVATE CANCER-RELATED GENES and may even affect fetal development.
Even though air quality has improved overall, “what you can’t see can still hurt you.”
Technology & Policy Solutions:
Clean technologies (electric vehicles, fuel-cell cars) are emerging and must expand to heavier vehicles.
Policy, incentives, and public engagement are all needed to align for meaningful change.
Everyone—from individuals to policymakers—has a role to play.
Call to Action:
Educate communities, especially those with limited resources.
Small personal changes, like taking public transit, matter.
Use your voice—everyone has the right and responsibility to be part of the solution.
What is air pollution?
Gasses
Ozone (O3)
Nitrous dioxide (NO2)
Sulfur dioxide (SO2)
Carbon monoxide (CO)
Particulate Matter (PM)
Categorized by particle size (in microns)
Two frequently used categories are:
PM 2.5/FINE
PRIMARILY combustion particles, organic compounds, metals <2.5microm in diameter
PM 10/COARSE
Dust, pollution, mould, <10microm in diameter
Traffic-related air pollution (TRAP)
Outdoor vs. indoor
Sources of Outdoor Air Pollution
Where air pollution is produced and then moves is dependent on atmospheric circulation patterns, local wind patterns, weather conditions, and geography
Not always is place which produces pollution that gets the results of it
We have scientists that model the dynamics and travel patterns of atmospheric pollutants
Not always is the pollutant is a pollutant at the time its produced, due to atmospheric chemistry it can later be converted into a pollutant though
Primary Health Effects of Air Pollution (KNOW FOR EXAM)
Linked to 5-7 million premature deaths per year
Exacerbation or onset of asthma, allergies, and inflammation
Increased respiratory and cardiovascular-related disease and mortality
PM (Particulate Matter) air pollution is a carcinogen linked to increased rates of lung CANCER
Smallest particles are of biggest concern to us as they can make their way deeper into lungs, bronchioles, alveoli, even ending up absorbed in our BLOOD STREAM
THE FINER THE PM, THE LOWER IT DESCENDS
Coarse: 10 PM
Fine: 2.5 PM
HOWEVER, many of the exact mechanisms are still unclear and require further research
Ozone, Nitrogen Dioxide, and Sulphur Dioxide can cause a variety of symptoms
OZONE/O3 is the worst because it causes pretty much everything
Bronchoconstriction
Decreased FEV1/FVC
Increased airway responsiveness and airway inflammation
Enhanced responses to inhaled allergens
NO2/Nitrogen Dioxide (Second worst)
No bronchoconstriction or decreased FEV1/FVC
Sulphur Dioxide
Bronchoconstriction and enhanced responses to inhaled allergens ONLY
WORST BRONCHOCONSTRICTION
However, many of the exact mechanisms are still unclear and require further research
Exposure vs. Dose
Exposure
The product of the concentration measured near the organism of interest and the length of time the organism is presumably exposed to the pollutant.
Exposure is the accumulation of the instantaneous concentration over the time period of interest
Dose
In contrast to exposure, dose is the TOTAL amount of pollutant that ACTUALLY IS ABSORBED into the organism through the mouth/nose (in animals) or stomata (in plants) over a period of time.
Dose is the integral over time of the instantaneous flux.
![<p><strong><u>Impact of rising [CO<sub>2</sub>] on living organisms</u></strong></p><ul><li><p>Present concentration of atmospheric gasses</p><ol><li><p>[N<sub>2</sub>]=78%</p></li><li><p>[O<sub>2</sub>]=21%</p></li><li><p>[Ar]=0.93%</p></li><li><p><span style="color: blue"><strong>[CO<sub>2</sub>]=420ppm=0.0420%</strong></span></p><ul><li><p>CO<sub>2</sub> has to be AT LEAST 1% concentration for us to feel its effects, not really a concern</p></li></ul></li></ol></li></ul><p></p><ul><li><p>Inert gas asphyxiation—if [O<sub>2</sub>] drops below 19.5% as another gas concentration increases</p></li><li><p>In almost all situations, CO<sub>2</sub>-related asphyxiation <strong>is NOT a risk</strong> for humans</p></li></ul><p></p><p><strong><u>Main Symptoms of CO<sub>2 </sub>Toxicity</u></strong></p><ol><li><p>When you reach ~1% CO<sub>2</sub></p><ul><li><p>Drowsiness</p></li></ul></li></ol><p></p><ol start="2"><li><p>When you reach ~3% CO<sub>2</sub></p><ul><li><p>Mild narcosis</p></li><li><p>Increased heart rate and blood pressure</p></li><li><p>Reduced hearing</p></li></ul></li></ol><p></p><ol start="3"><li><p>When you reach ~5% CO<sub>2</sub></p><ul><li><p>Dizziness</p></li><li><p>Confusion</p></li><li><p>Headache</p></li><li><p>Shortness of breath</p></li></ul></li></ol><p></p><ol start="4"><li><p>When you reach ~8% CO<sub>2</sub></p><ul><li><p>Unconsciousness</p></li><li><p>Sweating</p></li><li><p>Tremor</p></li><li><p>Dimmed sight</p></li></ul></li></ol><p></p><p><strong><u>Examples of CO<sub>2</sub>-sensing Organisms</u></strong></p><ul><li><p><strong>Plant GUARD cells</strong>: Adjust stomatal aperture in response to changes in [CO<sub>2</sub>]</p></li><li><p><strong>Anthrax bacterium</strong> (<em>Bacillus anthracis)</em> & pathogenic fungi—senses HIGH [CO<sub>2</sub>] (~0.5%) to know when it arrives in a host’s lungs or bloodstreams</p><ul><li><p>High CO₂ is a physiological cue for anthrax (and some fungi) to switch from an environmental survival mode (spore) to an active infection mode.</p></li></ul></li><li><p><strong>Ants, bees, termites </strong>sense [CO<sub>2</sub>] to monitor hive activity and location</p></li><li><p>Some <strong>herbivorous insects</strong> (e.g. <em>Cactoblastic cactorum</em>) track tiny decreases in [CO<sub>2</sub>] to locate cacti to feed on at night</p></li><li><p><strong>Blood-sucking insects </strong>(mosquitoes, ticks, etc.) follow a trail to CO<sub>2</sub> to locate their next meal</p></li></ul><p>PRO TIP: Aim fan at door and mosquitoes will find it much more difficult to enter</p><p></p><p>**************************************************************************************</p><p><strong><u>South Coast Air Quality Monitoring District SCAQMD) - Right to Breathe Video</u></strong></p><p> </p><p><strong>Health Impacts:</strong> </p><ul><li><p class="">Many individuals and families suffer from <strong>asthma, respiratory issues, and cancer</strong>, often linked to <strong>air pollution</strong> from industrial sources and traffic.</p></li><li><p class="">Breathing problems dominate every aspect of life—<strong>when you can’t breathe, nothing else matters</strong>.</p></li></ul><p> </p><p><strong>Disproportionate Burden:</strong> </p><ul><li><p class=""><strong>Low-income and minority communities</strong> often live near <strong>freeways, factories, and refineries</strong>, while wealthier neighborhoods are spared.</p></li><li><p class="">These communities face <strong>higher exposure to pollutants</strong>, yet have <strong>less representation in environmental decision-making</strong>.</p></li></ul><p> </p><p> <strong>Pollution Sources & Consequences:</strong> </p><ul><li><p class=""><strong>Mobile sources</strong> (cars, trucks, planes, trains) are major contributors.</p></li><li><p class="">Pollution can <strong>ACTIVATE CANCER-RELATED GENES</strong> and may even <strong>affect fetal development</strong>.</p></li><li><p class="">Even though air quality has improved overall, <strong>“what you can’t see can still hurt you.”</strong></p></li></ul><p> </p><p><strong>Technology & Policy Solutions:</strong> </p><ul><li><p class="">Clean technologies (electric vehicles, fuel-cell cars) <strong>are emerging</strong> and <strong>must expand to heavier vehicles</strong>.</p></li><li><p class=""><strong>Policy, incentives, and public engagement</strong> are all needed to align for meaningful change.</p></li><li><p class="">Everyone—<strong>from individuals to policymakers</strong>—has a <strong>role to play</strong>.</p></li></ul><p> </p><p><strong>Call to Action:</strong> </p><ul><li><p class="">Educate communities, especially those with <strong>limited resources</strong>.</p></li><li><p class="">Small personal changes, like <strong>taking public transit</strong>, matter.</p></li><li><p class=""><strong>Use your voice</strong>—everyone has the right and responsibility to be part of the solution.<br><br><strong><u>What is air pollution?</u></strong></p></li></ul><ul><li><p><strong>Gasses</strong></p><ul><li><p>Ozone (O<sub>3</sub>)</p></li><li><p>Nitrous dioxide (NO<sub>2</sub>)</p></li><li><p>Sulfur dioxide (SO<sub>2</sub>)</p></li><li><p>Carbon monoxide (CO)</p></li></ul></li><li><p><strong>Particulate Matter (PM)</strong></p><ul><li><p>Categorized by particle size (in microns)</p></li><li><p>Two frequently used categories are:</p><ul><li><p>PM 2.5/FINE</p><ul><li><p>PRIMARILY combustion particles, organic compounds, metals <2.5microm in diameter</p></li></ul></li><li><p>PM 10/COARSE</p><ul><li><p>Dust, pollution, mould, <10microm in diameter</p></li></ul></li></ul></li></ul></li><li><p>Traffic-related air pollution (TRAP)</p></li><li><p>Outdoor vs. indoor</p></li></ul><p></p><p><strong><u>Sources of Outdoor Air Pollution</u></strong></p><ul><li><p>Where air pollution is produced and then moves is dependent on atmospheric circulation patterns, local wind patterns, weather conditions, and geography</p></li><li><p>Not always is place which produces pollution that gets the results of it</p></li><li><p>We have scientists that model the dynamics and travel patterns of atmospheric pollutants</p></li><li><p>Not always is the pollutant is a pollutant at the time its produced, due to atmospheric chemistry it can later be converted into a pollutant though</p></li></ul><p></p><p><strong><u>Primary Health Effects of Air Pollution </u>(KNOW FOR EXAM)</strong></p><ul><li><p>Linked to 5-7 million premature deaths per year</p></li><li><p>Exacerbation or onset of asthma, allergies, and inflammation</p></li><li><p>Increased respiratory and cardiovascular-related disease and mortality</p></li><li><p>PM (Particulate Matter) air pollution is a carcinogen linked to increased rates of lung CANCER</p><ul><li><p>Smallest particles are of biggest concern to us as they can make their way deeper into lungs, bronchioles, alveoli, even ending up absorbed in our BLOOD STREAM</p></li><li><p>THE FINER THE PM, THE LOWER IT DESCENDS </p><ul><li><p>Coarse: 10 PM</p></li><li><p>Fine: 2.5 PM</p></li></ul></li></ul></li><li><p>HOWEVER, many of the exact mechanisms are still unclear and require further research</p></li></ul><p></p><p><strong>Ozone, Nitrogen Dioxide, and Sulphur Dioxide </strong>can cause a variety of symptoms</p><ul><li><p>OZONE/O3 is the worst because it causes pretty much everything</p><ul><li><p>Bronchoconstriction</p></li><li><p>Decreased FEV1/FVC</p></li><li><p>Increased airway responsiveness and airway inflammation</p></li><li><p>Enhanced responses to inhaled allergens</p></li></ul></li><li><p>NO2/Nitrogen Dioxide (Second worst)</p><ul><li><p>No bronchoconstriction or decreased FEV1/FVC</p></li></ul></li><li><p>Sulphur Dioxide</p><ul><li><p>Bronchoconstriction and enhanced responses to inhaled allergens ONLY</p></li><li><p>WORST BRONCHOCONSTRICTION</p></li></ul></li></ul><p></p><p><strong><u>However, many of the exact mechanisms are still unclear and require further research</u></strong></p><p></p><p><strong><u>Exposure vs. Dose</u></strong></p><ul><li><p><strong>Exposure</strong></p><ul><li><p>The product of the concentration measured near the organism of interest and the length of time the organism is presumably <em>exposed</em> to the pollutant.</p></li><li><p>Exposure is the accumulation of the instantaneous concentration over the time period of interest</p></li></ul></li><li><p><strong>Dose</strong></p><ul><li><p>In contrast to exposure, dose is the TOTAL amount of pollutant that ACTUALLY IS ABSORBED into the organism through the mouth/nose (in animals) or stomata (in plants) over a period of time.</p></li><li><p>Dose is the integral over time of the instantaneous flux.</p></li></ul></li></ul><p></p>](https://knowt-user-attachments.s3.amazonaws.com/75da94bc-cf03-4630-93fa-044e5e4beb0f.png)
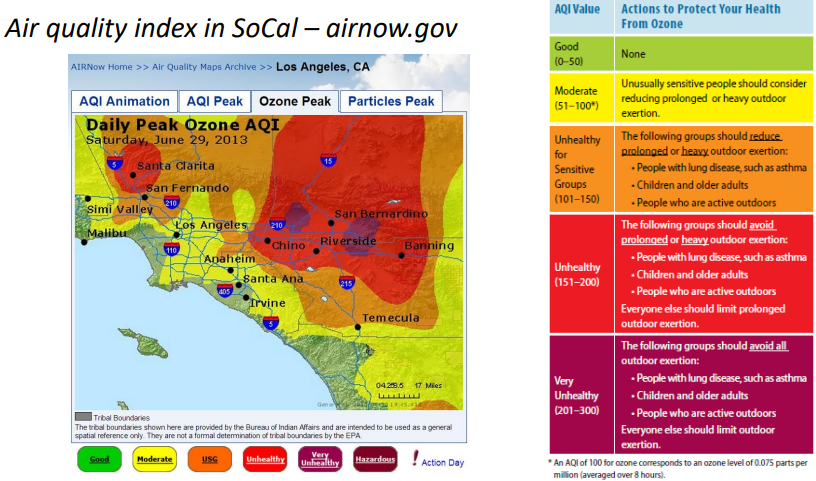
Describe the causes of indoor air pollution and its impacts on women and children
Explain how we were able to significantly improve the air quality in Southern California over the past 50 years, and how successful China was in the past 4 years
Outline the impact of the Clean Air Act and the original purpose of the EPA
Indoor Air Pollution — Leaky stoves and solid fuel
World Health Org. estimates that in 2012 there were up to 1.2 MILLION premature deaths attributed to household air pollution in South & SE Asia
LEAKY inefficient STOVES & SOLID FUEL (mix of wood, coal, dung, and crop residues) cause indoor air pollution
Women and children are INDOORS COOKING and bear the brunt of the pollution
Heart disease, stroke, COPD, lung cancer in OLDER WOMEN
Acute respiratory illness in CHILDREN
Air Pollution May Harm Babies Even Before They Are Born
Study in London found that exposure to (Particulate Matter) PM 2.5 above a CERTAIN THRESHOLD was linked to LOWER BIRTH WEIGHTS (LBW)
Other components of air pollution were studied but no clear link was found
Daily Peak Ozone Air Quality Index (AQI) SoCal: Based on Ozone/O3 Levels
AN AQI OF 100 FOR GROUND LEVEL OZONE CORRESPONDS TO AN OZONE LEVEL OF 0.075 PPM
Ozone forms when sunlight reacts with pollutants like nitrogen oxides (NOₓ) and volatile organic compounds (VOCs), usually from cars, power plants, and industrial emissions.
Increments of 50
Good (0-50)
Moderate (51-100): Consider reducing prolonged outdoor exertion
Unhealthy for Sensitive Groups (101-150): Lung disease, asthma, children, older adults should REDUCE prolonged/heavy outdoor exertion
Unhealthy (151-200): Vulnerable groups AVOID prolonged/outdoor exertion, normal people REDUCE it
Very Unhealthy (201-300): Vulnerable should AVOID ALL outdoor exertion, normal people also LIMIT
HAZARDOUS (301+): EMERGENCY CONDITIONS
San Bernardino and Riverside Counties Very Unhealthy (201-300) in SoCal in 2013, daily peak
Overall Unhealthy for Sensitive Groups (101-150) on average
Off the Pacific Coast is lower: MODERATE (51-100)
Air Quality is improving in LA Basin & US as a Whole
Concentration (ppm) is as of 2012 hovering around 0.075 ppm
Was at its peak in 1992 where it was over 0.150 ppm
NO (Nitrogen Oxides) react with sunlight to form O3/Ozone
US still the most but decreased significantly in terms of polluting
PEAKED at 100 kilotons per million population, now at 20
PM (Particulate Matter) 2.5 PM/FINE
PRIMARILY combustion particles, organic compounds, metals <2.5micrometers in diameter
US gradually decreasing, now at 3 kilotons per million population
CHINA VERY HIGH at about 8-10 kilotons per million population
SO2 emissions per year
React with water and oxygen to form H2SO4 (sulfuric acid) which can acidify rain
US used to be the highest at 80 kilotons per million population
Now is lower than China at 10-ish
For NO, PM 2.5, and SO2; UK always lowest
Who invited bro?
Why has air quality improved in the U.S.?
The Clean Air Act (1970) was passed by Congress and the newly formed Environmental Protection Agency was tasked to enforce it
The EPA (Environmental Protection Agency) also sets federal air quality standards and levies fines for companies or cities that don’t meet those standards
THERE ARE LIMITS
NOx (nitrogen oxide) emissions have been LOWERED by increasing the EFFICIENCY of CARS and TRUCKS and requiring stricter emissions (smog) testing to fix or remove older cars with high levels
SO2 emissions have been REDUCED by RETROFITTING COAL-fired power PLANTS with FILTERS to PREVENT it from ESCAPING into the ATMOSPHERE
Also greater reliance now on natural gas for power generation
Calling Car Pollution Standards “Too High,” E.P.A. Sets up Fight with California
Car fuel economy standards for each automaker are required to average 54.5 MPG by 2025
California has HIGHER/STRICTER fuel economy and emissions standards than the federal gov’t
However, during the Trump presidency, the EPA tried to rollback or eliminate these standards even though many AUTOMAKERS THEMSELVES didn’t want them to
Smog Chokes Delhi, Leaving Residents “Cowering by Our Air Purifiers”
Levels of PM2.5 (fine particulate matter that penetrates deep into the lungs) reached more than 16 times the government’s safe limit, creating emergency-level pollution.
Residents reported headaches, burning eyes, breathing difficulties, and fatigue — classic symptoms of acute smog exposure. Long-term risks include lung disease, heart conditions, and cognitive impairment.
People described themselves as “cowering by our air purifiers”, with many choosing to stay indoors, wear N95 masks, or run multiple air filters at once. Schools and outdoor activities were suspended in some areas.
Primary Causes:
Crop stubble burning in nearby states like Punjab and Haryana.
Vehicular emissions and industrial pollution.
Cooler temperatures and low wind speeds that trap pollutants close to the ground (temperature inversion).
Government Measures:
Authorities imposed restrictions under the Graded Response Action Plan (GRAP) — including banning construction, closing schools, and reducing traffic — but critics say enforcement is inconsistent.
Four Years After Declaring War on Pollution, China Is Winning
In March 2014 they declared WAR on Pollution just as they once declared WAR on Poverty
Banned any new coal power plants
Replaced coal with natural gas
Restricted # of cars on the road in major cities
Cut back on industrial production on days where smog was forecast to be severe
FOUR YEARS LATER… CHINA:
PM levels reduced 32% on avg
Lifespans in some cities increased by as much as 5.3 years (!)
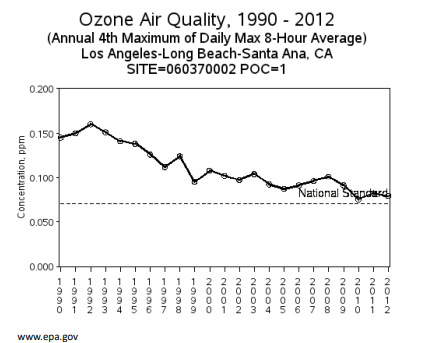
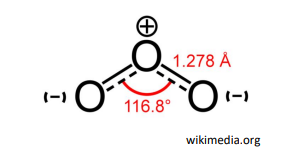
Identify the layers of the atmosphere and describe some of their characteristics
Describe the photochemistry associated with the formation of ozone
Name the Layers of the Atmosphere from Top-to-Bottom
Upper Atmosphere
Exosphere
Air dwindles to nothing as molecules drift into space
Thermosphere
Where the temperature is at its highest due to absorption of solar radiation, contains electrically charged particle, creates Northern & Southern Lights)
Middle Atmosphere
Mesosphere
Where space debris begins to burn up, temperature drops as you leave earth and start to enter space
Stratosphere
90% of protective ozone/O3 layer floats here
Contains 20% of the molecules in the atmosphere and gets warmer as you go away form earth
Lower Atmosphere
Troposphere
10% of ozone/O3 layer is here
Referred to as “tropospheric/surface/ground-level OZONE”
Comes from EMISSIONS from industrial facilities and vehicle exhaust forming (NOx/Nitric oxides) and (volatile organic compounds/VOC) which react together in presence of heat to form OZONE
NOx+VOC+Heat—>Ozone
4500 teragrams (Tg) of ozone produced per year in the TROPOSPHERE
Where weather forms
Storms take place here
Photochemistry of O3 Formation and Breakdown (Tropospheric/BAD Ozone)
Vehicles/Factories emit nitric oxides (NOx) and volatile organic compounds (VOCs: CH4s, COs and NMHCs)
VOCs react with OH• radicals forming PEROXY radicals RO2• / HO2•/RCO₃•
RO2• / HO2• + NO —>NO2 (Peroxy radicals oxidize nitrous oxide into NO2)
NO2 photolyzed by UV light —> NO + O (atomic oxygen)
O + O2 (in atmosphere) —>O3 (OZONE)
The newly formed O₃ accumulates near the surface (troposphere) when:
There's ongoing NO₂ photolysis
VOCs & peroxy radicals regenerate NO₂ without depleting O₃
Stable atmospheric conditions limit dispersion
Competing Reactions that REMOVE NO2 or O3
If OH• forms with NO2 instead of VOCs, NO2 will become HNO3 (nitric acid)
If RCO₃• reacts with NO2 instead of NO —> PAN
TROPOPAUSE (Racist gatekeeper, no gas mixing!)
Layer separates troposphere and stratosphere restricting large-scale ozone mixing
Photochemistry of O3 Formation and Breakdown (Stratospheric/GOOD Ozone)
Exists naturally above the Earth
Formed when UV light splits O2 into O+O
O + O2 —> O3
Protects life on Earth by absorbing harmful UV radiation
540 Tg (teragrams)/year of O3 moves between the stratosphere and troposhere
Some descends from strat to trop
Less rises from trop to strat
1000 Tg/year of O3 is REMOVED by DEPOSITION to Earth’s surface
Vegetation, soil, water
Chemical LOSS
5400 Tg/year of ozone is lost chemically via reactions in the atmosphere
Ozone (O3)
Strong oxidant, highly reactive
SHORT-LIVED greenhouse gas
PRIMARY COMPONENT OF SMOG
Smog is a type of air pollution formed when sunlight reacts with pollutants like nitrogen oxides and volatile organic compounds, producing ground-level ozone—a primary component of smog that irritates the lungs and worsens air quality.
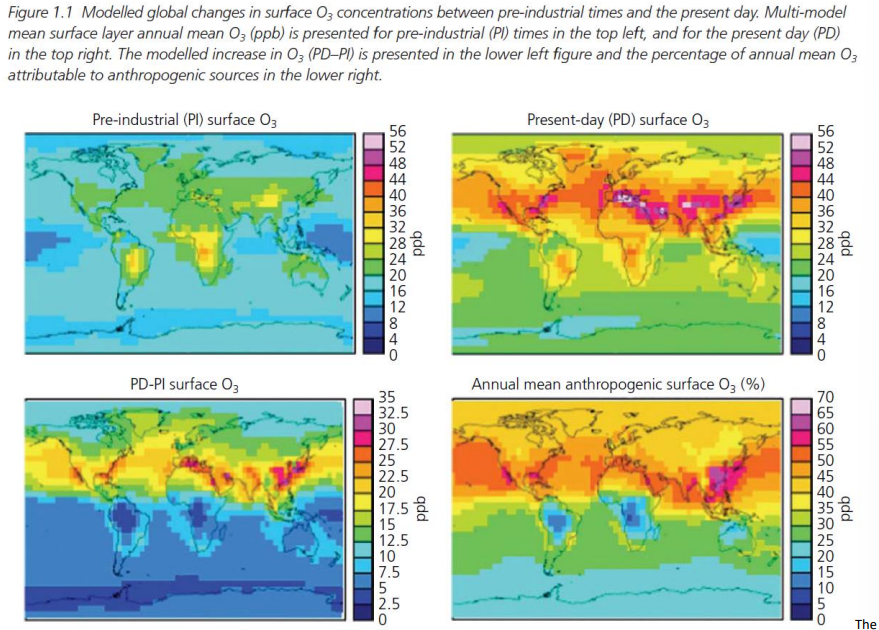
List the precursors of O3 and their associated sources
Describe the environmental factors that increase or decrease ozone formation
Describe the spatial and temporal dynamics of tropospheric ozone
List several surface ozone metrics and explain how they are calculated
Natural and Anthropogenic Sources of O3 Precursors
CH₄ (Methane) → Mostly natural, some anthropogenic
nmVOC (all) → All anthropogenic (except for isoprene nmVOCs; natural)
nmVOC (isoprene only) → Only natural
NOx (soil, lightning, vegetation) → Both natural and anthropogenic
CO (Carbon monoxide) → Only anthropogenic (natural = negligible)
Top Contributors to O3 Precursors
Isoprene (500-600 Tg); nmVOC, natural
CO (Carbon Monoxide); 550 Tg, anthropogenic (incomplete combustion)
CH4: Natural + Anthropogenic (most) combine into 530 Tg
Environmental Factors Influencing O3 Formation
INCREASE O3 Formation
Sunny, bright conditions
Hot temperatures
STILL (by Ben Folds) air
DECREASE O3 Formation
Rainy, cloudy conditions
Cool temperatures
Wind dispersing O3 precursors
WIND IS HOWLING
Modelled Global Changes in Surface O3 Concentrations Between Pre-INdustrial Times and Present Day (GRAPH 1)
Surface ozone has increased SIGNIFICANTLY from pre-industrial times, especially across the Northern Hemisphere (North America, Europe, South & East Asia).
Anthropogenic emissions (e.g. NOx and VOCs from vehicles, industry, agriculture) are now the dominant source of surface ozone in populated regions — accounting for over 65% in some areas.
Industrial and urban areas show the largest absolute increases in surface ozone (up to ~32 ppb), highlighting the link between development and air pollution.
Tropics and SOUTHERN Hemisphere still show LOWER ozone levels, with most increases concentrated in northern mid-latitudes.
Present-day surface ozone levels now commonly exceed 40–50 ppb in many regions — levels associated with adverse health and environmental effects.
Tropospheric O3 Has Negative Impacts on Humans and Plants
Tropospheric O3 is the SECOND MOST significant airborne pollutant affecting human mortality worldwide after particulate matter (PM)
Damaging to human health when [O3] exceeds 70-75ppb –
Aggravates asthma
Damages lung tissue and may lead to infections
Estimated to be linked to 700,000 DEATHS PER YEAR; more than 75% of O3-related deaths are in ASIA
Manifested as effects on respiratory system and aggravation of pulmonary disease (asthma, bronchitis, pneumonia, etc.)
Plants are even more sensitive to ozone than animals are
Significant visible FOLIAR DAMAGE and REDUCED BIOMASS or grain YIELD is observed when [O3] exceeds 40 PPB
HUMANS: 70-75 PPB OR MORE IS DANGEROUS
PLANTS: 40 PPB OR MORE IS DANGEROUS
Describe the spatial and temporal dynamics of tropospheric ozone
Ozone levels are not evenly distributed, even within the same metropolitan area
Highest ozone AQI was inland (San Bernardino area)
Unhealthy-To-Very-Unhealthy: 151-300 AQI
Lowest ozone AQI was coastal (Santa Monica area)
Good-Moderate: 0-100 AQI
DAILY fluctuations in ozone levels; changes in weekdays to weekends might be due to changes in traffic and industrial activity
Diurnal/Daily Patterns of [O3] (GRAPH 2)
Ozone tends to peak around 4:00 PM/16:00
Ozone decreases overnight and continues to drop until sunrise where it begins to climb and is helped by traffic/rush hour at 4:00 PM to its peak of around 38 O3 ppb
Wharley Croft: Very LOW, by sea level
Lower baseline than Fell
Great Dun Fell: Very HIGH, mountainous
Higher baseline than Wharley Croft, stays basically the same range peaking at 4:00 PM before slightly decreasing to previous threshold
Rural, elevated sites like Great Dun Fell have less ozone destruction (less NO) and receive more background or transported ozone, resulting in a higher and more stable baseline concentration than urban lowland sites.
Ozone Air Quality Standards
National Level: Environmental Protection Agency (EPA)
State Level: California Air Resources Board (ARB)
We have different ozone air quality standards in different places, states, nationally, and internationally
Ambient Air Quality Standards
ARB (California), slightly more STRICT:
1 hour average: 0.09 ppm
8 hour average: 0.070 ppm
EPA:
8 hour average: 0.075 ppm
List several surface ozone metrics and explain how they are calculated
SUM06: Summation of all hourly ozone concentrations at or above 0.06 ppm
W126: Sigmoidally weighted index that preferentially weighs higher concentrations over mid-to-low levels
AOT40: The accumulation over a threshold by subtracting 40 ppb (0.040 ppm) from the value of each hourly concentration above that threshold and accumulating each hourly difference over a specified time window
Avg. Conc: 7-hour seasonal mean concentrations, 8-h average concentrations or seasonal average concentration
Flux-Based: Accumulation of a temporally dynamic measure of the rate of ENTRY of the POLLUTANT into the leaf
M7: Mean [O3] during local midday hours (9AM-4PM); MORE SPECIFIC
M12: Mean [O3] during local daytime hours (8AM-8PM); BROADER RANGE
All of them are EXPOSURE-BASED indices except for flux-based which measures the O3 actually absorbed by the plant and its physiological impact thus making it DOSE-BASED
![<p><strong><u>Natural and Anthropogenic Sources of O<sub>3</sub> Precursors</u></strong></p><ul><li><p><strong>CH₄ (Methane)</strong> → Mostly natural, some anthropogenic</p></li><li><p class=""><strong>nmVOC (all)</strong> → All anthropogenic (except for isoprene nmVOCs; natural)</p></li><li><p class="">nmVOC (isoprene only) → Only natural</p></li><li><p class="">NOx (soil, lightning, vegetation) → Both natural and anthropogenic</p></li><li><p class="">CO (Carbon monoxide) → Only anthropogenic (natural = negligible)</p></li></ul><p class=""></p><p class=""><strong>Top Contributors to O<sub>3</sub> Precursors</strong></p><ol><li><p class="">Isoprene (500-600 Tg); nmVOC, natural</p></li><li><p class="">CO (Carbon Monoxide); 550 Tg, anthropogenic (incomplete combustion)</p></li><li><p class="">CH<sub>4</sub>: Natural + Anthropogenic (most) combine into 530 Tg</p></li></ol><p class=""></p><p class=""><strong><u>Environmental Factors Influencing O<sub>3</sub> Formation</u></strong></p><p class=""><strong>INCREASE O<sub>3</sub> Formation</strong></p><ul><li><p class="">Sunny, bright conditions</p></li><li><p class="">Hot temperatures</p></li><li><p class="">STILL (by Ben Folds) air</p></li></ul><p class=""><strong>DECREASE O<sub>3</sub> Formation</strong></p><ul><li><p class="">Rainy, cloudy conditions</p></li><li><p class="">Cool temperatures</p></li><li><p class="">Wind dispersing O<sub>3</sub> precursors</p><ul><li><p class="">WIND IS HOWLING</p></li></ul></li></ul><p class=""></p><p class=""><strong><u>Modelled Global Changes in Surface O<sub>3 </sub>Concentrations Between Pre-INdustrial Times and Present Day</u> (GRAPH 1)</strong></p><ul><li><p class=""><strong>Surface ozone has increased SIGNIFICANTLY </strong>from pre-industrial times, especially across the Northern Hemisphere (North America, Europe, South & East Asia).</p></li><li><p class=""><strong>Anthropogenic emissions</strong> (e.g. NOx and VOCs from vehicles, industry, agriculture) are now the <strong>dominant source</strong> of surface ozone in populated regions — accounting for <strong>over 65%</strong> in some areas.</p></li><li><p class=""><strong>Industrial and urban areas</strong> show the <strong>largest absolute increases</strong> in surface ozone (up to ~32 ppb), highlighting the link between development and air pollution.</p></li><li><p class=""><strong>Tropics and SOUTHERN Hemisphere</strong> still show <strong>LOWER ozone levels</strong>, with most increases concentrated in northern mid-latitudes.</p></li><li><p class=""><strong>Present-day surface ozone levels</strong> now commonly exceed <strong>40–50 ppb</strong> in many regions — levels associated with <strong>adverse health and environmental effects</strong>.</p></li></ul><p></p><p><strong><u>Tropospheric O<sub>3</sub> Has Negative Impacts on Humans and Plants</u></strong></p><ul><li><p>Tropospheric O<sub>3</sub> is the SECOND MOST significant airborne pollutant affecting human mortality worldwide after particulate matter (PM)</p></li><li><p><span style="color: blue"><strong>Damaging to human health when [O3] exceeds 70-75ppb –</strong></span></p><ul><li><p>Aggravates asthma</p></li><li><p>Damages lung tissue and may lead to infections</p></li></ul></li><li><p>Estimated to be linked to 700,000 DEATHS PER YEAR; more than 75% of O3-related deaths are in ASIA</p><ul><li><p>Manifested as effects on respiratory system and aggravation of pulmonary disease (asthma, bronchitis, pneumonia, etc.)</p></li></ul></li><li><p>Plants are even more sensitive to ozone than animals are</p><ul><li><p>Significant visible FOLIAR DAMAGE and REDUCED BIOMASS or grain YIELD is observed when [O3] exceeds 40 PPB</p><p></p></li></ul></li></ul><p>HUMANS: 70-75 PPB OR MORE IS DANGEROUS</p><p>PLANTS: 40 PPB OR MORE IS DANGEROUS</p><p></p><p><strong><u>Describe the spatial and temporal dynamics of tropospheric ozone</u></strong></p><ul><li><p>Ozone levels are <strong>not evenly distributed</strong>, even within the same metropolitan area</p><ul><li><p>Highest ozone AQI was inland (San Bernardino area)</p><ul><li><p>Unhealthy-To-Very-Unhealthy: 151-300 AQI</p></li></ul></li><li><p>Lowest ozone AQI was coastal (Santa Monica area)</p><ul><li><p>Good-Moderate: 0-100 AQI</p></li></ul></li></ul></li><li><p>DAILY fluctuations in ozone levels; changes in weekdays to weekends might be due to changes in traffic and industrial activity</p></li></ul><p></p><p><strong><u>Diurnal/Daily Patterns of [O<sub>3</sub>]</u> (GRAPH 2)</strong></p><ul><li><p>Ozone tends to peak around 4:00 PM/16:00</p><ul><li><p>Ozone decreases overnight and continues to drop until sunrise where it begins to climb and is helped by traffic/rush hour at 4:00 PM to its peak of around 38 O<sub>3</sub> ppb</p></li></ul></li><li><p><strong>Wharley Croft: Very LOW, by sea level</strong></p><ul><li><p>Lower baseline than Fell</p></li></ul></li><li><p><strong>Great Dun Fell: Very HIGH, mountainous</strong></p><ul><li><p>Higher baseline than Wharley Croft, stays basically the same range peaking at 4:00 PM before slightly decreasing to previous threshold</p><p></p></li></ul></li></ul><p><strong>Rural, elevated sites</strong> like Great Dun Fell have <strong>less ozone destruction (less NO)</strong> and <strong>receive more background or transported ozone</strong>, resulting in a <strong>higher and more stable baseline concentration</strong> than urban lowland sites.</p><p></p><p><strong><u>Ozone Air Quality Standards</u></strong></p><ul><li><p>National Level: Environmental Protection Agency (EPA)</p></li><li><p>State Level: California Air Resources Board (ARB)</p></li><li><p>We have different ozone air quality standards in different places, states, nationally, and internationally</p></li></ul><p><strong>Ambient Air Quality Standards</strong></p><ul><li><p>ARB (California), slightly more STRICT:</p><ul><li><p>1 hour average: 0.09 ppm</p></li><li><p>8 hour average: 0.070 ppm</p></li></ul></li><li><p>EPA:</p><ul><li><p>8 hour average: 0.075 ppm</p></li></ul></li></ul><p></p><p><strong><u>List several surface ozone metrics and explain how they are calculated</u></strong></p><ol><li><p><strong><u>SUM06: </u></strong>Summation of all hourly ozone concentrations at or above 0.06 ppm</p></li><li><p><strong><u>W126:</u></strong> Sigmoidally weighted index that preferentially weighs higher concentrations over mid-to-low levels</p></li><li><p><strong><u>AOT40:</u></strong> The accumulation over a threshold by subtracting 40 ppb (0.040 ppm) from the value of each hourly concentration above that threshold and accumulating each hourly difference over a specified time window</p></li><li><p><strong><u>Avg. Conc:</u></strong> 7-hour seasonal mean concentrations, 8-h average concentrations or seasonal average concentration</p></li><li><p><strong><u>Flux-Based</u></strong>: Accumulation of a temporally dynamic measure of the rate of ENTRY of the POLLUTANT into the leaf</p></li><li><p><strong><u>M7:</u> </strong>Mean [O<sub>3</sub>] during local midday hours (9AM-4PM); MORE SPECIFIC</p></li><li><p><strong><u>M12:</u></strong> Mean [O<sub>3</sub>] during local daytime hours (8AM-8PM); BROADER RANGE</p></li></ol><p></p><p>All of them are EXPOSURE-BASED indices except for <strong><u>flux-based</u></strong> which measures the O<sub>3</sub> actually absorbed by the plant and its physiological impact thus making it <strong><u>DOSE-BASED</u></strong></p><p></p>](https://knowt-user-attachments.s3.amazonaws.com/2f9c0219-127f-4f4c-b05c-060f2aeb8d04.png)
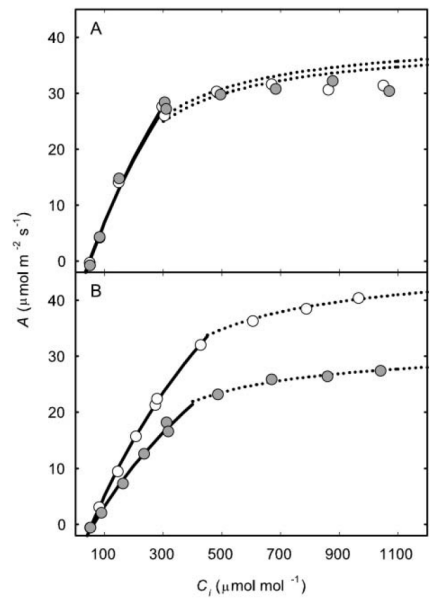
Describe the 3 general modes of ozone damage in plants (hypertoxic, acute, chronic) in terms of their concentration, symptoms, and impacts
Describe the basic mechanism through which ozone enters the plant and damages it
Outline the range of impacts of tropospheric ozone on plant function and productivity
Explain the impacts of surface ozone on soybean growth and productivity and outline the SoyFACE project
Visible Leaf Injury Due to O3 Exposure
O3 leaf damage RESEMBLES plant pathogen INFECTION
O3 damage looks whiter/bleaching/loss of color, but can ALSO have necrotic spots that are brownish/darkish which is the way that BACTERIALLY INFECTED LEAVES LOOK
Ozone Effects in Plants — 3 General Categories
Chronic (>40 ppb for DAYS)
Gradual effects (within days or weeks)
Decreased Rubisco content and PS rates
Accelerated foliar senescence (leaves age faster and DIE)
Overall biomass and yields DECREASE
Acute (>150ppb for HOURS)
IMMEDIATE effects (within hours)
Decreased PS rates and stomatal conductance
Rapid development of VISIBLE SYMPTOMS like leaf bronzing & necrosis
Possible on a “smog alert” day
Hypertoxicity (>400ppb for MINUTES/HOURS)
IMMEDIATE effects (within hours/minutes)
Direct DAMAGE to plant cells
Disruption of cell membrane function
Rapid development of VISIBLE SYMPTOMS like leaf bronzing & necrosis
Describe the basic mechanism through which ozone enters the plant and damages it
O3 enters the leaf through the stomata
O3 triggers a cascade of hormonal changes and signalling within the plant
The initial trigger is the production of ROS (reactive oxygen species) in the APOPLAST (this is the same whether it be abiotic/O3 or biotic/infection stress)
This leads eventually to CHANGED GENE EXPRESSION, ion concentrations, protein & chlorophyll degradation, and cell DEATH/apoptosis
Apoplast: Extracellular space between cell wall and plasma membrane
O3 reacts with this
Plant immune response is two pronged
Hypersensitive response (HR)
Localize infection and kill infection via PCD/apoptosis
Systemic acquire resistance (SAR)
Acquired resistance, after you recover you have protection form same pathogen
O3 stress impacts in plants at various levels
Community Effects
DECREASE in net primary productivity
INCREASE in shifts of composition of species and genotypes
Whole-Plant Effects
DECREASE in biomass, leaf area, reproductive output
INCREASE in defense and senescence/deterioration
Leaf-Effects
DECREASE in PS, Starch & Sucrose Metabolism
INCREASE in Respiration, foliar damage, wax accumulation
Cellular-Effects
DECREASE in Rubisco content and activity
INCREASE in ROS, protein repair, flavonoid biosynthesis
General plant responses to chronic O3 exposure
Decreased photosynthetic rates
Decreases in both Vc,max and Jmax
Decreased Rubisco content
Lower stomatal conductance
Due to direct O3 effect impairing biochemical function
A-Ci Curve (GRAPH 1)
Plots the rate of photosynthetic CO₂ assimilation (A) against intercellular CO₂ concentration (Ci) in a leaf.
It’s used to assess PS capacity and to distinguish between
STOMATAL limitations (low Ci)
BIOCHEMICAL limitations (low Rubisco activity or electron transport, low A) in carbon fixation.
Prolonged ozone exposure reduces photosynthetic capacity by damaging the biochemical machinery (not just affecting CO₂ entry via stomata).
The DECREASE in A–Ci indicates reduced carbon assimilation efficiency, even when Ci is not limiting.
This supports the conclusion that O₃ impairs photosynthesis primarily through direct, non-stomatal effects.
As Tropospheric ozone, increases; crop yields DECREASE
Glycine max. is an economically relevant agricultural species which displays a high sensitivity to ozone
Current [O3] levels in Illinois result in approximately 40% LOSS of potential SOYBEAN YIELDS, costing billions of dollars
Ozone damage to crop productivity is also significant in the Central Valley
Worldwide, biggest crop losses are occurring in South, SE Asia, and China
Explain the impacts of surface ozone on soybean growth and productivity and outline the SoyFACE project
SoyFACE was designed to discover the effects of atmospheric change on the agronomy and productivity of Midwestern crops as well as to find solutions that will lead to crops better ADAPTED to this future
By subjecting plots to higher CO2 and O3
SoyFACE Experimental Design
Location: Champaign, IL (University of Illinois)
2001-TO THIS DAY
Study Species:
Glycine max. (soybean)
Zea mays (corn)
Treatments (8 replicates each):
Elevated [CO2]
Elevated [O3]
Elevated [CO2] x [O3]
Elevated air temperature
DROUGHT (low soil moisture)
SoyFACE Ozone Fumigation/Control System
SoyFACE simulates future ozone conditions in open-air crop fields by exposing plants to elevated O₃ concentrations — specifically, 50% above real-time ambient levels.
The system uses real-time monitoring and adjustment:
Ozone analyzer, wind sensors, and a control computer continuously adjust output to match target levels based on weather and ambient O₃.
The graph shows system performance on Sept 11, 2002:
Treatment plot (blue line) consistently reaches the elevated target O₃ level while system is on.
When the system turns off, ozone levels RETURN to AMBIENT.
This setup allows researchers to study the long-term effects of realistic ozone pollution on crop growth, physiology, and yield under field conditions, not just in chambers.
SoyFACE [O3] and O3 Exposure Indices
EXPOSURE INDICES are quantitative measures of how much ozone plants are exposed to over time, typically above a certain threshold, and in this project they are used to assess the cumulative ozone stress experienced by crops under both ambient and elevated conditions, helping link ozone exposure to physiological and yield impacts.
Elevated O₃ treatments (gray circles) consistently resulted in higher daily maximum 8-hour average O₃ compared to ambient (black line) across both growing seasons (2002 and 2003).
The seasonal ozone exposure was significantly GREATER under elevated O₃, CONFIRMING successful long-term enhancement and STEADY ACCUMULATING of ozone in treatment plots.
Despite year-to-year variability in ambient O₃ levels, the relative difference between elevated and ambient exposure remained consistent, demonstrating system stability and repeatability.
These data confirm that SoyFACE can reliably simulate chronic ozone exposure, allowing researchers to assess its seasonal impacts on crops in a field-realistic setting.
Decreases in soybean yield under O3 stress are due to multiple factors
FEWER NODES created during vegetative phase
This leads to fewer pods, fewer seeds overall
FASTER leaf SENESCENCE
FEWER leaves in canopy at beginning of pod-FILLING STAGE
FEWER ACTIVE leaves
Less photosynthesis and sugar production for pod-filling
END AT DECREASES IN SOYBENAN YIELD UNDER O3 STRESSES ARE DUE TO MULTIPLE FACTORS
If plants age faster, they make fewer nodes
In case of soybeans, how many nodes/leaves you produce tells you how many pods are produced…
LECTURE 20 FOR POWERPOINT PRESENTATION OUTLINE AND GOOD STUDENT PRESENTATION
Informative visuals and bullet points and subbullet points
Not too wordy but not too vague either
APRIL 22